
Visual Studio Code Succinctly®

CHAPTER 4
Creating and Debugging Applications
Being an end-to-end development environment, Visual Studio Code offers opportunities that you will not find in other code editors. In fact, with Code you can create and debug a number of application types. This chapter will get you started writing web applications with Visual Studio Code, providing guidance on debugging as well where supported.
Chapter prerequisites
Before you start writing web applications with Visual Studio Code, you need to make sure you have installed the following prerequisites:
- Node.js, a JavaScript runtime that includes, among the others, the npm (Node Package Manager) command-line tool.
- DNX, the.NET Execution Environment required to build cross-platform web applications with ASP.NET Core 1.0 (formerly ASP.NET 5), the new development platform from Microsoft for the next generation of cross-platform web apps.
DNX integrates well with Node.js and provides additional command-line tools that you will use very often. The next step is installing Yeoman, a very popular command-line tool that helps you with scaffolding a variety of modern web projects. Installing Yeoman is very easy: Open a command prompt and type the following line, assuming you have already installed Node.js:
> npm install -g yo generator-aspnet gulp bower
This line will install the ASP.NET Core generator from Yeoman (also referred to as yo), plus Gulp and Bower.
Note: If you are new to cross-platform web development, you might wonder what Gulp and Bower are. In a few words, Gulp is a tool that simplifies the automation of repetitive tasks whereas Bower is a library and package manager for web apps. Click their links in the previous paragraph to get more information.
If you are wondering why you need these additional tools, the answer is very simple: They allow creating and managing applications in a way that is completely platform and environment independent. For instance, Yeoman generates ASP.NET Core applications based on project.json files, which is suitable for Visual Studio Code and many other development tools on different operating systems and platforms. This is different from creating ASP.NET Core apps with Microsoft Visual Studio, which generates proprietary solution files. Though the result is the same, and though Visual Studio is much more powerful, of course, you need Windows and Visual Studio itself. Another prerequisite is installing the Express application framework that you use to scaffold a Node.js application. The command you type in the command line is the following:
> npm install -g express-generator
Now you have all the necessary tools and are ready to go.
Creating an ASP.NET Core web application
To create your first ASP.NET Core web application for Visual Studio Code, you need to run the Yeoman tool from the command line and type a few lines.
Tip: The previous sentence is true in part. You can actually launch Yeoman from the Command Palette in Visual Studio Code by typing Yo, pressing Enter, and then selecting the proper commands. However, you must first have knowledge of the commands themselves; this is why you should type them manually first.
Yeoman generates a new web application in a subdirectory of the current directory, so you must be sure of where you want to create the application. For instance, suppose you have a folder called C:\MyWebApps. Open a command prompt for this folder, and then type the following line:
> yo aspnet
This will launch the Yeoman ASP.NET 5 generator, which provides a number of possible choices as shown in see Figure 69.

Figure 69: The Yeoman ASP.NET 5 Generator
Notice how you can create a variety of projects, including the popular Web API. Select the Web Application template and press Enter. You will be prompted to enter a name for the application. For consistency, type CodeSuccinctlyWeb and press Enter. Yeoman generates a subfolder called C:\MyWebApps\CodeSuccinctlyWeb and all the necessary files for scaffolding the application in this folder. You can see the generation progress in the Console window and, at completion, Yeoman suggests a sequence of commands to run (see Figure 70).

Figure 70: Progress Reporting and Command Suggestions
For now, you can skip running the suggested commands, as you will do this from within Visual Studio Code shortly.
Tip: dnu stands for .NET Utilities and allows executing specific actions against projects. Type dnu –help for further information
Now open Visual Studio Code, select File > Open Folder, and select the CodeSuccinctlyWeb folder. Visual Studio Code will find a project.json file and organize the files in a proper view.
Note: Explaining how an ASP.NET Core project is structured is beyond the scope of this book. Here we focus on how to work with ASP.NET Core projects in VS Code. For further details, refer to the official ASP.NET Core documentation.
Restoring NuGet packages
When Code opens an ASP.NET Core project, it analyzes the project.json file and checks if all the required NuGet packages are available. If they aren't, it shows a message and offers to restore NuGet packages for you (see Figure 71). Missing NuGet packages are probably the most common cause for many errors in the source code. In Figure 71 you can see a huge number of red squiggles regarding the fact that the code editor does not know how to parse that code unless the required packages are restored.

Figure 71: Code offers to restore missing NuGet packages.
You can manually request to restore NuGet packages in the Command Palette by first typing dnx restore packages, and then selecting the dnu restore command. If you have multiple projects in your folder, you will have an option to target a specified project. Once you restore all the NuGet packages, the red squiggles will go away.
Running the application
You have just built your first ASP.NET 5 application for Visual Studio Code and you are ready to see how to get it up and running. In the Command Palette, type dnx run command. This will display two available commands: dnx web and dnx ef. The first command builds and starts the web application, whereas the second command allows Entity Framework commands to be executed against a project. For now, execute dnx web. To deploy your applications, Visual Studio Code uses a new development server that replaces IIS Express, called Kestrel. When you execute the command, a console window appears providing information about the application execution, including errors and problems, during the entire life cycle. By default, Kestrel listens for the application on port 5000, which means your application can be reached at http://localhost:5000 and will appear as shown in Figure 72.

Figure 72: The sample web application is up and running.
Tip: You can change the default port (5000) in the file called Dockerfile.
Alternatives for publishing your ASP.NET 5 applications to different production server types are explained in the documentation. Microsoft has also produced a great tutorial that explains how to publish your ASP.NET 5 application to Microsoft Azure in a few steps.
A step forward: Implementing data access with Entity Framework 7
Note: If you typically work with Microsoft Visual Studio, you will certainly perform the steps described in this section in that IDE rather than in VS Code. However, here we demonstrate how many platforms and technologies from Microsoft can be used with cross-platform applications outside of Visual Studio.
Most applications, including web apps, need to work with data. You can find many tutorials about writing applications with VS Code, but very limited resources about implementing data access, so I want to guide you through this. As you might know, Entity Framework is the data access platform for modern applications from Microsoft, which has been recently open-sourced. Version 7 has some notable improvements, plus it works well with mobile and ASP.NET Core applications. You can easily implement data access in your ASP.NET Core application by using the dnx ef command, where ef stands for Entity Framework. Though the Command Palette allows invoking Entity Framework commands from within Code, a better approach is to use the command prompt. With Entity Framework, you can target many scenarios such as creating a data model based on an existing database, creating a data model and then scripting the database, or using the Code First approach to define a data model for both a new or existing database. For the current sample application, I will show you how to generate a data model based on the popular Northwind database and how to expose queries through a controller. Before you do anything else, in Visual Studio Code open the project.json file for the current project and, in the dependencies node, add a reference to the EntityFramework.MicrosoftSqlServer.Design library, with the same version number as the EntityFramework.MicrosoftSqlServer library. This is a fundamental step, otherwise scaffolding will fail immediately. When you save project.json, Visual Studio Code will detect the missing NuGet package and will offer to download it for you. Of course accept the offer, but if this does not happen, perform a dnu restore command manually. Now open a command prompt pointing to the C:\MyWebApps\CodeSuccinctlyWeb folder. When ready, type the following line:
> dnx ef
This will activate the Entity Framework command line for the current folder. In the console window, you will see a list of available commands, such as database, context, and migrations. You already have a database in this case, so the command you need to work with is context, which allows generating a DbContext class and will scaffold the data model. Depending on your database configuration, write the following command:
> dnx ef dbcontext scaffold "Server=.\sqlexpress;Database=Northwind;Trusted_Connection=True;" EntityFramework.MicrosoftSqlServer
Replace the server name with your instance of SQL Server if necessary. After a few seconds, you will see a completion message. If you take a look at the project in Visual Studio Code, you will see new files have been added to the project. More specifically, there is a class for each table in the database (e.g., Customers.cs, Orders.cs, Order_Details.cs), plus the context class defined inside the NorthwindContext.cs file. Suppose you want your web application to implement queries over data. The proper way to do this is with a Web API controller, which you can add using Yeoman. Because you have an existing and configured project, you can run Yeoman from the Command Palette. So, type yeoman aspnet. At this point, the Command Palette shows a list of items that can be added to an existing ASP.NET Core project. Select the WebApiController item and, when prompted, enter CustomersController as the controller name (see Figure 73).

Figure 73: Adding a new Web API Controller
The new controller is added to the Controllers folder and the Output window shows information about the code generation. If you look at the error list, you will see an error stating An anonymous type cannot have multiple properties with the same name. This is a known issue and you can fix it by navigating to the code where the error is and remove the duplicate properties. Web API controllers accept requests through the common HTTP verbs, such as GET, POST, PUT, and DELETE. For this reason, the new controller has auto-generated methods matching some of the most common HTTP verbs. Imagine you want to return a filtered list of customers. To do this, rewrite the Get method as shown in Code Listing 8.
Code Listing 8
NorthwindContext context=new NorthwindContext(); // GET: api/values [HttpGet] public IEnumerable<string> Get() { var query = from cust in context.Customers select cust.CompanyName;
return query; } |
Also, remember to add a using CodeSuccinctlyWeb directive. Before testing the application, you need a final edit. Open the Web.config file under the wwwroot folder and add the connection string declaration as follows:
<connectionStrings>
<add name="NorthwindContext"
connectionString="Data Source=.\SqlExpress;Initial Catalog=Northwind;Integrated Security=True"
providerName="System.Data.SqlClient" />
</connectionStrings>
In real-world scenarios, you might want to supply the connection string in your C# code instead of placing it in the configuration file, but it is not necessary in this case. Now run the application again with commands you learned previously and open a web browser to the http://localhost:5000 web address. By following the routing conventions of Web API, you can get the list of customers by typing the following address: http://localhost:5000/api/Customers. The result you get is shown in Figure 74.

Figure 74: Querying Data Exposed by a Web API Controller
With a few steps, you have been able to implement data access in your ASP.NET Core application using Entity Framework. Additional steps might involve adding code migrations, CRUD operations, and proper views to present information with a user interface.
Debugging in Visual Studio Code
One of the most important tools in Visual Studio Code is the built-in debugger, which is another key feature that marks a significant difference compared to other code editing tools. At the time of this writing, Code has integrated support for Node.js (JavaScript) applications and experimental support for Mono with C# and F# via a special extension. Additional debuggers produced by the developer community can be found in the Visual Studio Marketplace.
To try out the debugging, the first thing you need is a Node.js application. If you do not have one, you can use the Express application framework, which makes it easy to scaffold a new Node.js app. Express works similarly to Yeoman, so it creates an application in a subfolder of the current directory. Open a command prompt pointing to a directory where you want to place your new application’s folder, such as the sample C:\MyWebApps directory created previously. When ready, write the following command in the command prompt to create a sample application called SampleNodeJsApp:
> express SampleNodeJsApp
After a few seconds, the application will be ready. Notice that at completion, Express suggests you install the application dependencies (see Figure 75), so navigate to the subfolder and type npm install.
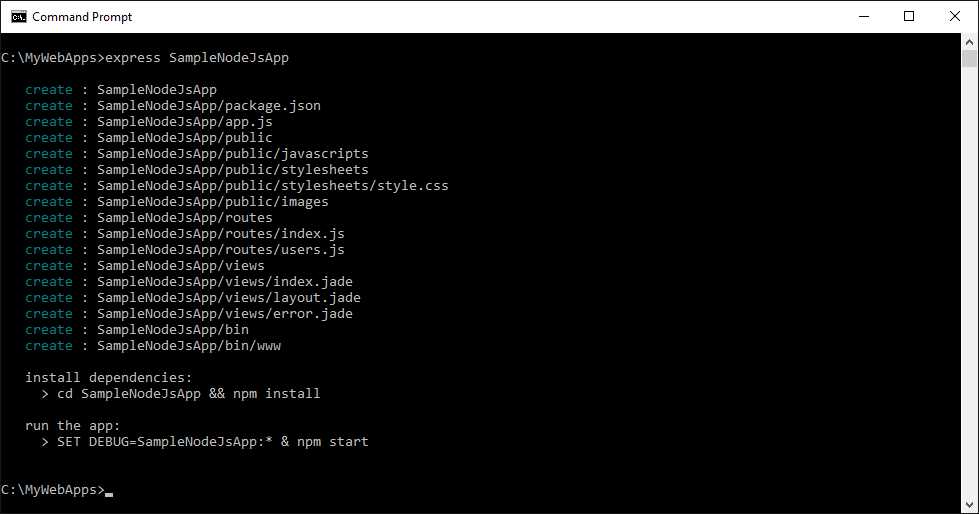
Figure 75: Creating a Node.js Application with Express
Testing the application is very easy, as you simply need to type npm start. By default, this will start the server listening to port 3000, so in your web browser you can reach the application at http://localhost:3000. Figure 76 shows the sample application running.

Figure 76: The Node.js application created with Express is running.
Behind the scenes, the project contains a package.json file which defines a script called start that runs node ./bin/www. This provides the startup mechanism.
Opening the Node.js application in Visual Studio Code
Start Visual Studio Code and open the SampleNodeJsApp folder. As expected, Code recognizes the application type, loads files, and provides the proper view. Open the app.js file and after the var app = express(); line of code, add the following:
var welcomeText='Welcome to Node.js';
console.log(welcomeText);
This is a simple string variable declaration that will be useful for debugging purposes. Notice how powerful the IntelliSense is while you type.
Configuring the debugger
Before you can debug the application, you need to configure the debugger. First, open the Debug view. Second, click the gear icon that represents the Open launch.json command. VS Code will show a list of available debugging environments, depending on how many debuggers you have installed. Simply select Node.js and press Enter. At this point, Code creates a file called launch.json, which is where you configure the debugger. Visual Studio Code supports two debugging configurations: launch and attach. You use launch to debug the project that is currently opened in Code whereas you use attach to debug an already running application. When Code generates launch.json, it automatically provides default values for both configurations, as shown in Code Listing 9.
Code Listing 9
{ "version": "0.2.0", "configurations": [ { "name": "Launch", "type": "node", "request": "launch", "program": "${workspaceRoot}\\bin\\www", "stopOnEntry": false, "args": [], "cwd": "${workspaceRoot}", "preLaunchTask": null, "runtimeExecutable": null, "runtimeArgs": [ "--nolazy" ], "env": { "NODE_ENV": "development" }, "externalConsole": false, "sourceMaps": false, "outDir": null }, { "name": "Attach", "type": "node", "request": "attach", "port": 5858, "address": "localhost", "restart": false, "sourceMaps": false, "outDir": null, "localRoot": "${workspaceRoot}", "remoteRoot": null } ] } |
In most cases you will leave the default values unchanged, but you might need to tweak values for the attach configuration. The properties are self-explanatory and easy to understand, but you can always have a look at the official documentation for further details. Make sure you have saved launch.json before going on.
Managing breakpoints
Before starting the application in debugging mode, it is useful to place one or more breakpoints to discover the full debugging capabilities in VS Code. In order to place breakpoints, you click the white space near the line number. For instance, place a breakpoint on the welcomeText variable declaration you wrote previously, as shown in Figure 77.

Figure 77: Placing Breakpoints in the Code Editor
You can remove a breakpoint by simply clicking it again, or you can manage breakpoints in the Breakpoints area of the Debug view (see Figure 78).

Figure 78: Managing Breakpoints
Debugging the application
In the Debug view, make sure the launch configuration is selected, then click the Start button or press F5. Visual Studio Code will launch the debugger and will break when it encounters an exception or a breakpoint, like in the current example. Figure 79 shows Code hitting a breakpoint and all the debugging instrumentation.

Figure 79: The debugger encounters a breakpoint and shows all the instrumentation.
Notice how the status bar turns orange while debugging and how the Output window shows information about the debugging process. On the left side, the Debug view shows a number of tools:
- Variables, which shows the list of variables that are currently under the debugger's control and that you can investigate by expanding each variable.
- Watch, where you can evaluate expressions.
- Call Stack, where you can see the stack of method calls. If you click a method call, the code editor will bring you to the code that is making that call.
- Breakpoints, where you can manage breakpoints.
At the top of the IDE, also notice the debugging toolbar (see Figure 80) called Debug actions pane, which holds the following commands from left to right:
- Continue (F5), which allows continuing the application execution after breaking on a breakpoint or an exception.
- Step Over (F10), which executes one statement at a time except for method calls, which are invoked without stepping into them.
- Step Into (F11), which executes one statement at a time, including statements within method bodies.
- Step Out (F12), which executes the remaining lines of a function starting from the current breakpoint.
- Restart (Ctrl+Shift+F5), which restarts the application execution.
- Stop (Shift+F5), which stops debugging.
![]()
Figure 80: The Debug Actions Pane
If you hover over a variable name in the code editor, a convenient pop-up makes it easy to investigate values and property values depending on the type of the variable. Figure 81 shows a pop-up showing information about the app variable. You can expand properties and see their values, and you can also investigate properties in the Variable area of the Debug side bar.

Figure 81: Analyzing and Investigating Property Values at Debugging Time
As another example, simply hover the welcomeText variable declared manually to see how a tooltip shows its current value (see Figure 82). In this case the value has been hardcoded, but if it was supplied programmatically, then this feature would make it really easy to understand if the actual value was the expected one.

Figure 82: Analyzing a Local Variable
The debugger also offers the Call Stack feature, which allows stepping through the method calls stack. When you click a method call in the stack, the code editor will open the file containing the call, highlighting it as shown in Figure 83.

Figure 83: Analyzing Method Calls with Call Stack
Finally, you have an option to use the Watch tool to evaluate expressions. While debugging, right-click an object and then select Debug: Add to Watch (see Figure 84).

Figure 84: Using the Watch Debugging Tool
Another useful tool is the Debug console. You can open this by clicking the Open Debug console button to the right of the gear icon in the Debug view. When you open this tool, you can write expressions to be evaluated immediately. For instance, Figure 85 shows how to evaluate the welcomeText variable by typing its name. Code will show the variable's current value.

Figure 85: The Debug Console
It is worth mentioning that the Debug console also allows sending commands to the debugger, which is done by attaching the debugger to an already running application.
Hints about debugging Mono-based applications
Visual Studio Code has experimental support for debugging Mono-based C# and F# applications. At the time of this writing, this is only available for Linux and OS X, not Windows. Mono 3.1.2 or higher must be installed to use it. Also, you need to download the Mono debugger for Visual Studio Code from the Command Palette by typing the install extension command, and then selecting the Mono Debug extension. Once you have installed these prerequisites, you must invoke the compiler with the following line to enable an application for debugging:
> mcs -debug Program.cs
Or you can type the following command to debug an already running application:
> mono --debug --debugger-agent=transport=dt_socket,server=y,address=127.0.0.1:55555 Program.exe
Additional information about Mono debugging as well as news about feature updates can be found in the official documentation.
Chapter summary
The power of Visual Studio Code as a development environment is apparent when it comes to writing real applications. With the help of specific generators, you can easily write ASP.NET 5 web applications using C# and the .NET Execution Environment (DNX). This chapter also described how easy it is to implement Entity Framework data access with a few commands. If you develop Node.js applications instead, you can also leverage a powerful, built-in debugger that offers all the necessary tools you need to write great apps, such as breakpoints, variable investigation, call stack, and expression evaluators. By completing this chapter, you have experienced the most important and powerful features you need to write great cross-platform applications. Now it is time to discuss how to customize Visual Studio Code.
- 1800+ high-performance UI components.
- Includes popular controls such as Grid, Chart, Scheduler, and more.
- 24x5 unlimited support by developers.