
Visual Studio Code Succinctly®

CHAPTER 1
Code Editing Evolved for Windows, Linux, and OS X
Visual Studio Code is not just another evolved Notepad with syntax colorization and automatic indentation. Instead, it is a very powerful code-focused development environment expressly designed to make it easier to write web, mobile, and cloud applications using languages that are available to different development platforms, and by supporting the application development life cycle with a built-in debugger for Node.js and integrated support for the popular Git version control engine. With Code, you can work with individual code files or structured file systems based on folders. This chapter provides full guidance about the powerful editing features available and explains how Visual Studio Code manages code files in its workspace.
Tip: In this book I will use the Visual Studio Code, VS Code, and Code names interchangeably.
Why Visual Studio Code
Before you learn how to use Visual Studio Code, what features it offers and how it provides an improved code editing experience, it is very helpful to understand its purpose. Visual Studio Code is not a simple code editor; it is a powerful environment that puts writing code at its center. The main purpose of Visual Studio Code is not building binaries (such as .exe and .dll files); it’s making it easier to write code for web, mobile, and cloud platforms for any developers working on different operating systems, such as Windows, Linux, and OS X, keeping you independent from proprietary development environments. For a better understanding, I’ll go through an example: Think of ASP.NET Core 1.0, the new cross-platform, open-source technology able to run on Windows, Linux, and OS X that Microsoft produced to create portable web applications. Forcing you to build cross-platform, portable web apps with Microsoft Visual Studio 2015 would make you dependent on this IDE. You could argue that Visual Studio 2015 Community edition is free of charge, but it only runs on Windows, so what about Linux or Mac users? On the other hand, though it is certainly not intended to be a replacement for more powerful and complete environments such as its major brother, Visual Studio Code can run on a variety of operating systems and can manage different project types, as well as the most popular languages. To accomplish this, Visual Studio Code provides the following core features:
- Built-in support for coding with many languages, including those you typically use in cross-platform development scenarios, with advanced editing features and support for additional languages via extensibility.
- Built-in debugger for Node.js, with support for additional debuggers (such as Mono) via extensibility.
- Version control based on the popular Git engine, which provides an integrated experience for collaboration that supports code commits and branches, and is the proper choice for a tool intended to work with possibly any language.
In order to properly combine all these features into one tool, Visual Studio Code provides a coding environment that is different from other developer tools, such as Microsoft Visual Studio. In fact, Visual Studio Code is a folder-based environment that makes it easy to work with code files that are not organized within projects, and offers a unified way to work with different languages. Starting from this assumption, Code offers an advanced editing experience with features that are common to any supported languages, plus some features that are available to specific languages. As you will learn throughout the book, Code also makes it easy to extend its built-in features by supplying custom languages, syntax coloring, editing tools, debuggers, and much more via a number of extensibility points. Now that you have a clearer idea of Code’s goals, you are ready to learn the amazing editing features that put it on top of any other code editor.
When should I use Visual Studio Code?
As the product name implies, Visual Studio Code is a code-centric tool, with a primary focus on web, cross-platform code. That said, it does not provide all the features you need for full, more complex application development and application life-cycle management and is not intended to be the proper choice with some development platforms. If you have to make a choice, consider the following points:
- Visual Studio Code does not invoke compilers, so it does not produce binaries such as .exe or .dll files. You can certainly implement task automation, which will be discussed in Chapter 3, but this is different than having the compilation process integrated.
- Visual Studio Code has no designers, so creating an application’s user interface can only be done by writing all of the related code manually. As you can imagine, this is fine with some languages and scenarios but it can be very complicated with certain applications and development platforms, especially if you are used to working with the powerful graphical tools available in Microsoft Visual Studio.
- The built-in debugger is specific to web, cross-platform languages and it currently targets only Node.js. Plus, it is not as advanced as the Visual Studio debugger.
- Visual Studio Code is a general purpose tool and is not the proper choice for specific development scenarios such as building Windows desktop applications.
If your requirements are different, consider instead Microsoft Visual Studio 2015, which is the premier development environment for building, testing, deploying, and maintaining any kind of application. The Visual Studio 2015 Community edition is free and provides a full development environment for any development platform.
Language support
Visual Studio Code has built-in support for many languages out of the box. Table 1 groups supported languages by editing features.
Table 1: Language Support
Available Languages Grouped by Editing Features | |
|---|---|
Batch, C++, Clojure, CoffeeScript, Dockerfile, F#, Go, Jade, Java, Handlebars, Ini, Lua, Makefile, Objective-C, Perl, PowerShell, Python, R, Razor, Ruby, Rust, SQL, Visual Basic, XML | Common features (syntax coloring, bracket matching) |
Groovy, Markdown, PHP, Swift | Common features and code snippets |
CSS, HTML, JSON, Less, Sass | Common features, code snippets, IntelliSense, outline |
JavaScript | Common features, code snippets, IntelliSense, outline, parameter hints. The JavaScript language service is based on Salsa. |
TypeScript, C# | Common features, code snippets, IntelliSense, outline, parameter hints, refactoring, find all references. C# is powered by Roslyn and OmniSharp and is optimized for cross-platform .NET development with DNX. |
Starting from version 0.10.10, C# is no longer available out of the box; instead it is available as an extension. The reason why I included C# in Table 1 is for consistency with previous versions and because many of you might already have experienced C# editing features in the past. In order to have C# installed, follow these steps:
- Open a C# code file (.cs) in Visual Studio Code.
- When asked, accept the option to install the C# extension.
- Restart Visual Studio Code when the installation is complete.
Visual Studio Code can be extended for additional languages with tools produced by the developer community. These extensions can be downloaded from the Visual Studio Code Marketplace. This is discussed in more detail in Chapter 5, "Customizing and Extending Visual Studio Code." In the meantime, you can have a look at the available languages.
Note: This book describes all the available features in Visual Studio Code based on common development and coding scenarios. However, Visual Studio Code also has support for very specific scenarios with C#, JSON, HTML, Markdown, TypeScript, and DockerFile, so do not miss the Languages page in the documentation.
Editing features
Visual Studio Code provides many of the features you would expect from a powerful code editor. This section describes what editing features make your coding experience amazing with this new tool. If you are familiar with Microsoft Visual Studio 2013 and higher, you will also see how some features have been inherited from this IDE. It is worth mentioning that Visual Studio Code provides keyboard shortcuts for almost all of the editing features, enabling you to edit code faster. For this reason, I will also mention the keyboard shortcuts for every feature I describe. With regard to this, remember that the counterpart for the Windows’ Ctrl key in Mac is Cmd.
Syntax coloring
Visual Studio Code provides the proper syntax coloring for the language your code files are written with. Figure 1 shows an example based on a C# code file.
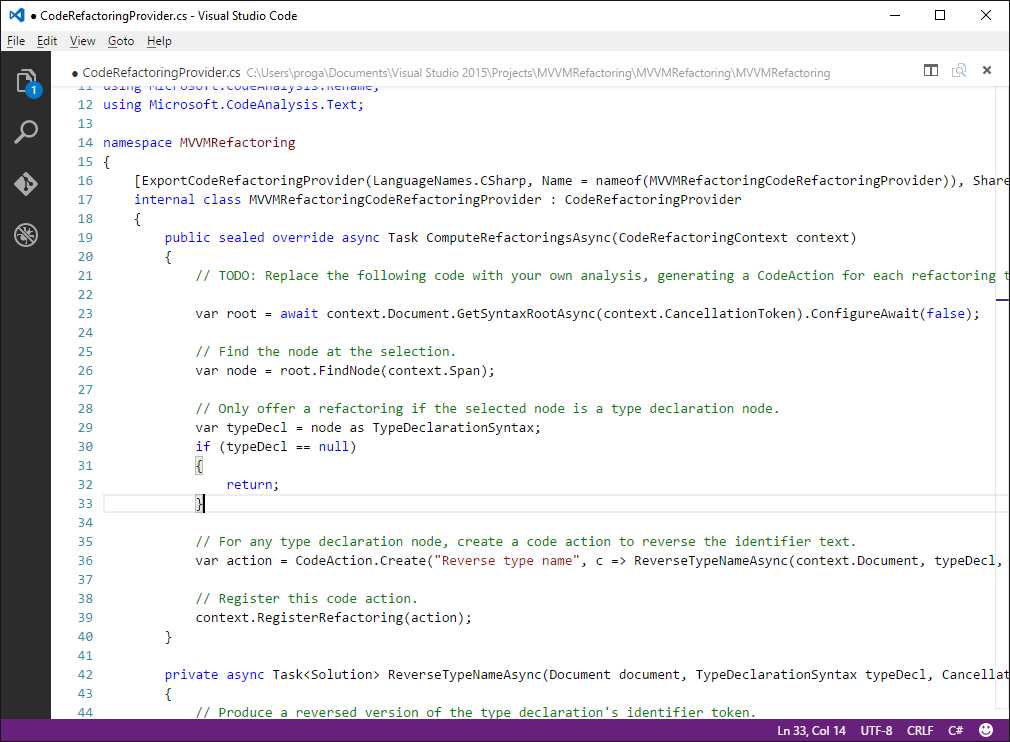
Figure 1: Syntax Highlighting
Syntax coloring is arguably the most important feature when editing a code file, and this is available to all supported languages. You can also define your own highlighting rules when adding custom languages (see Chapter 5).
Bracket matching
The code editor can highlight matching brackets, as shown in Figure 2.

Figure 2: Matching brackets are highlighted.
This feature is extremely useful for identifying the beginning and end of long code blocks and is triggered once the cursor is near one of the brackets.
IntelliSense
IntelliSense is a feature that offers rich, advanced word completion via a convenient pop-up that appears as you type. In developer tools from Microsoft such as Visual Studio, IntelliSense has always been one of the most popular features because it is not simply word completion. In fact, IntelliSense provides suggestions as you type, showing the documentation about a member if available, and displaying an icon near each suggestion that describes what kind of syntax element a word represents. Figure 3 shows IntelliSense in action.
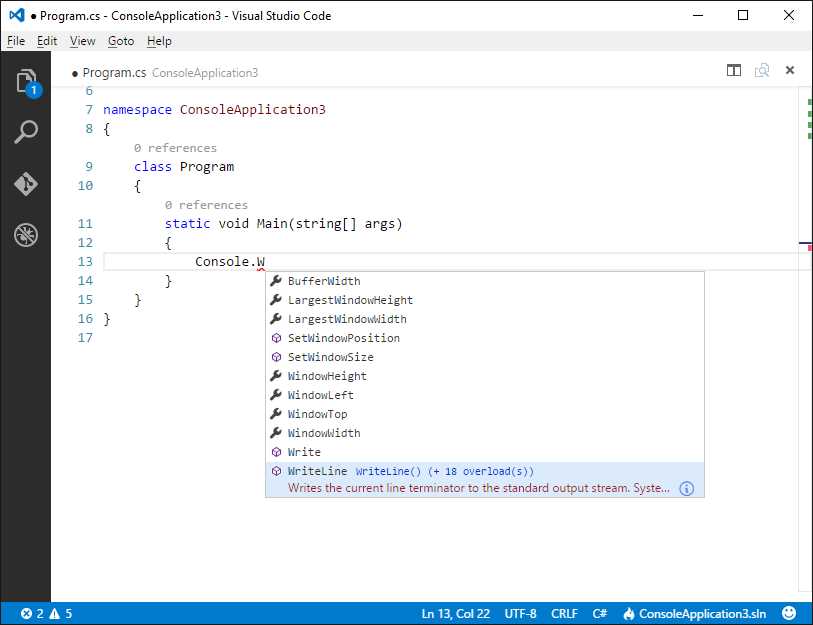
Figure 3: IntelliSense shows suggestions as you type and provides rich word completion.
As you can see in Figure 3, IntelliSense shows a list of available members for the given type--in this case Console--as you write. When you select a word from the completion list, Code shows the summary for the member documentation. Also, if you click the i symbol (which stands for Information), you can see the full member documentation (see Figure 4).
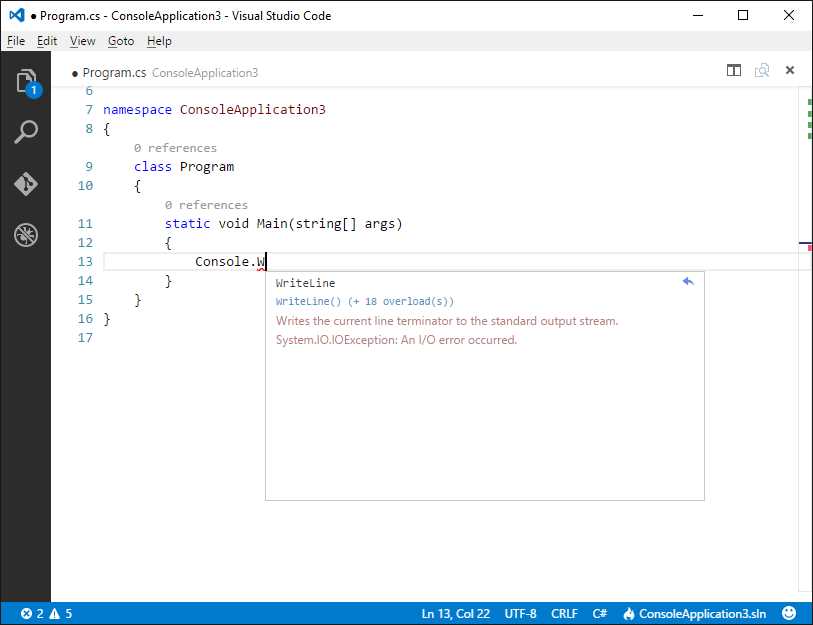
Figure 4: Getting a member’s full documentation.
To quickly complete the word insertion, use either Tab or Enter. Not limited to this, IntelliSense in Visual Studio Code also supports suggestion filtering: Based on the CamelCase convention, you can type the uppercase letters of a member name to filter the suggestion list. For instance, if you are working against the System.Console type and you write cv, the suggestion list will show the CursorVisible property, as demonstrated in Figure 5.

Figure 5: Filtering Suggestions
Out of the box, IntelliSense is available to the following languages: CSS, HTML, JavaScript, JSON, Less, Sass, TypeScript, and C#.
Parameter hints
When you code a function invocation, IntelliSense also shows a tooltip that describes each parameter if the documentation has been supplied (such as XML comments in C#). This feature is called parameter hints and you can see it in action in Figure 6.
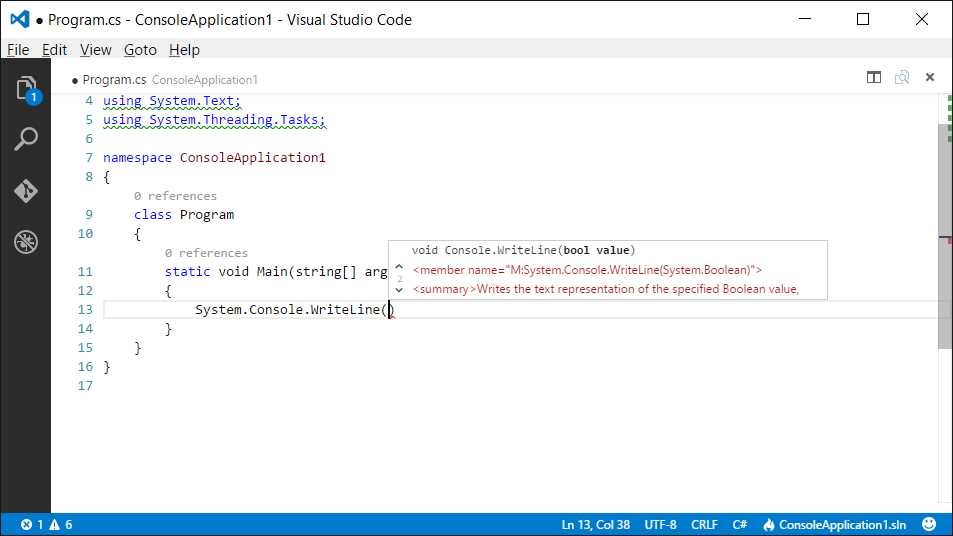
Figure 6: Visualizing Parameter Hints
Code block folding
The code editor allows folding delimited code blocks. Just hover the pointer over line numbers and the - symbol will appear near the start of a code block. Just click it to fold the code block. You will see the + symbol at this point, which you can then click to unfold the code block.
Go To Definition
With supported languages, Visual Studio Code provides an interesting feature called Goto Definition. You can hover over a symbol with the pointer and the symbol will appear as a hyperlink. Also, a tooltip will show the code that declares that symbol (see Figure 7).
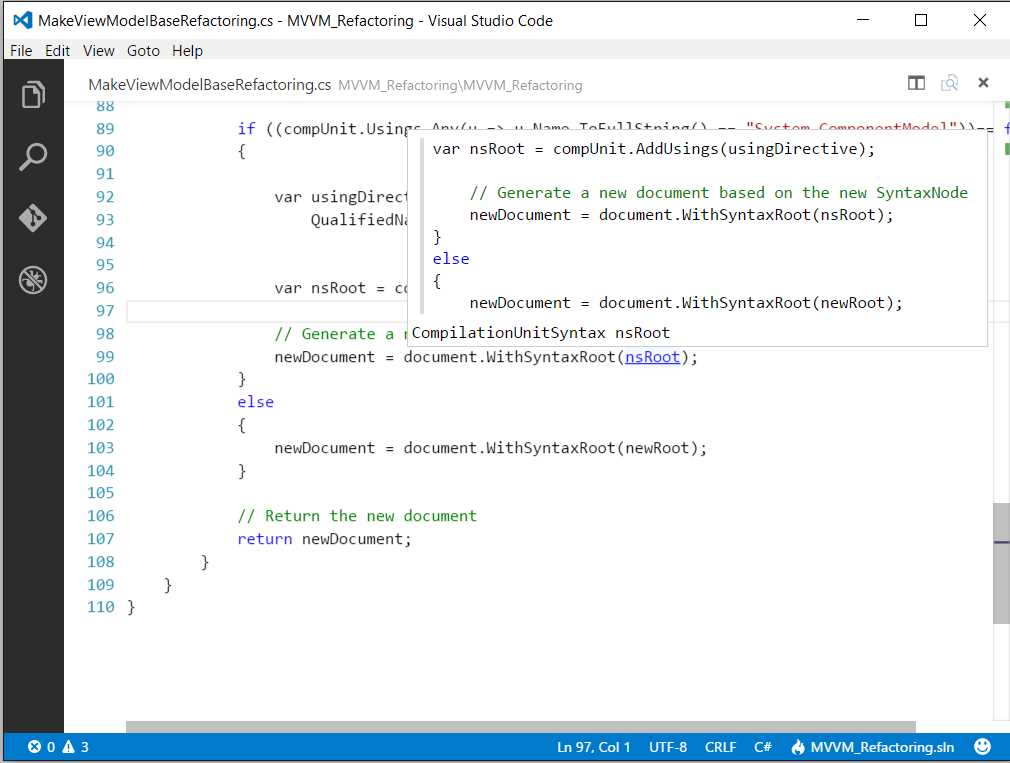
Figure 7: Using Go To Definition to discover a symbol’s definition in code.
Also, you can hold Ctrl and click on the symbol and Code will open the definition directly in the file that contains the related code.
Tip: Alternatively, you can press F12 or right-click and select Go To Definition.
Tooltips
You can hover over types, variables, and type members, and Visual Studio Code will show a tooltip that contains the documentation for the selected object. This feature is available only if the documentation has been provided, such as XML comments for C#. Figure 8 shows an example where you can see a descriptive tooltip of a type called Document.
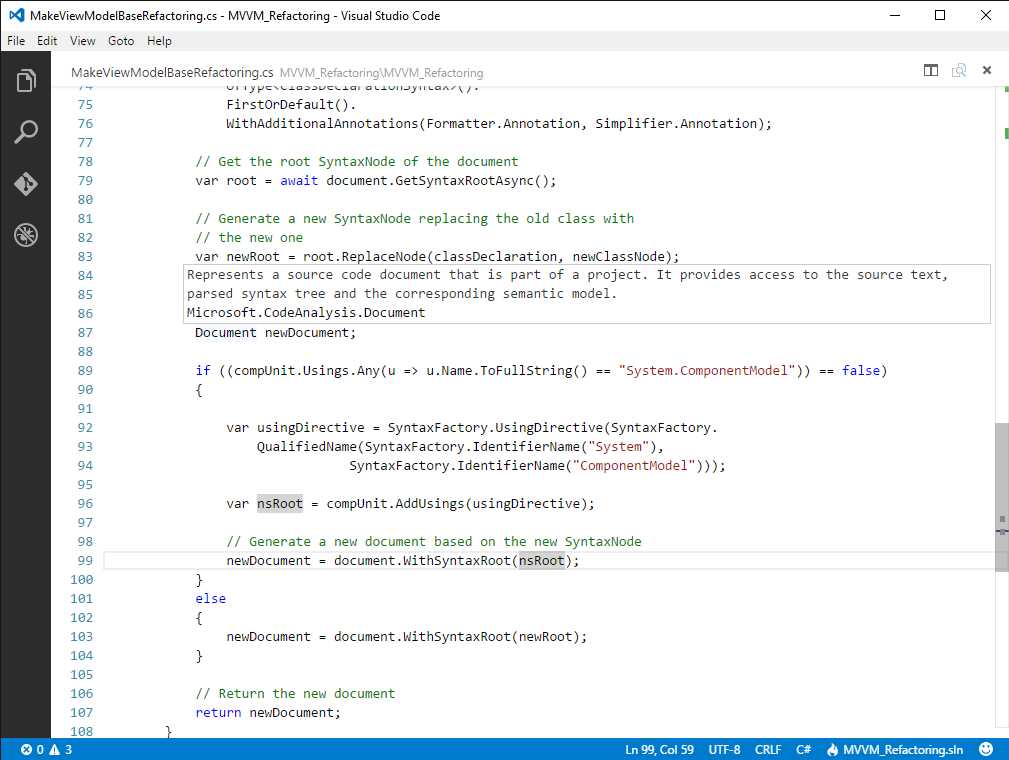
Figure 8: Getting type and member documentation with tooltips.
If you instead hover over a variable name, the tooltip will show the type for the variable.
Find All References
Find All References is a very useful feature that makes it easy to see how many times and where a member has been used across the code. For each member, the code editor shows the number of references found. If you click this number, the code editor displays a pop-up containing the code where the first occurrence is found, while the right side the pop-up shows the list of occurrences, as shown in Figure 8.

Figure 9: See where and how many times members have been used with Find All References
Just click on each occurrence in the list to see the code that has a reference to it. It is very important to note that this pop-up is interactive, which means that you can edit the code directly without having to open the containing code file separately. This allows you to keep your focus on the code, saving time. Also notice that the interactive pop-up shows the file name that contains the selected reference at the top.
Tip: You can also enable Find All References by pressing Shift+F12 or by right-clicking and then selecting Find All References.
Rename Symbol
Renaming a symbol is a common editing task, so Visual Studio Code offers a convenient way to accomplish this. If you press F2 over the symbol you wish to rename, or right-click and then select the Rename command, a small interactive pop-up appears (see Figure 10). There you can write the new name without any dialogs, keeping your focus on the code.

Figure 10: Renaming a Symbol In-Line
Additionally, you can rename all the occurrences of an identifier. Just right-click the identifier and then select Change All Occurrences (or press Ctrl+F2); all the occurrences will be highlighted and updated with the new name as you type (see Figure 11).
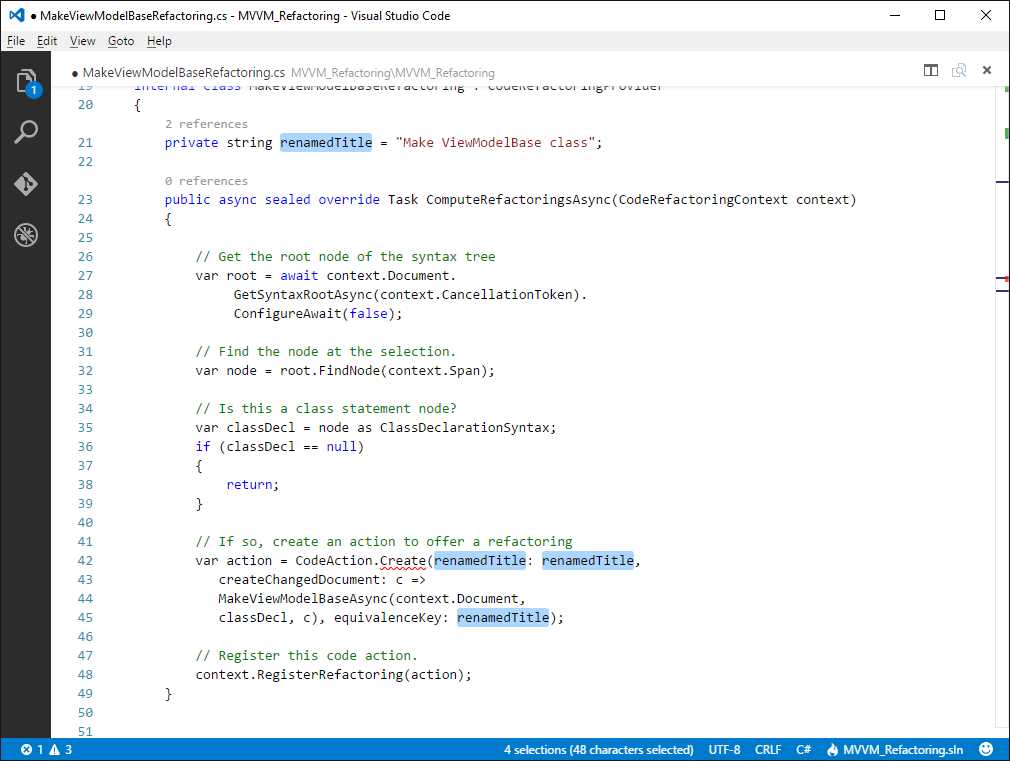
Figure 11: Changing All Occurrences of an Identifier
Peek Definition
Suppose you have dozens of code files and you want to see or edit the definition of a type you are currently using. With other editors, you would search among the code files, which not only can be annoying but would also move your focus away from the original code. Visual Studio Code brilliantly solves this problem with a feature called Peek Definition. You can simply right-click a type name and then select Peek Definition (the keyboard shortcut is Alt+F12). An interactive pop-up window appears showing the code that defines the type, giving you not only an option to look at the code, but also the option to directly edit it. Figure 12 shows the peek window in action.

Figure 12: Investigating a Type Definition with Peek Definition
As you can see, the peek window is very similar to the Find All Reference feature and it still shows the file name that defines the type at its top. Double-click the file name to open the code file in a separate editor.
Fast Selection
You can press Ctrl+D to select a word or identifier at the right of the cursor.
Multi-Cursors
Visual Studio Code’s editor supports multi-cursors. Each cursor operates independently and you can add secondary cursors by holding Alt and clicking at the desired position. You will see that secondary cursors are rendered thinner. The most typical situation in which you want to use multi-cursors is when you want to add (or replace) the same text in different positions of a code file. Figure 13 shows an example.
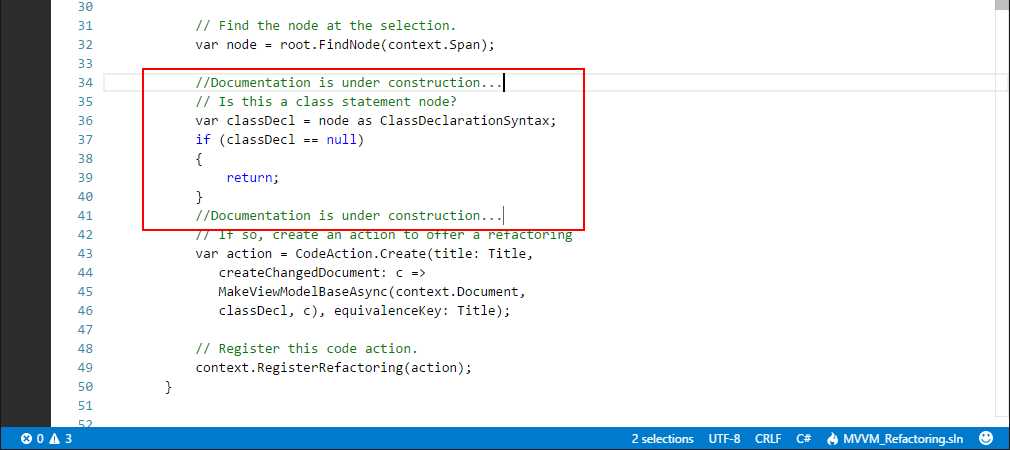
Figure 13: Multi-cursors can be used to add the same text in multiple positions.
The Change All Occurrences feature you saw before automatically uses multi-cursors too.
Goto Symbol
Another interesting and powerful feature is Goto Symbol. By pressing Ctrl+Shift+O, you will be able to browse symbols in the current code file. Also, if you type : in the search box, symbols will be grouped by category. Figure 14 shows how to browse symbols grouped by category.

Figure 14: Browsing Symbols
Use the up and down arrow keys to highlight the corresponding symbol definition in the code file. In addition, the symbol list is automatically filtered based on what you type in the search box.
Open Symbol By Name
The C# and TypeScript languages support opening a symbol by name, regardless of the code file that contains the symbol. Simply press Ctrl+T and start typing the symbol name at the # prompt, as shown in Figure 15.

Figure 15: Browsing Symbols by Name
If you click the name of a symbol that is defined inside a different code file, this will be opened inside a new editor window.
Shrinking and Expanding Text Selection
You can easily expand text selection by pressing Shift+Alt+Right Arrow, and shrink text selection by pressing Shift+Alt+Left Arrow within enclosing delimiters of a code block.
Code Issues and Refactoring
With C# and TypeScript, Visual Studio Code can detect code issues as you type, suggesting fixes and offering code refactorings. This is one of the most powerful features in this tool, which is something that you will not find in most other code editors.
Note: This feature is fully available to C# and TypeScript however there is some basic support for JavaScript and CSS. This section describes the full functionality based on some C# code.
According to the severity of a code issue, Visual Studio Code underlines the pieces of code that need your attention with squiggles. Green squiggles mean a warning; red squiggles mean an error that must be fixed. If you hover over the line or symbol with squiggles, you will get a tooltip that describes the issue. Figure 16 shows two code issues, one with green squiggles for an unnecessary using directive, and one with red squiggles for a symbol that does not exist. The figure also shows the tooltip for the code issue with the higher severity level.
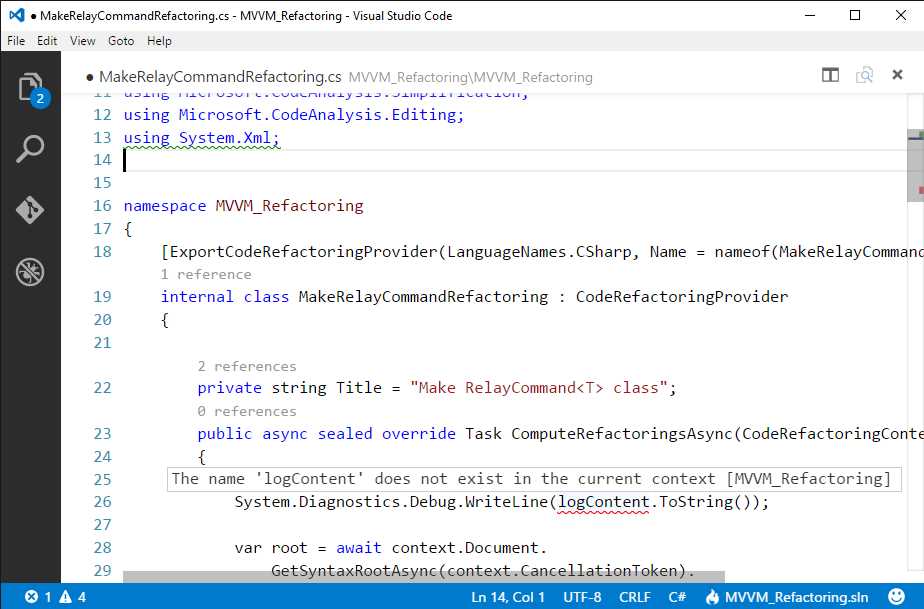
Figure 16: Visual Studio Code detects issues as you type.
Of course, Visual Studio Code also provides an integrated, easy way to fix code issues via the so-called Light Bulb shown in Figure 17 under the unnecessary using directive.
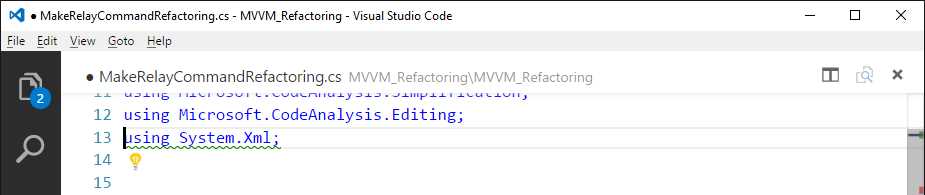
Figure 17: The Light Bulb provides a shortcut for resolving code issues.
When you click the Light Bulb, Visual Studio Code shows possible code fixes for the current context. In this case, it allows you to remove unnecessary directives and to sort directives, as shown in Figure 18.
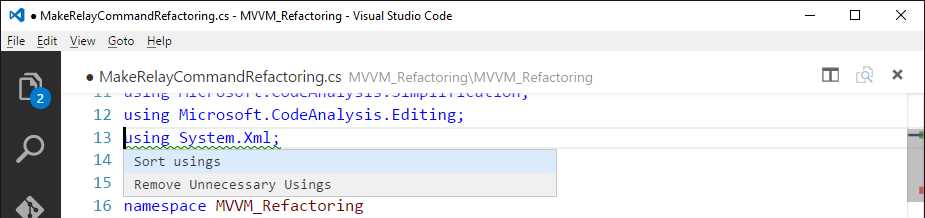
Figure 18: Fixing code issues with the Light Bulb.
Just click the desired fix and it will be applied to the code issue. Actually, this tool is much more powerful. Consider the symbol called logContent that does not exist in the code file and is underlined as a code issue as expected (see Figure 16). If you click this symbol and then open the Light Bulb, the code editor will show a list of possible proper fixes for the current context, such as creating a field, creating a property, creating a local variable, and more, as shown in Figure 19.
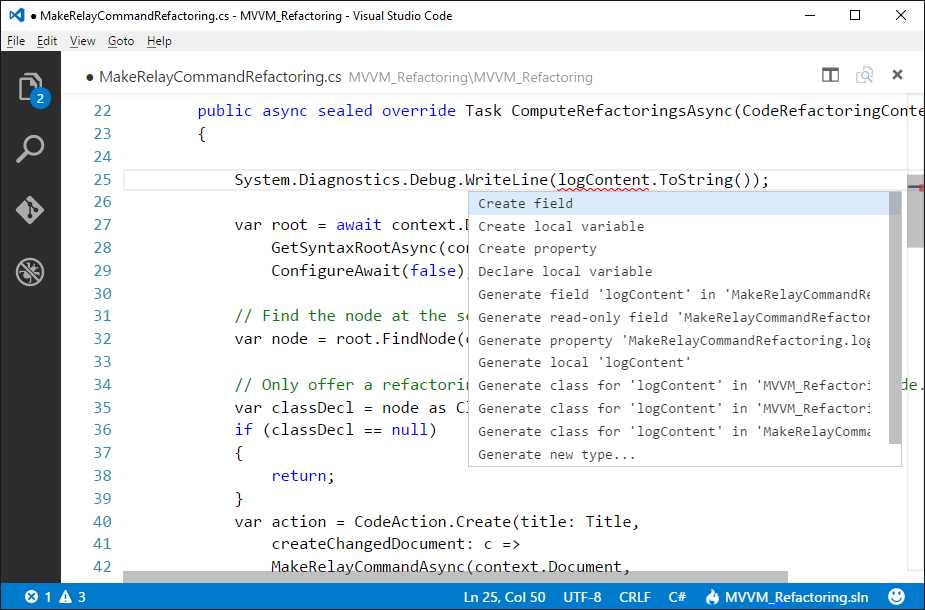
Figure 19: The Light Bulb provides proper code fixes based on the context.
For instance, if you select the Create property option, Visual Studio Code generates a property stub for you, as shown in Figure 20.

Figure 20: The property has been generated as expected.
There’s much more power than this. Consider Figure 21, where you see a class that needs to implement the IDisposable interface. As you can see, there is a code issue because the code editor cannot find the definition for this interface, so it provides possible fixes.

Figure 21: Getting Possible Fixes for a Missing Interface Implementation
We know this interface is from the System namespace, so the proper fix here is the using System; option. When selected, Visual Studio Code adds a using System; directive to the code file. However, this is not enough to solve the code issue because the class actually lacks the interface implementation. If you click the Light Bulb again, you will see how the code editor offers to implement the interface for you based on four different choices, as demonstrated in Figure 22.
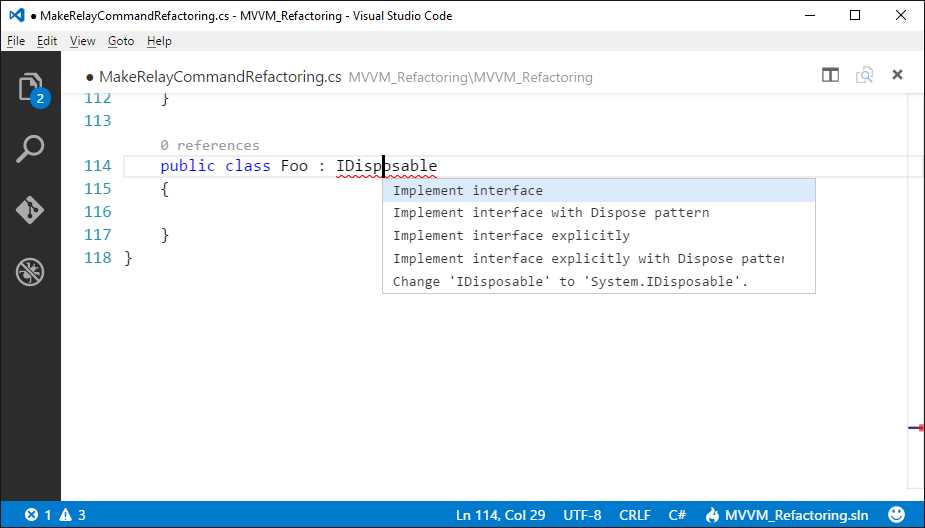
Figure 22: Contextualized Suggestions for the Interface Implementation
If you select the Implement interface with Dispose pattern, you will see how Visual Studio Code supplies all the plumbing code for a correct interface implementation, as shown in Figure 23.
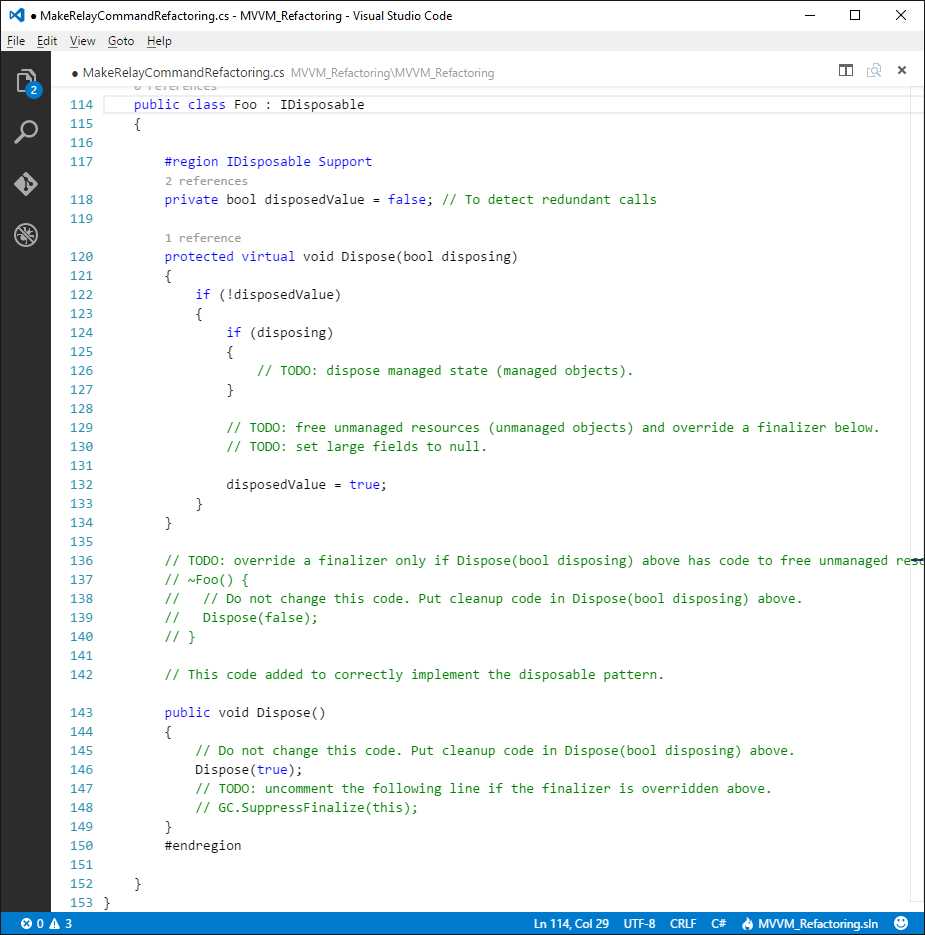
Figure 23: Visual Studio Code applies the code fix, adding all the plumbing code.
If you chose one of the other code fixes, you would get a similar result but with different implementation. Though it is not possible to show examples for all the code fixes that Code can apply, what you have to keep in mind is that suggestions and code fixes are based on the context for the code issue, which is a very powerful feature that makes Visual Studio Code a unique editor. Once you know how to work with the Light Bulb, you will see on your own possible fixes depending on the code issues you encounter. Visual Studio Code also provides an alternative way to see all the code issues it finds. Select View > Errors and Warnings (Ctrl+Shift+M) or click the Errors and Warnings symbols at the lower left corner. This opens a list of code issues (see Figure 24) that you can also filter by typing into the search box. Then you can simply click a code issue and move to it immediately.
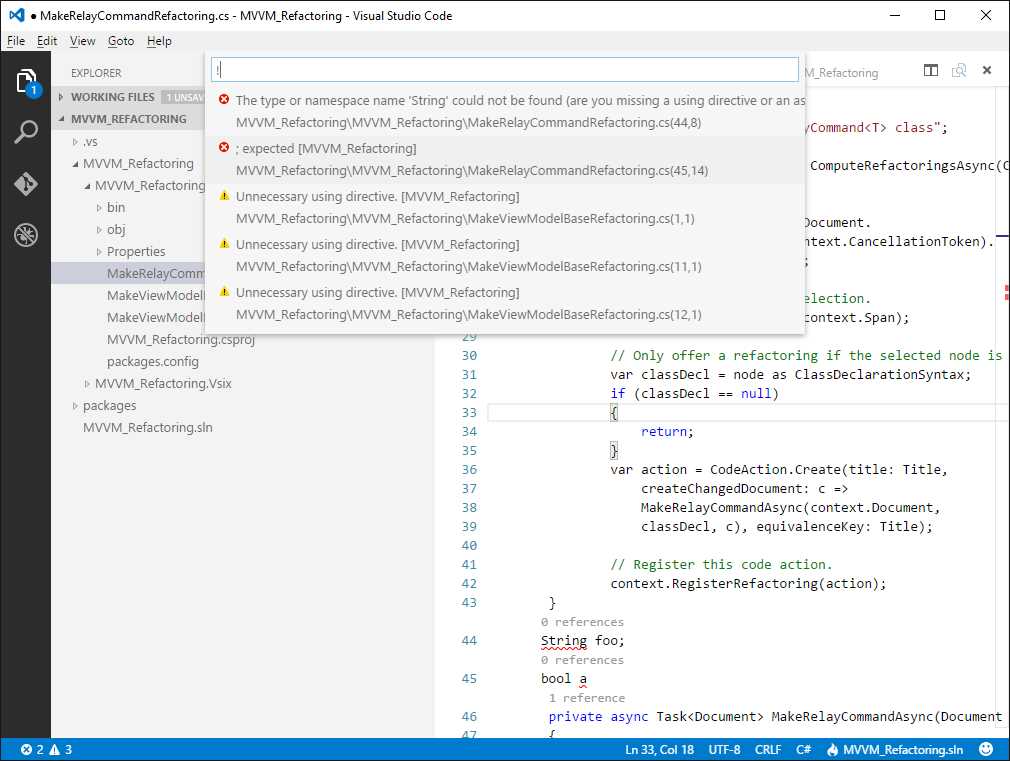
Figure 24: Showing the List of Code Issues
Note: Behind the scenes, this feature is based on the .NET Compiler Platform, also known as Roslyn. Roslyn provides open source C# and Visual Basic compilers with rich code analysis APIs. Visual Studio Code does not work with compilers like Visual Studio does, but it calls a special language service that performs code analysis as you type. Visual Studio 2015 heavily uses the Roslyn APIs to empower the code editor with even more advanced features, such as live preview. If you want to discover more about Roslyn with .NET, consider reading Roslyn Succinctly.
Preview for Markdown
Markdown is a popular markup language used to write documents for the web. If you have ever worked on open source projects hosted on the popular GitHub platform, you've probably written some Markdown documents. Visual Studio Code has integrated support for editing Markdown files (.md), as well as live previews. Figure 25 shows the editing of a Markdown document.
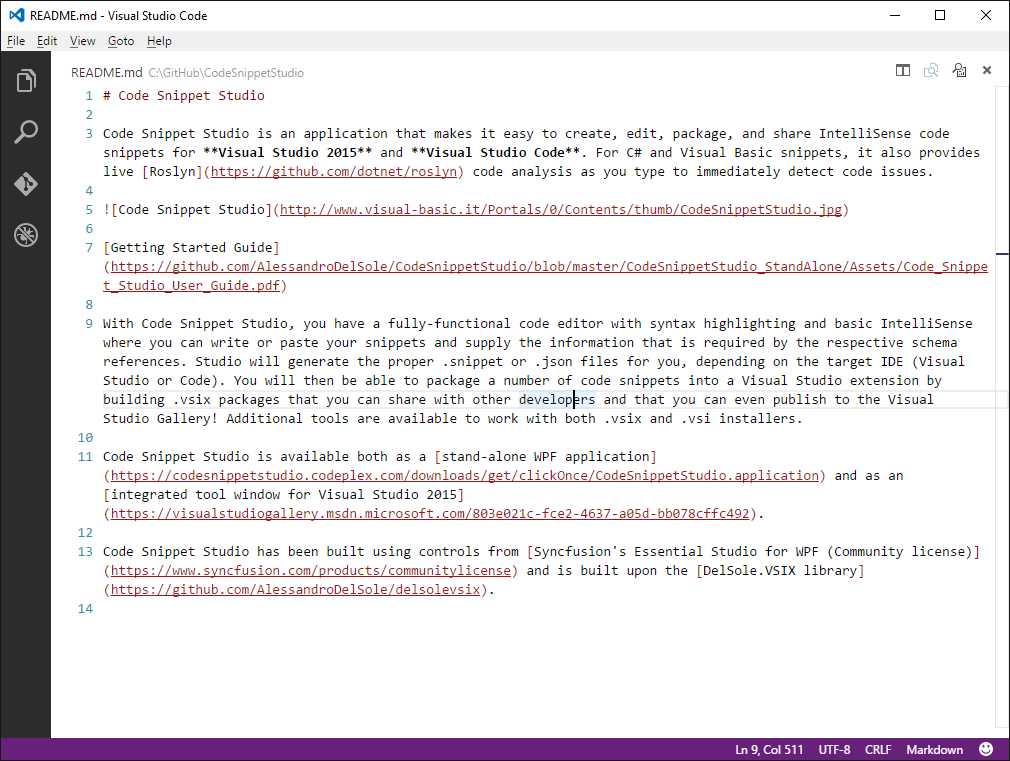
Figure 25: Writing a Markdown document.
If you press Ctrl+Shift+V, Visual Studio Code shows a live preview of how the document will be rendered, as shown in Figure 26.

Figure 26: Markdown Live Preview
This is a very useful feature that gives you an immediate view of what the document will look like.
Code snippets
Visual Studio Code ships with a number of built-in code snippets that you can easily add by using the Emmet abbreviation syntax and pressing Tab. Table 1 lists what languages support code snippets natively. For instance, in C# you can easily add a property definition by using the prop code snippet, as shown in Figure 27.
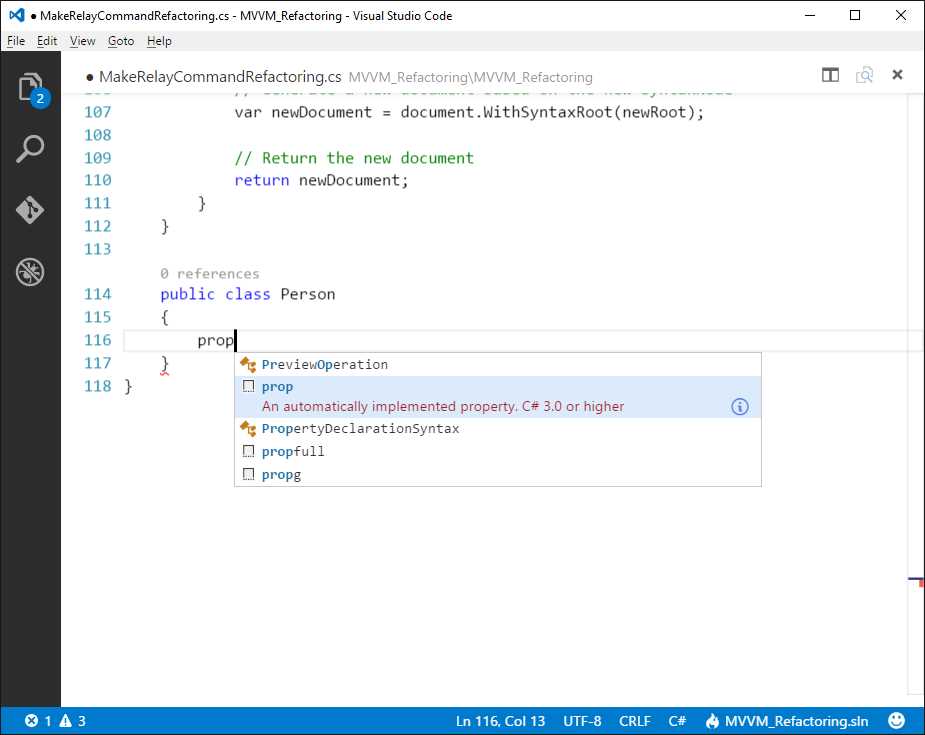
Figure 27: Inserting a Code Snippet Using Emmet Abbreviations
Code snippets are available in the IntelliSense pop-up as you type. They're recognizable by the small white sheet icon. Pressing Tab over the snippet in the previous figure produces the result shown in Figure 28.
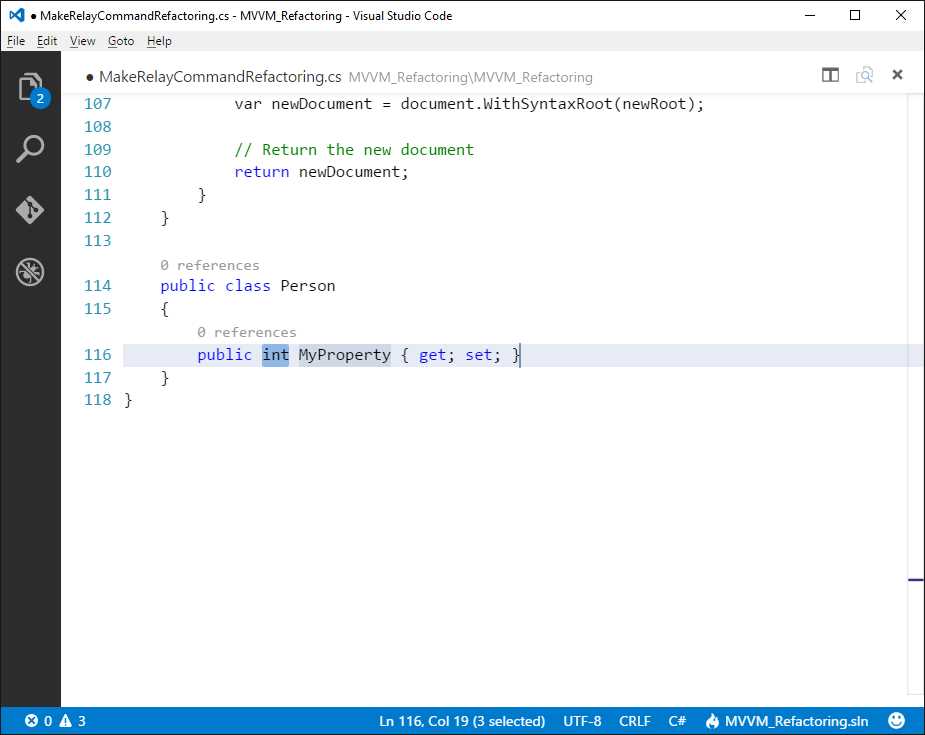
Figure 28: A Property Added via a Code Snippet
As another example, with JavaScript code files you can use the define snippet (see Figure 29) to add a module definition. This code snippet produces the result shown in Figure 30.
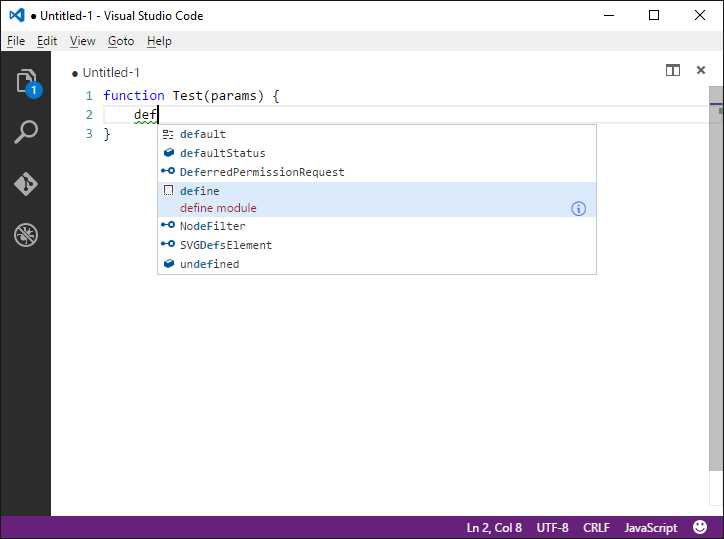
Figure 29: Adding a JavaScript Code Snippet
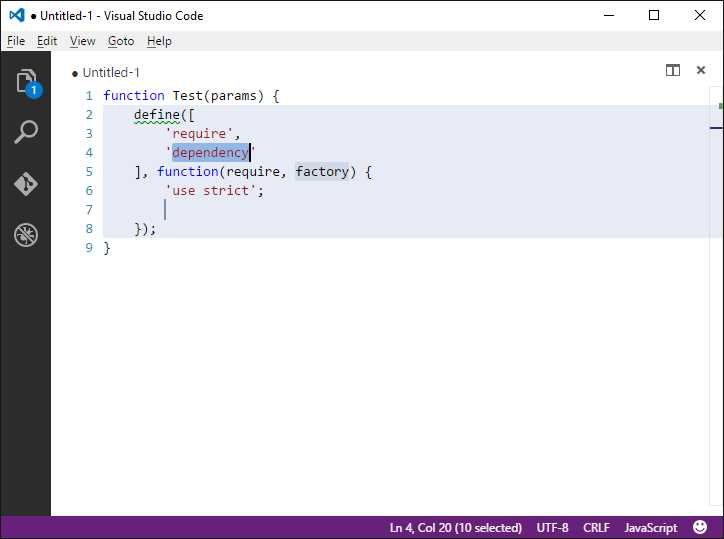
Figure 30: A JavaScript Module Definition Added via a Code Snippet
Visual Studio Code is not limited to built-in code snippets. You can download code snippets produced by the developer community for many languages, and you can even create and share your own snippets. This is discussed in Chapter 5, "Customizing and Extending Visual Studio Code".
Working with files and folders
Visual Studio Code is based on files and folders. This means that you can open one or more code files individually, but it also means that you can open a folder that contains source code files and treat them in a structured, organized way. When you open a folder, Visual Studio Code searches for one of the following files:
- package.json
- project.json
- tsconfig.json
- .sln or .xproj Visual Studio solution and project files for ASP.NET Core
If Code finds one of these files, it is able to organize the file structure into a convenient editing experience and offer additional rich editing features such as IntelliSense and code refactoring. If a folder only contains source code files without any of the aforementioned .json or .sln files, it still opens and shows all the source code files in that folder, providing a convenient way to switch between all of them. The sections that follow describe how to work with single files and folders in Visual Studio Code, plus how Code manages projects.
Working with single code files
The easiest way to get started editing with Visual Studio Code is to work with one code file. You can open an existing supported code file with File > Open, or by pressing Ctrl+O. On Windows, you can also right-click a file name in File Explorer and select Open with Code if you enabled that option when you installed VS Code. Visual Studio Code automatically detects the language for the code files and enables the proper editing features. Of course, you can certainly open more files and easily switch between files by pressing Ctrl+Tab. As you can see in Figure 31, a convenient pop-up shows the list of open files; by pressing Ctrl+Tab you will be able to browse files, and when you release the keys the selected file will become the active editing window.
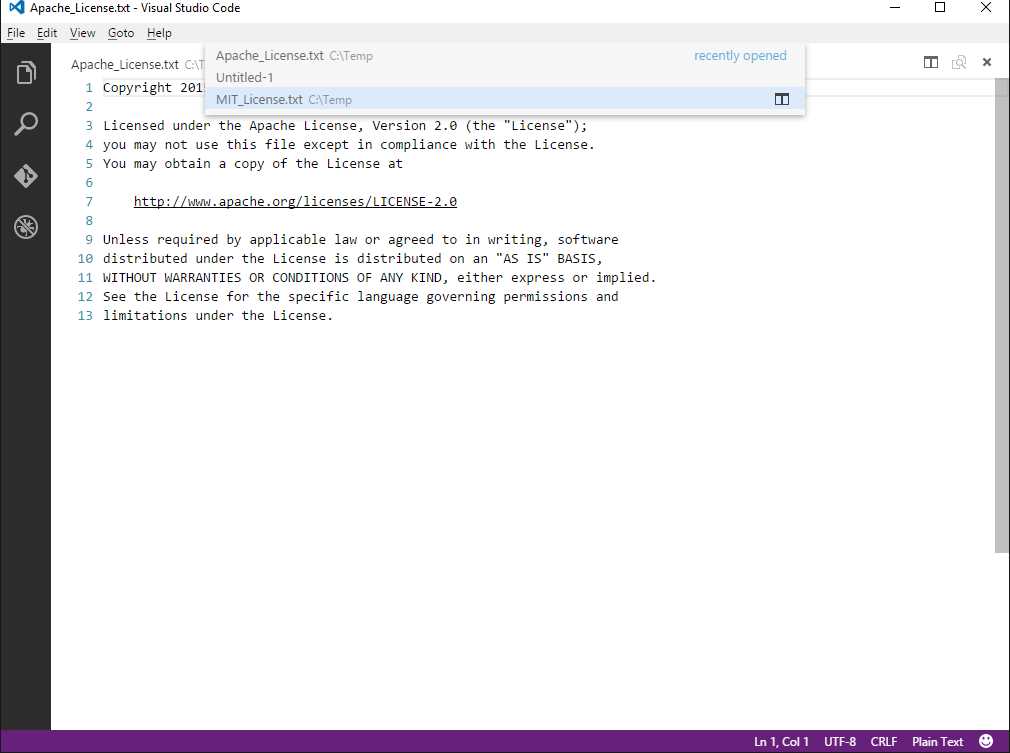
Figure 31: Switching between Code Files
Tip: Visual Studio Code also features the Explorer, which provides a structured, organized view of currently opened files. This is discussed in Chapter 2, "The Workspace and the User Interface."
An editor can be closed by using the Close button at the upper right corner, or by using the Close All Files command in the File menu.
Creating a new code file and language selection
You create a new file by clicking File > New File, or by pressing Ctrl+N. By default, new files are treated as plain text files. To change the language for a new file, click the Select Language Mode item in the lower right corner of VS Code, near the smile symbol. In this case, you will see Plain Text as the current mode, so click it. As you can see in Figure 32, you will be presented with a list of supported languages where you can select the new language for the current file. You can also start typing a language name to filter the list.
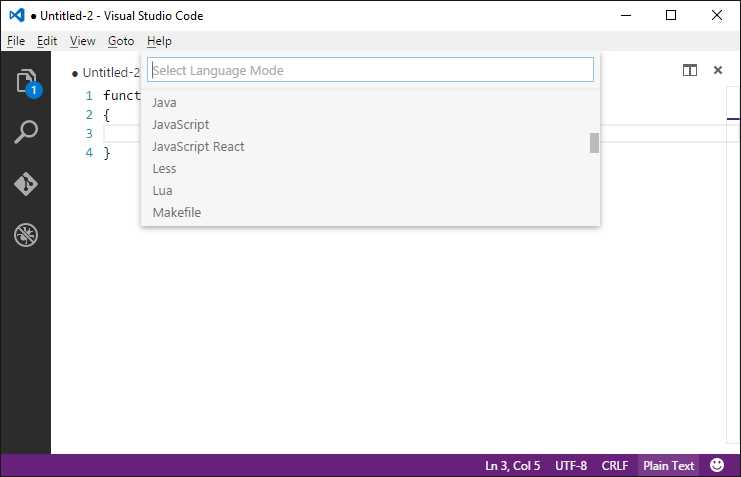
Figure 32: Switching between Code Files
When you select a new language, the Select Language Mode pop-up is updated with the selected language and the editor enables the proper features it, as shown in Figure 33 where the syntax colorization and IntelliSense is based on selecting JavaScript.
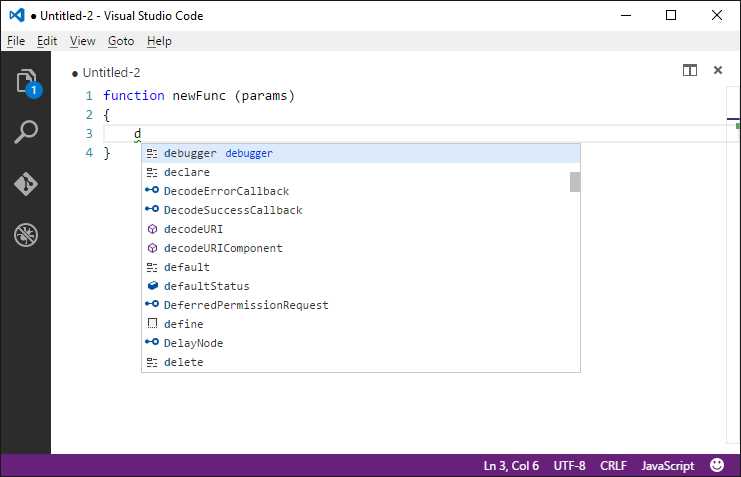
Figure 33: Changing the language for a code file enables the proper features.
Of course, you can change the current language for any existing files, not just new files.
File encoding, line terminators, and line browsing
Visual Studio Code allows you to specify an encoding for new and existing files. Default encoding for new files is UTF-8. You can change the current encoding by clicking the Select Encoding item in the bottom right, represented in the previous figures as UTF-8, the current encoding. You will be presented with a list of supported encodings with a search box where you can start typing encoding names to filter the list (see Figure 34).
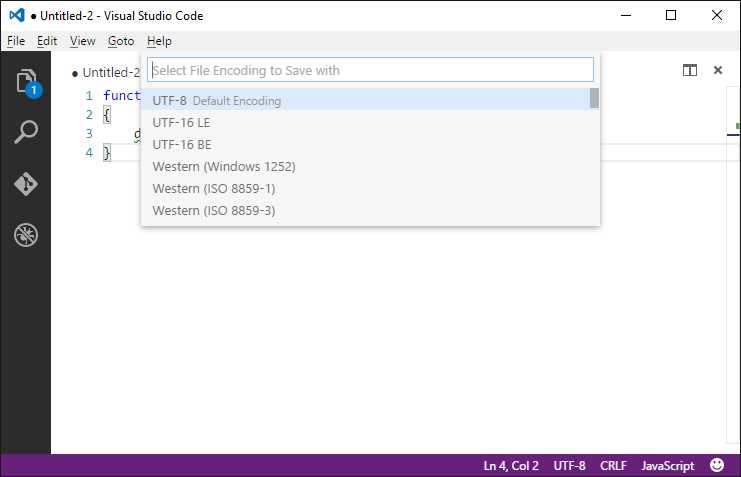
Figure 34: Selecting a Different Encoding
Similarly, you can change the line terminator by clicking the Select End of Line Sequence item, represented in previous figures by CLRF in the lower right corner of the editor. Visual Studio Code supports CRLF (carriage return and line feed) and LF (line feed); the default selection is CRLF. You can also move instantly to a line of code by clicking the Go to Line item, represented by the line and column number in the status bar. This will open a search box where you can type the line number you want to go to and the line of code will be immediately highlighted as you type. You can also navigate to a line by pressing Ctrl+G (see Figure 35).
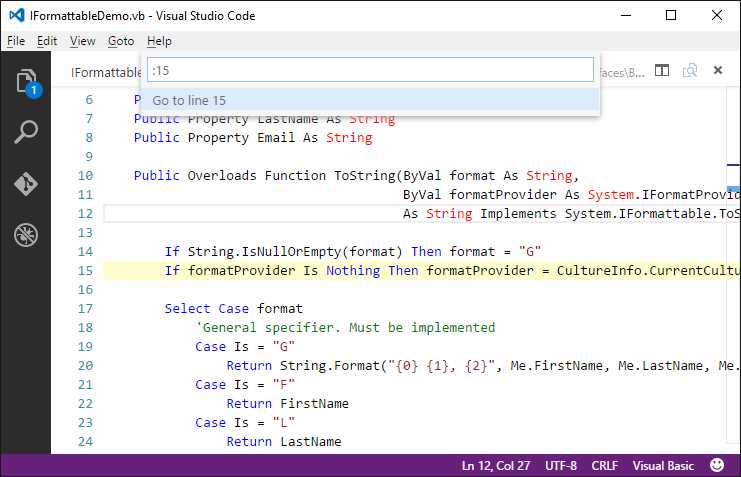
Figure 35: Go to Line in Action
Working with folders and projects
Compared to other development environments such as Microsoft Visual Studio, Visual Studio Code is folder based, not project based. This makes Visual Studio Code independent from proprietary project systems. VS Code can open folders on disk containing multiple code files and organize them the best way possible in the environment, and it also supports a variety of project files. More specifically, when you open a folder, Code first searches for:
- project.json files. If found, Code treats the folder as a DNX project written in C#. DNX stands for .NET Execution Environment and is a runtime with an SDK built on top of .NET Core for building portable, cross-platform ASP.NET Core solutions.
- MSBuild solution files (.sln). If found, Visual Studio Code knows this is a solution built for Microsoft Visual Studio, so it scans the referenced projects (*.csproj and *.vbproj files) and organizes files and subfolders in the proper way.
- tsconfig.json files. If found, Visual Studio Code knows this represents the root of a TypeScript project, so it scans for the referenced files and provides the proper file and folder representation.
- jsconfig.json files. If found, Visual Studio Code knows this represents the root of a JavaScript project. So, similarly to TypeScript, it scans for the referenced files and provides the proper file and folder representation.
- package.json files. These are typically included with JavaScript projects and DNX projects, so Visual Studio Code automatically resolves the project type based on the folder’s content.
Tip: Opening a .sln or .json file directly will result in editing the content of the individual file. For this reason, you should open a folder, not a solution or project file.
If none of the supported projects are found, Visual Studio Code loads all the code files in the folder as a loose assortment, organizing them into a virtual folder for easy navigation. Now let’s discover how Visual Studio Code allows you to work with folders and supported projects.
Opening a folder
Generally speaking, you open a folder with Code via File > Open Folder. On Windows, if you selected the option during installation, you can right-click a folder name in File Explorer and then select Open with Code. Whatever folder you open, Code organizes files and subfolders into a structured view represented in the Explorer side bar. Figure 36 shows an example.
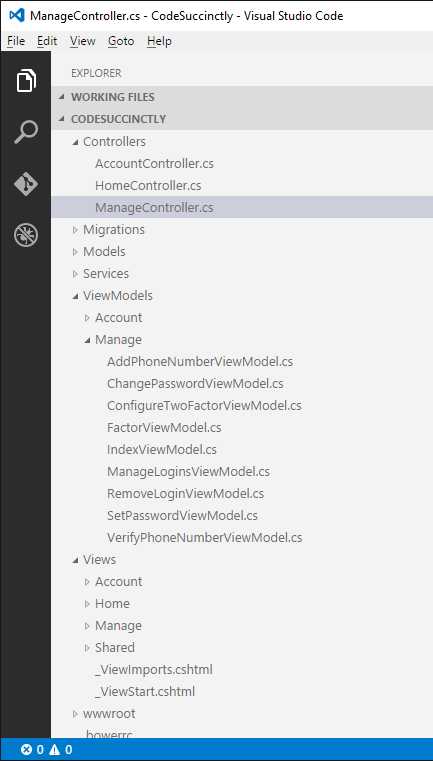
Figure 36: Organizing Folders and Files within Explorer
The root container is the folder name. Files and subfolders are nested in it, and you can expand each subfolder to browse every file it contains. Just click a file to open an editor window of it. The Explorer tool is much more than just file browsing, but let’s save this for Chapter 2, where I will discuss Code’s user interface deeply. For now, focus on the visual representation it provides for any folders.
Working with DNX projects (ASP.NET Core)
Visual Studio Code has deep support for DNX projects targeting ASP.NET Core with C#. When you open a folder that contains a DNX project, Visual Studio Code organizes all the code files into the Explorer bar and enables all the available editing features for C#. Figure 37 shows an example.
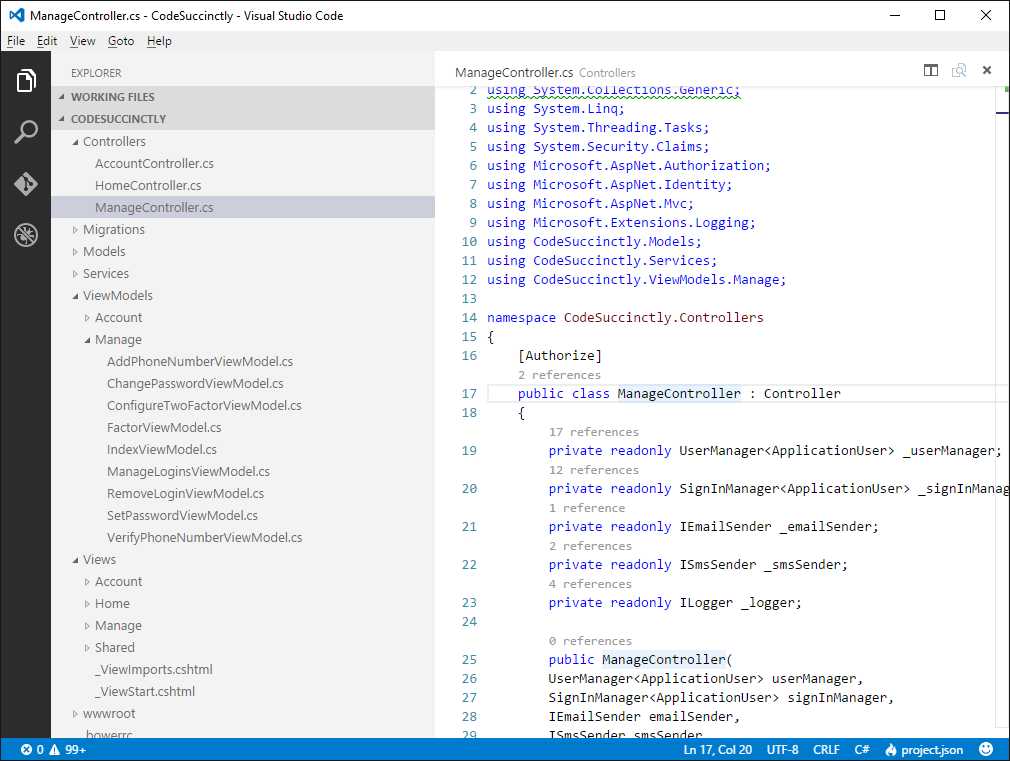
Figure 37: Opening a DNX Project with Visual Studio Code
Notice how the root level in Explorer is the project name. You can browse folders, code files, and edit anything that Visual Studio Code can properly recognize. You can also take a look at the project.json file, which contains project information, the list of dependencies, scripts, and other information. Figure 38 shows an excerpt.
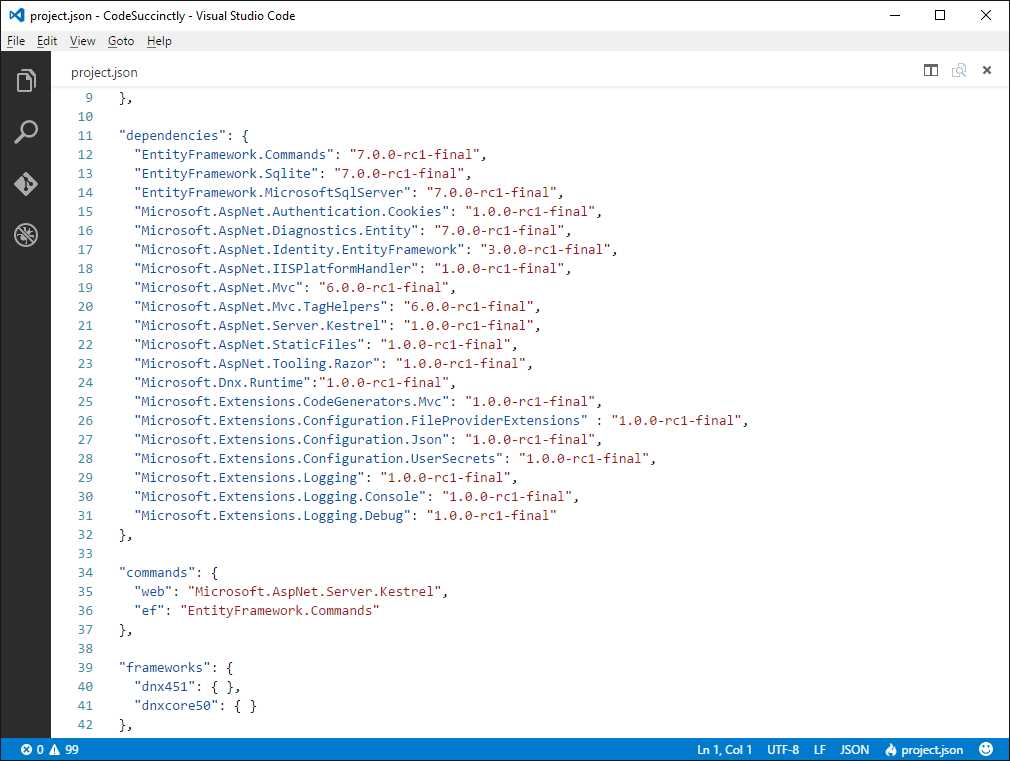
Figure 38: Examining a project.json file
Note: With DNX projects, you will be required to restore NuGet packages using the dnu restore command from the Command Palette. This is described in more detail in Chapter 4, "In Practice."
Working with JavaScript projects
Similarly to DNX, Visual Studio Code can manage JavaScript folders by searching for jsconfig.json or package.json files. If found, Code organizes the list of folders and files the proper way and enables all the available editing features for all the files it supports, as shown in Figure 39.
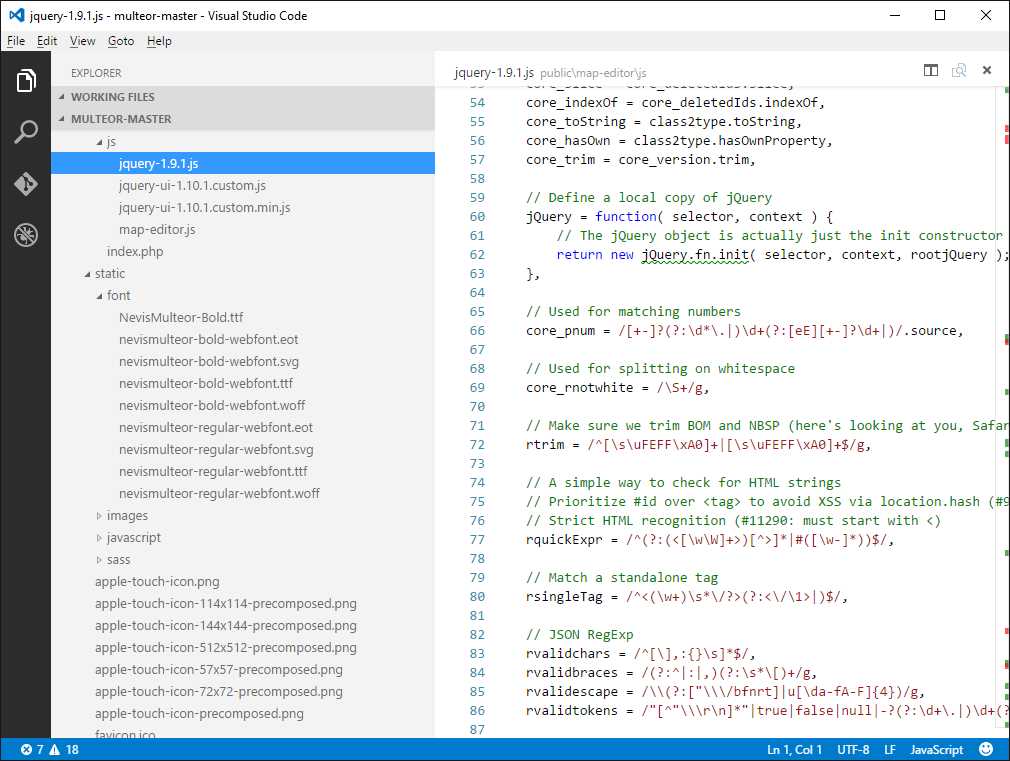
Figure 39: Opening a JavaScript Project
TypeScript projects behavior in Visual Studio Code is the same as for JavaScript.
Working with MSBuild solutions
You might also need to open Microsoft Visual Studio solutions (.sln) with Visual Studio Code. If this is the case, do not open the .sln file directly. This would result in an editor window showing the XML content of the file. Instead, open the folder that contains the solution file. As you can expect, Visual Studio Code organizes the project files and folders within Explorer, and it enables all the editing features available for the selected files. Figure 40 shows an example.

Figure 40: Opening a Visual Studio Solution
It is worth noting that features such as Find all References and code issue detection are enabled if Visual Studio Code detects NuGet packages inside the solution.
Tip: In Chapter 3, "Git Version Control and Task Automation," you will also learn how to launch the MSBuild engine from VS Code and compile a DNX project written with C#.
Working with loose folders
Visual Studio Code certainly allows opening folders that contain unrelated, loose files. Visual Studio Code creates a logical root based on the folder name, showing files and subfolders. Figure 41 shows an example based on a sample folder called MyFiles.
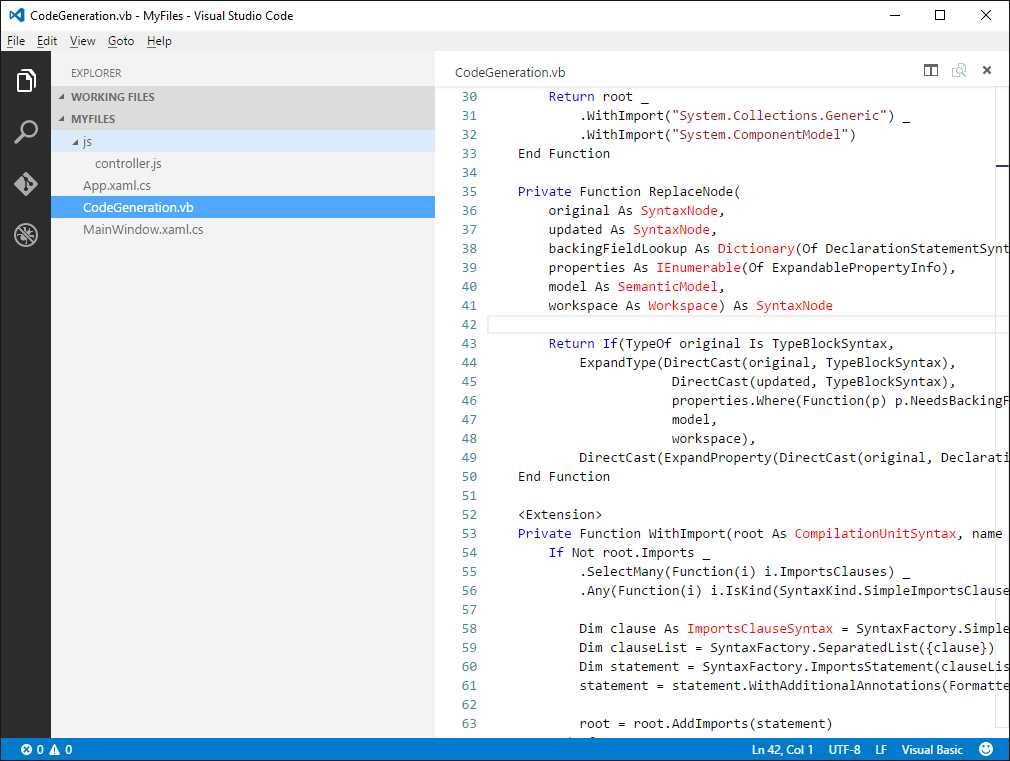
Figure 41: Opening a Folder Containing Loose Files
Chapter summary
Visual Studio Code is an open source, cross-platform, multi-language development environment that puts writing code at its center. Code supports a variety of languages and offers an enhanced editing experience with common features such as syntax colorization, and more advanced capabilities such as IntelliSense, code issue detection, and code browsing. In order to support different project systems, Visual Studio Code is file and folder based, which means that it supports working with loose code files and with organized, structured folders containing project and code files. After this long overview of the available editing features, the next logical step is discussing the workspace and the user interface.
- 1800+ high-performance UI components.
- Includes popular controls such as Grid, Chart, Scheduler, and more.
- 24x5 unlimited support by developers.