
Visual Studio 2022 Succinctly®

CHAPTER 4
Debugging Improvements
Debugging is the most crucial part of developing any kind of application; therefore, productivity in this area is extremely relevant. Microsoft adds new debugging features in every new major release of Visual Studio, and version 2022 is no exception. This chapter describes the debugging improvements you will find in VS 2022 that will boost your productivity in the most important part of the development lifecycle.
Forcing line execution
Visual Studio has always had a debugging command called Run To Cursor, which you can run by right-clicking somewhere in the code editor and then selecting the command from the context menu. This command allows for running all the code to the position of the cursor, but it will stop if any breakpoint is encountered. Visual Studio 2022 introduces a new command called Force Run To Cursor, which still executes all the code up to the line where the cursor is but ignores any preceding breakpoints. This command can be executed by right-clicking anywhere in the code editor and then selecting the item from the context menu. The latest versions of Visual Studio have also implemented a command called Run To Click, which simplifies the way you debug your code by clicking a play icon that appears when you hover over a line of code in debugging mode. Similar to Run To Cursor, this feature allows for executing all the code to the point where you select it, but it will stop if any breakpoint is encountered. In Visual Studio 2022, there is a new command called Force Run To Click, which can be enabled by pressing Shift and then hovering over the line of code you want to run code to. Figure 32 shows how the icon appears in the code editor.
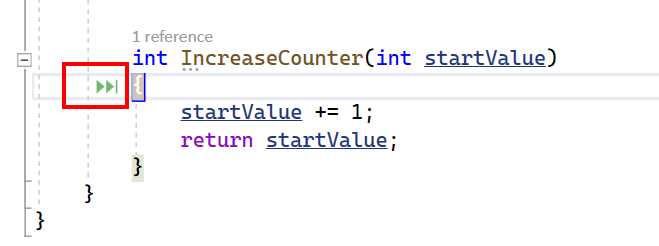
Figure 32: Using Force Run To Click
When you click the icon, all the code will be executed to the current position and any breakpoints will be ignored. This feature can be very useful when you need to test the execution flow of some code but you do not want to remove any breakpoints that you plan to reuse later.
Breakpoint improvements
Visual Studio 2022 also extends breakpoints with new features. This section describes the new glyph and context menu, and the new dependent and temporary breakpoint features.
Breakpoint user interface
Visual Studio 2022 now indicates where a breakpoint can be added via a new dark glyph that appears when you hover over the editor margin (see Figure 33).

Figure 33: New Glyph Showing Where a Breakpoint is Supported
This will let you know immediately if a breakpoint can be added to a given location. Simply click to add a breakpoint, as usual. Another addition to the way you interact with breakpoints is a new context menu that appears if you right-click on the editor margin, as shown in Figure 34.
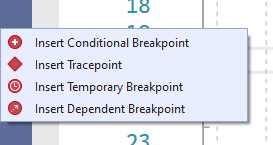
Figure 34: The New Context Menu for Breakpoints
As you might know, conditional breakpoints are hit only when the specified condition is met, whereas tracepoints display diagnostic messages in the Output window instead of breaking the execution. There are two new types of breakpoints, temporary breakpoints and dependent breakpoints, discussed in the next paragraphs.
Introducing temporary breakpoints
A temporary breakpoint is hit only once and is automatically removed once it has been hit. You have two ways to add a temporary breakpoint:
· Right-clicking the editor margin and selecting Insert Temporary Breakpoint (see Figure 34).
· Adding a breakpoint the usual way, then right-clicking the breakpoint and selecting Conditions, and finally enabling the Remove breakpoint once hit option in Breakpoint Settings (see Figure 35).
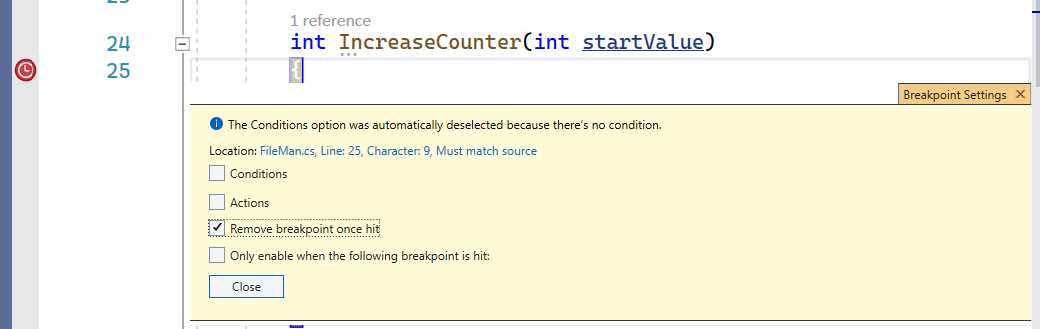
Figure 35: Setting a Breakpoint as Temporary
Temporary breakpoints are useful when you need to test a condition or a code block only once, such as inside a for loop, without breaking the application execution all the time.
Introducing dependent breakpoints
Dependent breakpoints are hit only if another specified breakpoint is also hit, otherwise they will be skipped. You can insert a dependent breakpoint by right-clicking the editor margin and then selecting Insert Dependent Breakpoint (see Figure 34). This will add a breakpoint and will open the Breakpoint Settings pop-up, automatically enabling the option called Only enable when the following breakpoint is hit, as shown in Figure 36.
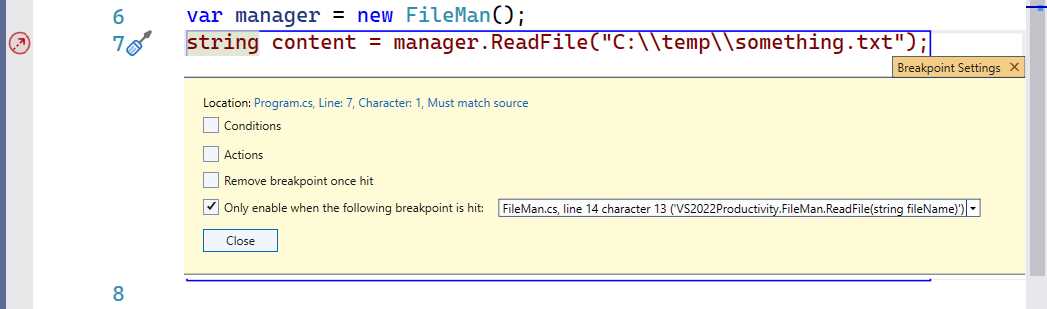
Figure 36: Adding a Dependent Breakpoint
You will have a chance to specify which breakpoint must be hit first to make the new one dependent. When done, simply click Close. The glyph of a dependent breakpoint is an arrow that points up and to the right.
Tip: Both temporary and dependent breakpoints can be quickly removed by clicking them in the editor margin or via the appropriate commands in the Debug menu.
Breakpoint drag and drop
Breakpoints now support drag and drop, so you can quickly move a breakpoint from one location by simply clicking and dragging the breakpoint and releasing it to the desired line of code. This also works with breakpoints that include conditions and actions in their settings as long as the conditions and actions are also within the context of the new desired location.
Exception settings improvements
Visual Studio 2022 introduces an interesting improvement to the exception helper dialog that appears when a runtime exception is thrown. More specifically, a new Continue button has been added at the upper right corner of the dialog, as shown in Figure 37.
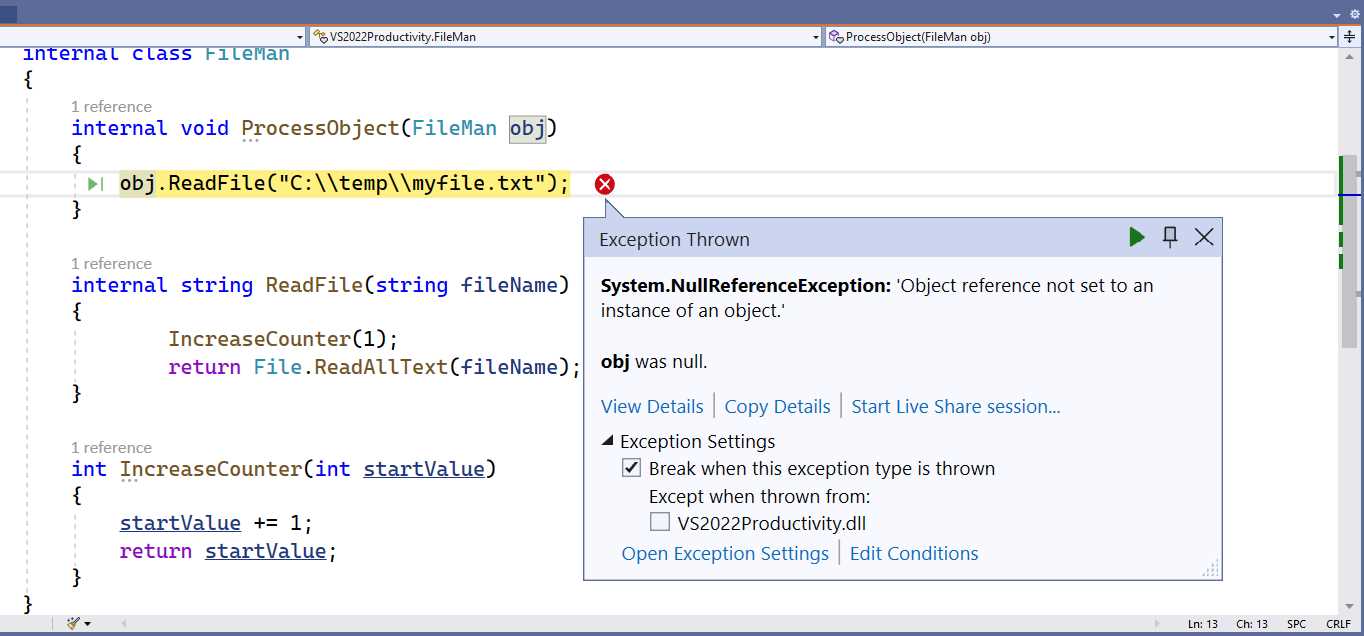
Figure 37: New Continue Button on Exception Helper Dialog
The new button is represented by a green play icon, and it works only if the specific context allows for resuming the application execution.
Note: Remember to avoid runtime exceptions using appropriate try...catch blocks. The code shown in Figure 37 is intentionally causing an exception to demonstrate the new feature, but it is not written properly because it is not checking for null references and not implementing a try...catch block.
Sticky data tips
As you probably know, when you hover over a variable at debugging time, the code editor shows the so-called data tips, small tooltips that allow you to investigate a variable’s value. The default behavior of data tips is that they automatically disappear after a few seconds, but sometimes you do not have enough time to look at the content of a variable, especially with those that represent complex types. Visual Studio 2022 introduces sticky data tips, which leave a data tip expanded until you click outside it. You need to explicitly enable this feature in the Debugging section of the Options dialog, as shown in Figure 38.
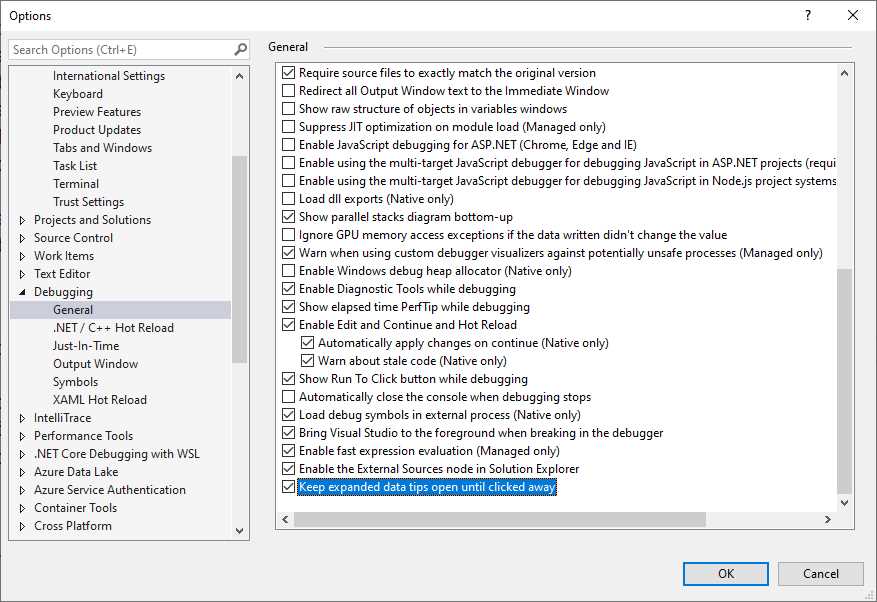
Figure 38: Enabling Sticky Data Tips
You need to enable the option labeled Keep expanded data tips open until clicked away. Sticky data tips will be enabled at this point. If not, you might need to restart Visual Studio. The appearance of data tips will not change; they will just stay open until you click outside of them.
IEnumerable Debugger Visualizer
One of the biggest additions to the debugging experience in Visual Studio 2022 is the IEnumerable Debugger Visualizer, an integrated tool that allows you to debug collections with a structured view instead of investigating their values inside small data tips. This tool supports any collection that derives from IEnumerable<T>, and even arrays. Setting up a code example is a good idea to understand how it works, so create a new console application in C# (the new visualizer also supports Visual Basic). If you choose to target .NET 6, remember that the project will use top-level statements described in Chapter 3, “Support for .NET 6.” The goal is creating and debugging a collection, so the first task is creating a data model represented by the Product class that you see in Code Listing 2.
Code Listing 2
public class Product { public int Id { get; set; } public string ProductName { get; set; } public double QuantityInStock { get; set; } public string ProductCode { get; set; } public DateTime DateOfPurchase { get; set; } } |
Then you need a class that exposes a collection of products. Code Listing 3 shows an example of collection implementation, including the generation of sample data that can be used for local demonstration purposes.
Code Listing 3
public class ProductsInStock { public List<Product> Products { get; set; } public ProductsInStock() { Products = GenerateSampleProducts(); } private List<Product> GenerateSampleProducts() { var product1 = new Product(); product1.Id = 1; product1.ProductName = "Sparkling water"; product1.ProductCode = "SPW"; product1.DateOfPurchase = DateTime.Now; product1.QuantityInStock = 100; var product2 = new Product(); product2.Id = 2; product2.ProductName = "Potatoes"; product2.ProductCode = "POT"; product2.DateOfPurchase = DateTime.Now; product2.QuantityInStock = 2000; var product3 = new Product(); product3.Id = 3; product3.ProductName = "Lemons"; product3.ProductCode = "LMN"; product3.DateOfPurchase = DateTime.Now; product3.QuantityInStock = 1500; var product4 = new Product(); product4.Id = 4; product4.ProductName = "Onions"; product4.ProductCode = "ONI"; product4.DateOfPurchase = DateTime.Now; product4.QuantityInStock = 500; var product5 = new Product(); product5.Id = 5; product5.ProductName = "Pears"; product5.ProductCode = "PRS"; product5.DateOfPurchase = DateTime.Now; product5.QuantityInStock = 800; var products = new List<Product>() { product1, product2, product3, product4, product5 }; return products; } } |
In the Program.cs file, add the following two lines of code at the bottom of the file if you are targeting .NET 6, or at the bottom of the Main method if you are targeting .NET 5 and lower:
var products = new ProductsInStock().Products;
Console.ReadLine();
Add a breakpoint on the ReadLine statement and press F5 to start debugging. When the application enters break mode, you will see the products variable listed in the Locals tool window. In this window, click the View button. At this point you will see the IEnumerable Visualizer window, which looks like Figure 39.
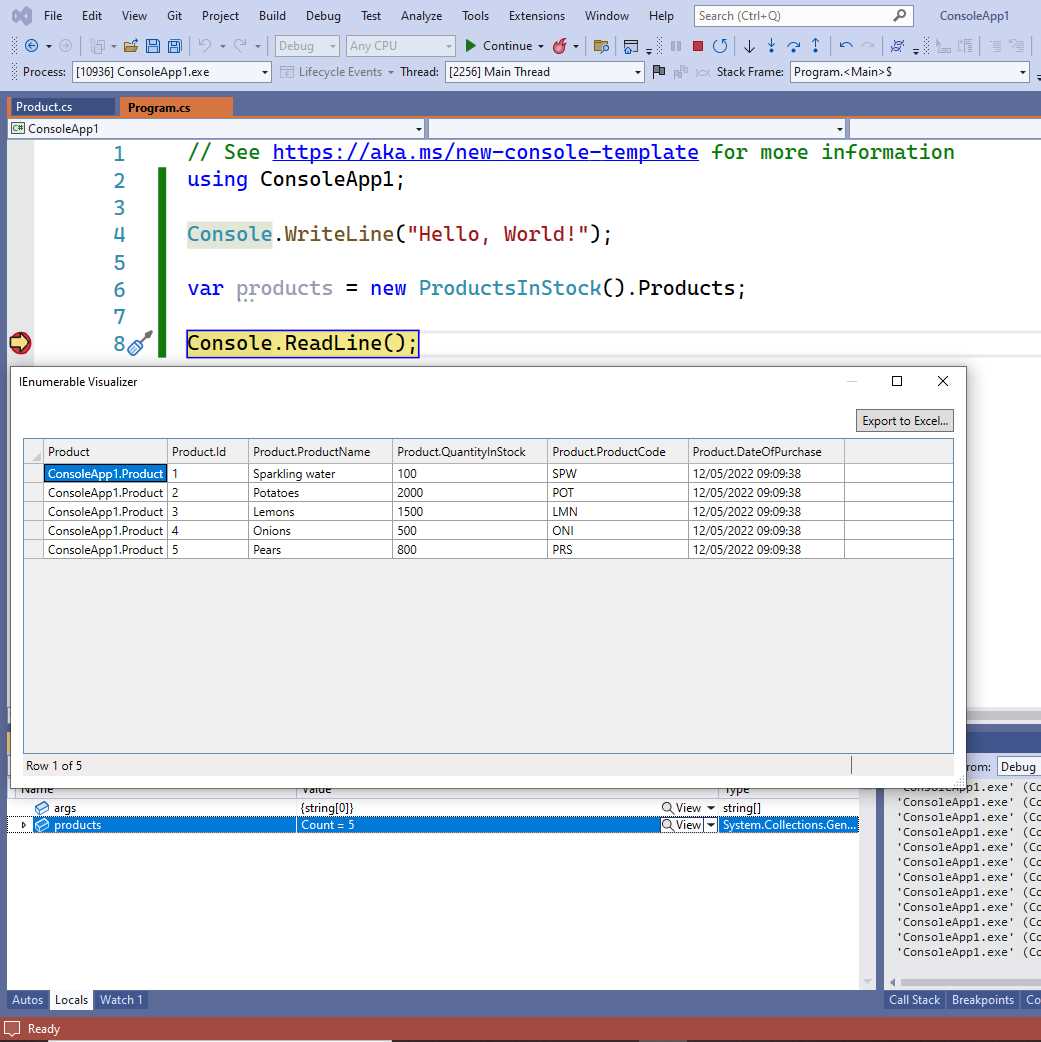
Figure 39: Debugging Collections with the IEnumerable Visualizer
As you can see, collection data is represented in a tabular view with columns and rows that show property values for each object instance in the collection. Notice that the first column of the table always shows the fully qualified object name. You also have an option to export data to an Excel file with the Export to Excel button, which is very useful with real, long data collections.
Note: The only way to display the IEnumerable Debugger Visualizer is to click the magnifier icon in the Locals window. If you click the magnifier icon when hovering over the collection variable name in the code editor, regular data tips will appear.
This is a tremendous addition to the Visual Studio toolbox because it dramatically simplifies the way you debug and investigate collections, especially with real data that comes from a database or a web service. Do not throw away the sample project; it will be used in the next section.
Debugging external sources with Source Link
Applications built upon .NET certainly rely on the framework libraries, but also on external dependencies such as NuGet packages. During the development and debugging stages, you might get exceptions thrown by such dependencies, but normally you do not have an option to debug the code of the dependency itself. Visual Studio 2022 introduces a new feature called Source Link which allows for debugging and stepping through the source code of dependencies, such as framework libraries and NuGet packages, exactly like you would do with your own code, bringing your debugging experience to a higher level.
Source Link basically loads the public debugging symbols of each referenced library (also referred to as modules), so that Visual Studio can enable the usual debugging tools. In addition, Visual Studio will load the appropriate source code files of the dependency, which means that Source Link is available only with those dependencies whose code has been published to a Git repository. Visual Studio supports the majority of Git repositories with Source Link, such as Azure DevOps, GitHub, Bitbucket, GitLab, and Gitea.
Note: You can also enable your libraries and NuGet packages for Source Link. This is not covered in this ebook, but the Source Link project documentation provides guidance on how to do it.
Loading symbols for every dependency used in the application can have a huge impact on performance, especially the first time you start debugging an app. You need to be aware of this before you use this feature. Before looking at an example, you need to do a few preliminary steps to enable Source Link:
- Open Tools > Options > Debugging and disable the Enable Just My Code option, so that Visual Studio can search for symbols outside of the solution.
- Under the Symbols node of the Debugging options, select the Microsoft Symbol Servers and NuGet.org Symbol Servers options (see Figure 40).
- At the bottom of the same node, ensure the Load all modules, unless excluded option is also selected (see Figure 40).
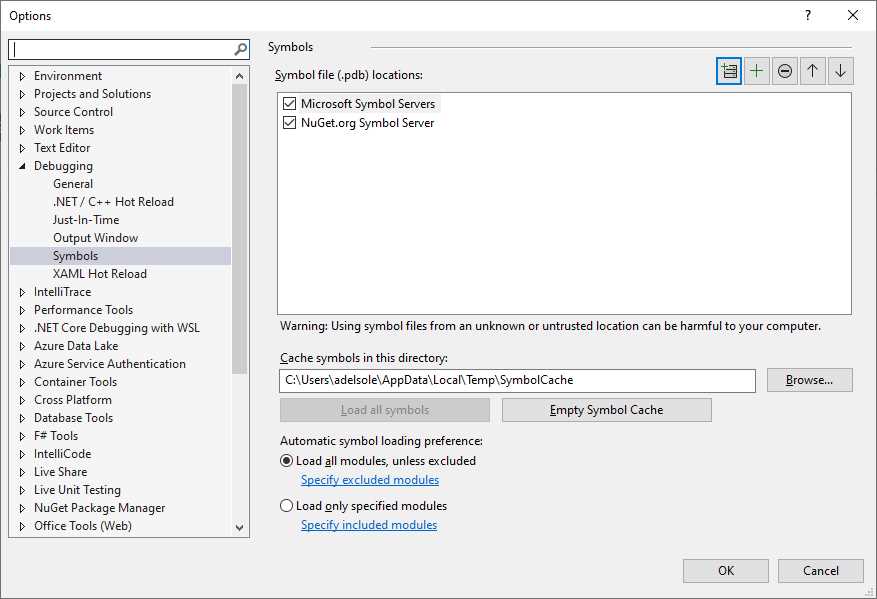
Figure 40: Setting Options to Enable Source Link
Click OK when done. Now suppose you want to implement JSON serialization for the Products collection discussed in the previous section about the IEnumerable Visualizer feature. First, add the NewtonSoft.Json NuGet package to the solution. You might know that now .NET 5 and 6 include native support for JSON, but without a doubt the NewtonSoft.Json library has been for years the de facto standard and millions of developers are using it, so debugging its code can be a common need. When the package has been installed, add a using Newtonsoft.Json; directive at the top of your Program.cs file, and then add the following line after the instance of the Products collection is created:
var serialized = JsonConvert.SerializeObject(products);
Place a breakpoint on this line and press F5 to start debugging. At this point, you will notice that:
· A new node called External Sources appears in Solution Explorer.
· This node contains the list of modules that your app is referencing for which public debugging symbols were found on the server that can be debugged using Source Link.
· The Modules without sources folder contains the list of modules for which no public symbols were found on the server. These modules cannot be debugged with Source Link.
Figure 41 shows how the External Sources node appears.
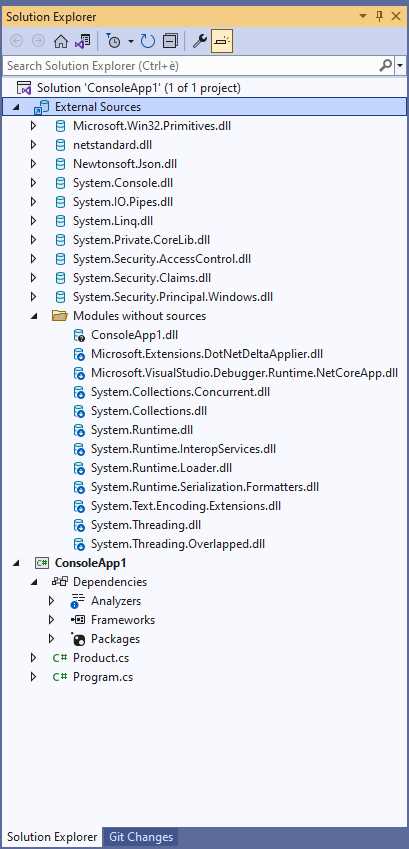
Figure 41: The External Sources Tool Window Displays External Modules
You will notice that the debugger takes more time to start because it needs to load symbols and reference modules. In general, it will take more time only the first time you use Source Link.
Note: Modules are incrementally loaded when a reference to them is required, so you will see the list of modules grow in the External Sources window as modules are referenced. This allows for minimizing the impact on the debugger performance when Source Link is enabled.
When symbols have been loaded, the debugger starts running the code under its control and it will reach the breakpoint you set up previously. Your goal is debugging the SerializeObject method from the Newtonsoft.Json.JsonConvert class, so press F11 to step into the code. The availability of debugging symbols is not the only prerequisite to use Source Link, but also the availability of source code on a Git repository, so Visual Studio will search for and download the appropriate source files for debugging. You will see the download progress on the status bar. In this particular case, Visual Studio downloads the JsonSerializer.cs file from the NewtonSoft.Json repository, and the code editor will move to the appropriate line of code for debugging, as you can see in Figure 42.
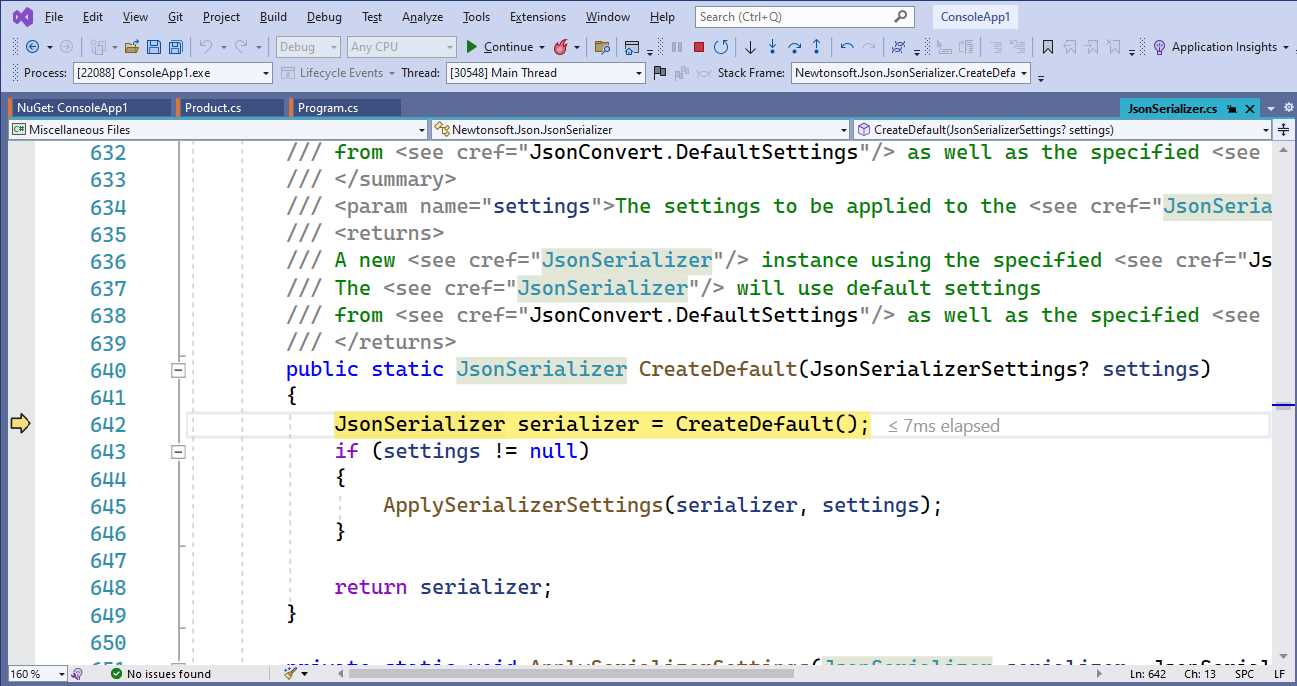
Figure 42: Stepping Through the Source Code of a Dependency
Now you can debug the code of the dependency as you would your own code. If the code you are debugging relies on other files, they will also be downloaded by Visual Studio, but only when they are required to minimize the impact on performance, and the debugger will be able to step through them. As you can understand, this feature is very powerful and extremely useful because it makes it possible to further investigate problems, exceptions, and variable values up to the root.
Easier live debugging with Hot Reload
Visual Studio 2022 enhances Hot Reload, a feature initially introduced with later service releases of Visual Studio 2019. Hot Reload is available to .NET and native C++ applications, and it allows adding or editing code while the application is running in debug mode, and also allows applying those changes without restarting the application. You may think of Hot Reload as the natural evolution of the Edit and Continue feature, with more supported scenarios and with a completely remade code injection engine. You can Hot Reload an application by clicking the Hot Reload button on the toolbar (see Figure 43).
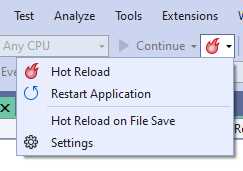
Figure 43: The Hot Reload Commands
If you do not see this button, you might need to enable Hot Reload. In the Options dialog, locate the Debugging > .NET/C++ Hot Reload node and make sure that the Enable Hot Reload and Edit and Continue When Debugging option is enabled. See the “Hot Reload settings” section later in this chapter for more details. The feature works silently, so you will not even notice that something has changed behind the scenes. Concerning .NET, Hot Reload applies to console, UWP, WPF, ASP.NET, Windows Forms, and MAUI projects. Xamarin.Forms is not supported in terms of C# code, but you can still use the XAML Hot Reload feature.
Tip: .NET 6 also allows for using Hot Reload without the debugger attached.
An example will help clarify how Hot Reload works. Create a blank WPF project that targets .NET 6. When ready, add the following simple button to the root Grid layout:
<Button x:Name="MainButton" Content="Click me!" Width="200" Height="40"
Click="MainButton_Click"/>
Make sure you add an empty Click event handler for the button as follows:
private void MainButton_Click(object sender, RoutedEventArgs e)
{
}
Now run the application in debug mode by pressing F5. As you can expect, clicking the button has no effect because the event handler is empty. With the application running, change the event handler as follows:
private void MainButton_Click(object sender, RoutedEventArgs e)
{
MessageBox.Show("You clicked!");
}
If you now click the Hot Reload button in the toolbar, your edits will be applied without restarting the application, which means that you can click the button and see the message box appear (see Figure 44). A faster shortcut to enabling Hot Reload is described in the next paragraphs about Hot Reload settings.
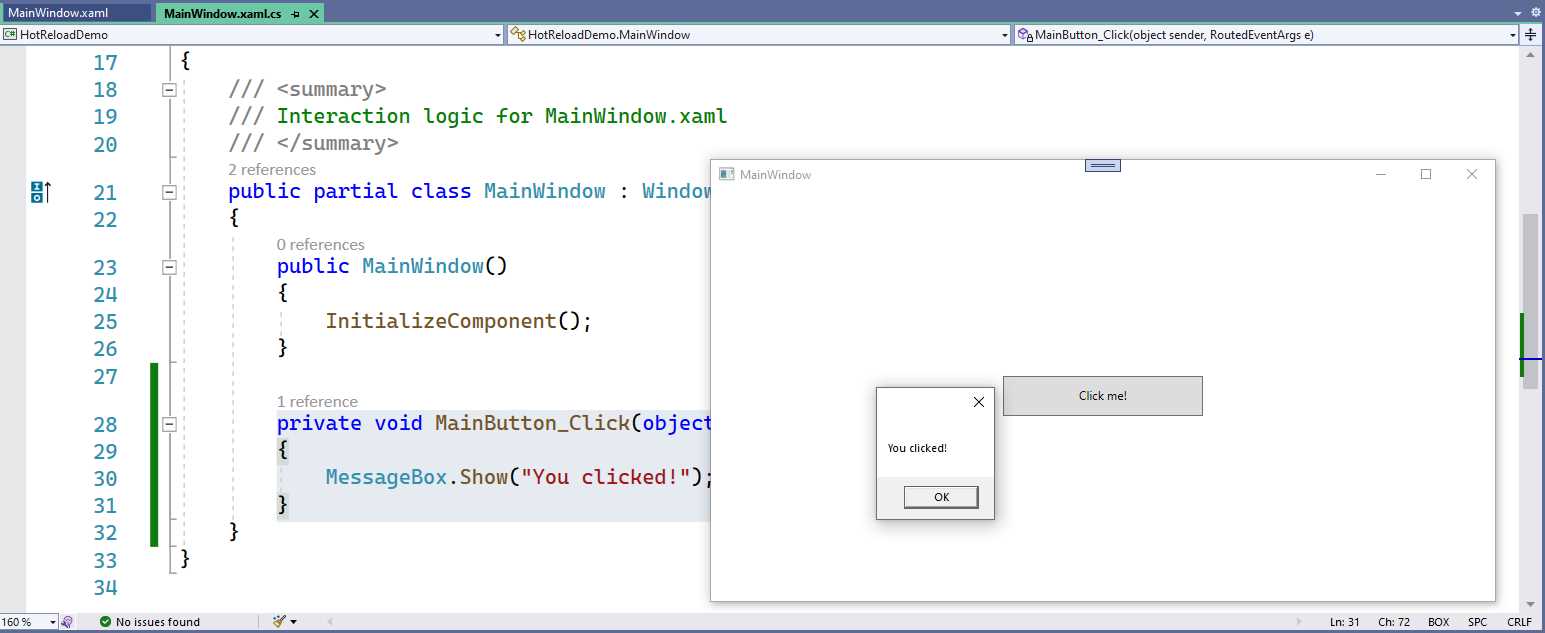
Figure 44: Code Changes After Hot Reload
Hot Reload is a good feature that improves productivity when debugging; however, it cannot be used in every situation. For example, an event handler is a perfect place because it gives enough time to the debugger to inject code and make it discoverable by the application. There are other specific circumstances in which Hot Reload can be used, as you will discover in the next section.
Scenarios supported by Hot Reload
At this writing, Hot Reload works with the following code edit types:
· Adding, editing, or removing custom Attribute objects.
· Adding or updating record struct blocks (available in C# 10).
· Adding or updating #line directives.
· Editing Switch expressions.
· Editing files with #line directives, including changes to the directive itself.
· Editing top-level statements (see Chapter 3, “Support for .NET 6” for information about top-level statements).
· Editing code that uses any of the new C# 10 features, such as global using directives, file-scoped namespaces, improved lambdas, and parameterless struct constructors.
· Renaming parameters of lambda expressions.
· Renaming parameters of existing methods.
However, Hot Reload is being continuously improved, so it is reasonable to expect support for additional coding scenarios in the next VS releases. Make sure you read the Visual Studio release notes when a new update is published so you can be aware of what’s new with Hot Reload too.
Tip: If you make changes that are not supported and you try to Hot Reload the application, Visual Studio will show a dialog informing you that a full application restart is required, providing an option to do so.
Hot Reload settings
Hot Reload settings can be controlled in the Options dialog, more specifically by selecting the Debugging > .NET/C++ Hot Reload node (see Figure 45).
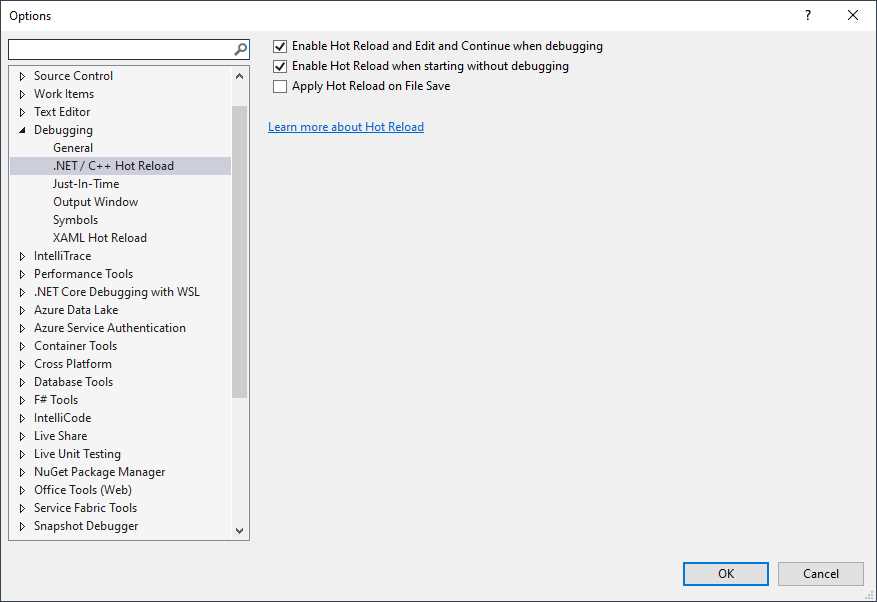
Figure 45: Hot Reload Settings
From here you can enable and disable Hot Reload, and you can make Visual Studio invoke Hot Reload when you save files after making changes. This is accomplished by enabling the Apply Hot Reload on File Save option, or by selecting the Hot Reload on File Save command in the Hot Reload menu (see Figure 43). When this option is enabled, you can make changes to your code, save your file, and Hot Reload will be automatically invoked for you.
Improvements to the Attach to Process dialog
As you know, the Visual Studio debugger can be attached to external processes via the Attach to Process dialog, which you enable from the Debug menu. In VS 2022, there is a new option called Automatic refresh, which automatically refreshes the list of processes. Figure 46 shows how it appears.
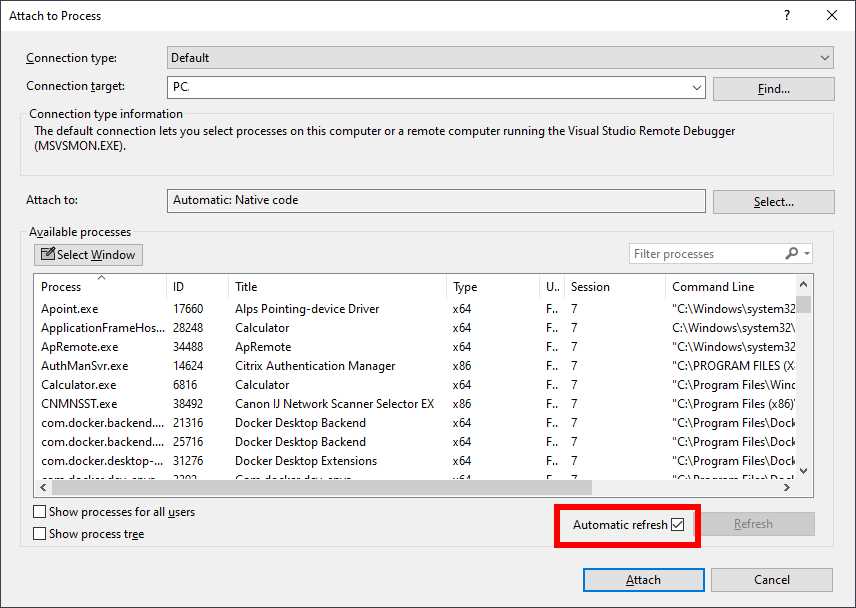
Figure 46: The New Automatic Refresh Option in the Attach to Process Dialog
Chapter summary
Debugging is such a crucial activity in the application development lifecycle that Microsoft is continuously improving and adding productivity tools to the debugging experience in Visual Studio. VS 2022 offers tools that you can use in the code editor, such as temporary breakpoints, dependent breakpoints, and breakpoint drag-and-drop; and tools like Hot Reload that speed up the way you make changes to your code while debugging. The new and updated features you have seen in this chapter generally apply to C# and C++ code, but there are additional productivity features that are specifically added to the XAML editor, as you will discover in the next chapter.
- 1800+ high-performance UI components.
- Includes popular controls such as Grid, Chart, Scheduler, and more.
- 24x5 unlimited support by developers.