
Visual Studio 2019 Succinctly®

CHAPTER 5
What’s New in the Debugger
Every major release of Visual Studio puts productivity at the core of its improvements, and VS 2019 is no exception. Productivity is not only about coding; it’s about all the development activities, and debugging is crucial in an app development lifecycle. For this reason, new features have been introduced to improve your productivity at debugging time. This chapter describes what’s new for the Visual Studio debugging experience, with a closer look at new features for .NET Core.
Searching local variables within debug windows
Note: This feature is available to all .NET applications.
Inspecting local variables while debugging has always been one of the most-used features within popular debug windows such as Locals, Autos, and Watch. However, you might have hundreds of local variables, so scrolling the list of locals and focusing on their values can be difficult.
Visual Studio 2019 introduced a search box for local variables in the Locals, Autos, and Watch debug windows. Figure 56 shows an example based on the Locals window, and Figure 57 shows another example based on the Autos window.
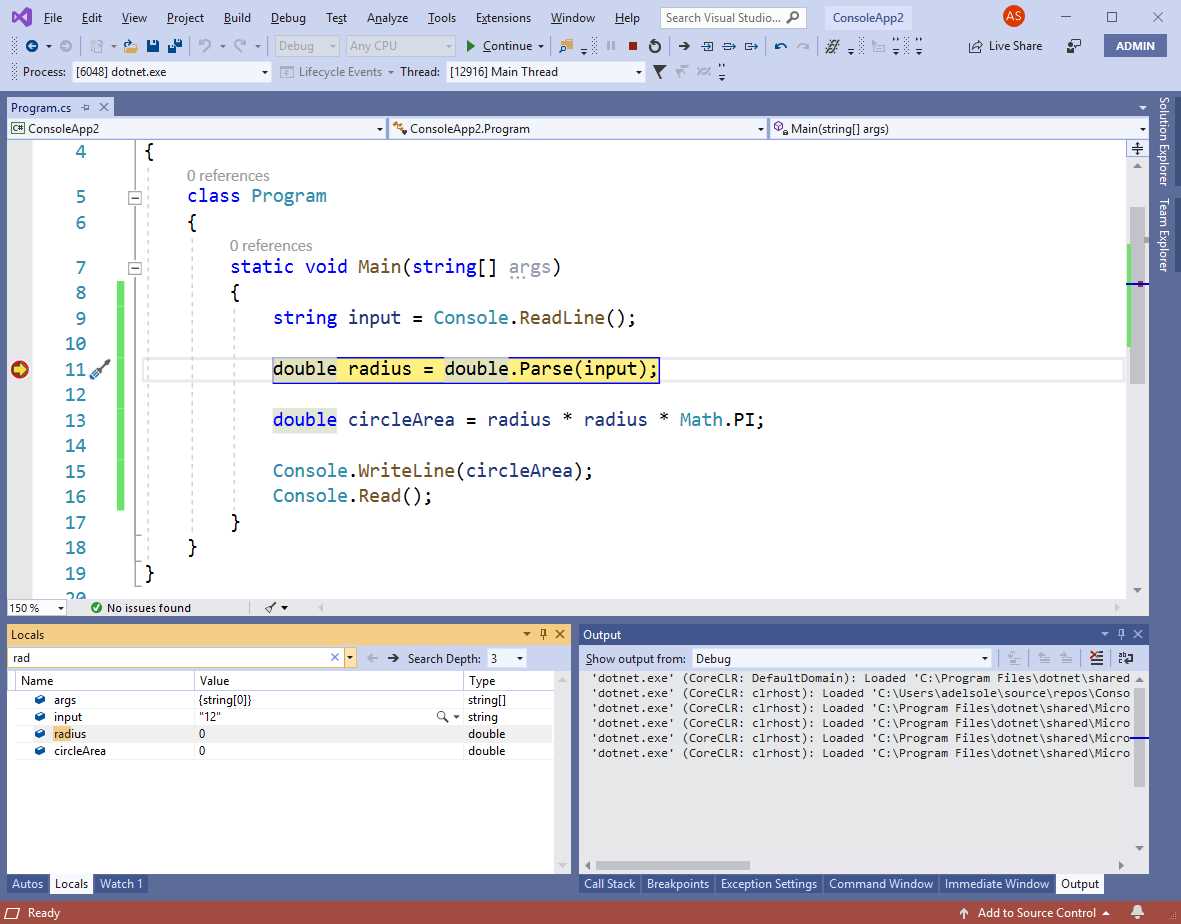
Figure 56: Searching for local variables in the Locals window
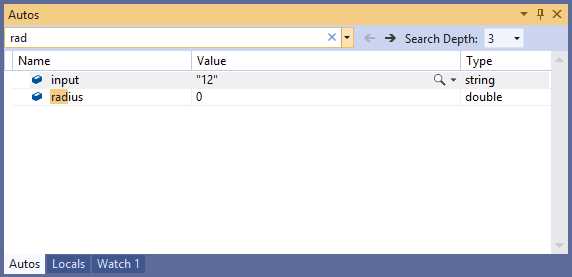
Figure 57: Searching for local variables in the Autos window
You can type in the search box and variable names matching your criterion will be highlighted. You can then use the Find Next and Find Previous buttons (at the right side of the search box) to quickly move between variables. The Search Depth combo box allows you to specify how many locals matching the criterion will be highlighted, with a minimum of 1 and a maximum of 10.
Introducing data breakpoints
Note: This feature is available only to projects built with .NET Core 3.0 (and later). It is new to .NET Core, but already existed for C++.
It is very common to have code blocks that are called many times, and you might want to debug only when a certain condition happens. This has always been possible using breakpoint conditions, which you set by right-clicking a breakpoint, selecting Conditions, and writing the conditional expression that must be evaluated as true in order to hit the breakpoint. A very common condition is breaking the application execution when the value of a variable changes, so Visual Studio 2019 makes it easier to control this scenario without the need of breakpoint conditions. In fact, you can now right-click a variable name in the Local window and then select Break When Value Changes (see Figure 58).
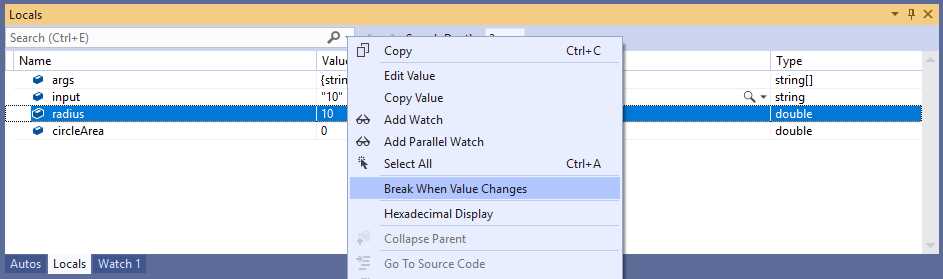
Figure 58: Using the new Break When Value Changes feature
Visual Studio will automatically track your variable, and it will break the application execution when the variable value changes. If the variable represents a reference type, the application execution will break when a property referencing the object changes its value. This new feature is referred to as data breakpoints and is also useful when you want to know when something is added or removed from a collection.
For example, setting a data breakpoint on the Count property of collection classes exposed by the System.Collections.Generic namespace makes it easy to detect when the collection has changed.
Formatting locals with format specifiers
Visual Studio 2019 introduces support for the so-called format specifiers inside debug windows that display local variables. To understand how this works, add a local variable to a Watch window while in break mode. Click the variable name and enter a comma when the cursor is available (see Figure 54). You will see a drop-down that contains a list of format specifiers; you can hover over each specifier to see a description. For example, the nq format specifier presents a string without quotes in the Value column of the Watch window, as demonstrated in Figure 59.

Figure 59: The list of format specifiers
Format specifiers are applied according to the object type. The description you get when hovering will help you understand if a specifier can be applied to a local variable. This feature is useful when you have complex data representations, and it is also available to C++.
DataSet visualizer for .NET Core
The .NET Core API now includes the System.Data namespace and objects such as DataSet and DataTable. Visual Studio 2019 introduces a specific debugger visualizer for DataSet objects in .NET Core, called DataSet visualizer, which provides a tabular view of the data contained in a DataSet and its DataTable objects. Assuming you have a DataSet populated with some data, and that the application is in break mode, you can hover over a variable of type DataSet and enable the data tip, as shown in Figure 60.
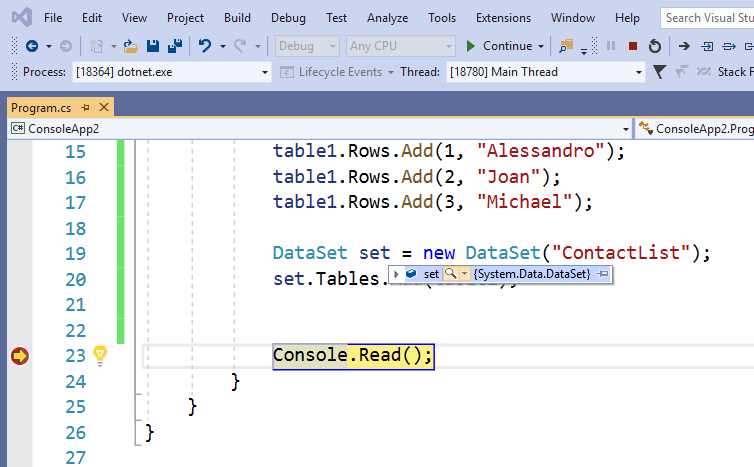
Figure 60: Enabling the data tip on a DataSet
If you click the magnifier icon, the DataSet visualizer will appear, and will display a tabular representation with columns and rows, as you can see in Figure 61.
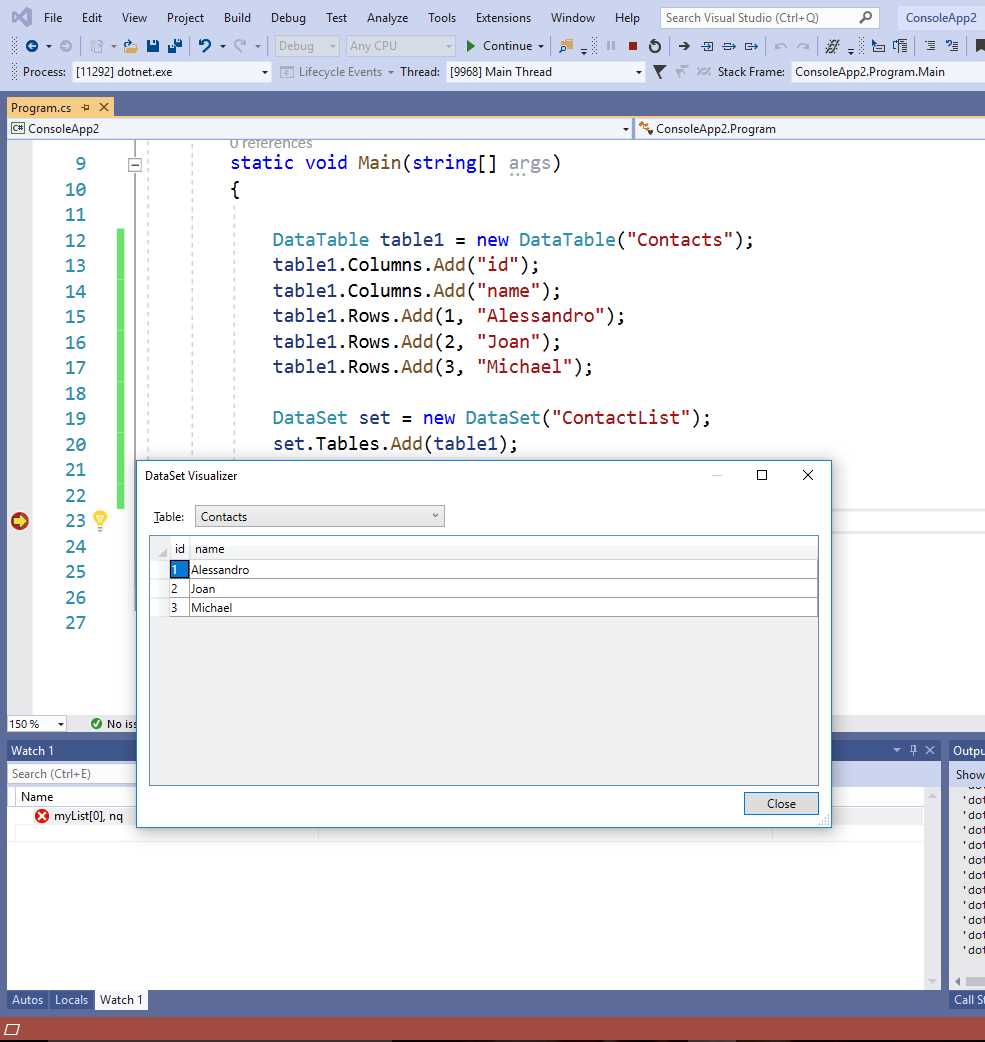
Figure 61: The DataSet visualizer in action
You can select a different table by expanding the Table combo box. This is a very useful feature that will help you have a precise representation of your data at debugging time.
Feature preview: the Time Travel Debugger
Microsoft is working on a new debugging tool called Time Travel Debugger (TTD). The TTD provides the ability to record a web app running on an Azure Virtual Machine and then accurately reconstruct and replay the execution path, with the help of the integrated Snapshot Debugger. I will not cover this feature in detail for the following reasons:
- It is in a preview state.
- It is available only in Visual Studio 2019 Enterprise.
- It only works against code running on Azure virtual machines and, therefore, an Azure subscription with a proper environment setup is required.
You can read more about Time Travel Debugger in this blog post.
Chapter summary
Powerful debugging tools are very important for developers and Visual Studio has always offered first-class instrumentation. Visual Studio 2019 improves the debugging tools in many ways.
You can now search and filter the list of local variables in the Local, Autos, and Watch windows. These debugging windows now also offer format specifiers, so that you can format a variable value the most appropriate way. .NET Core apps can leverage data breakpoints and break the application execution only when a local variable or an object property changes its value.
Another addition to .NET Core is the DataSet visualizer, which allows you to view the content of an object of type System.Data.DataSet in a tabular, human-readable way. This chapter completes the overview about IDE productivity improvements. The next two chapters cover topics that are more related to application development.
- 1800+ high-performance UI components.
- Includes popular controls such as Grid, Chart, Scheduler, and more.
- 24x5 unlimited support by developers.