
SQL Server Analysis Services Succinctly®

CHAPTER 3
Developing Dimensions
In this chapter, I explain the development tasks to perform during the development of dimensions for an Analysis Services database. You start by using the Dimension Wizard to build a dimension, and then configure attribute properties that control the content and the behavior of the dimension. You can also create hierarchies to facilitate drill-down and to optimize performance in cubes. If you need to support multiple languages in your cube, you can configure translations for the dimension. As you work, you might need to address best practice warnings that can help you avoid design and performance problems.
Dimension Wizard
You use the Dimension Wizard to select the table to use as a source for the dimension and to set some initial properties for dimensions and attributes. To start the wizard, right-click the Dimensions folder in the Solution Explorer. On the Select Creation Method page of the wizard, keep the default selection of Use An Existing Table. The other options are used when you have no existing tables and want to generate a table that corresponds to a specific design.
Note: The exception is the Generate a Time Table on the Server option, which creates and populates a dimension object only in the Analysis Services database without creating a corresponding table in the data source.
On the Specify Source Information page of the wizard, shown in Figure 12, select the relevant table from the DSV, and identify the key column at minimum. The key column uniquely identifies each record in the dimension table and is usually the primary key of the table when you use a star schema for source data. You can specify multiple columns as key columns if the table has a composite key structure required to uniquely identify records.

- Specify Source Information Page of Dimension Wizard
Selecting a name column is optional in the Dimension Wizard. Its purpose is to display a label for dimension members when browsing the cube or its metadata. If you don’t select a name column, the value in the key column is displayed instead.
On the Select Dimension Attributes page of the Dimension Wizard, shown in Figure 13, you pick the attributes to include in the dimension. Each attribute corresponds to a table column in the DSV. You can also rename the attributes on this page if you neglected to rename the column in the DSV.

- Select Dimension Attributes Page of Dimension Wizard
Another task on this page is to specify whether users can view each attribute independently when browsing the cube. You do this by keeping the default selection in the Enable Browsing column. For example, if you have an attribute that is used exclusively for sorting purposes, you would clear the Enable Browsing check box for that attribute.
Note: You can also set the Attribute Type on the Select Dimension Attributes page of the Dimension Wizard, but you might find it easier to perform this task by using the Business Intelligence Wizard accessible within the Dimension Designer instead.
Dimension Designer
After you complete the Dimension Wizard, the Dimension Designer opens for the newly created dimension, as shown in Figure 14. On the left side of the screen is the Attributes pane where you see a tree view of the dimension and its attributes. At the top of the tree, an icon with three arrows radiating from a common point identifies the dimension node. Below this node are several attributes corresponding to the selections in the Dimension Wizard. When you select an object in this tree view, the associated properties for the selected object are displayed in the Properties window, which appears in the lower right corner of the screen. Much of your work to fine-tune the dimension design involves configuring properties for the dimension and its attributes.
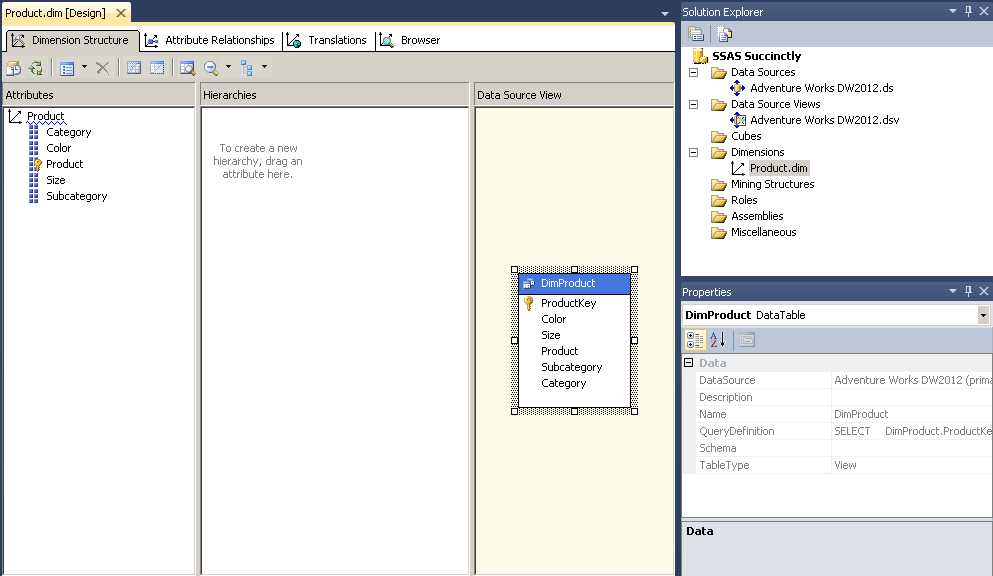
- Dimension Designer
To the right of the Attributes pane is the Hierarchies pane. It is always initially empty because you must manually add each hierarchy, which is explained later in this chapter. The hierarchies that you add are called user-defined hierarchies to distinguish them from the attribute hierarchies. User-defined hierarchies can have multiple levels and are useful for helping users navigate from summarized to detailed information. By contrast, each attribute hierarchy contains an “All” level and a leaf level only. These levels are used for simple groupings when browsing data in a cube.
The third pane in the Dimension Designer is the Data Source View pane. Here you see a subset of the data source view, showing only the table or tables used to create the dimension.
Tip: If you decide later to add more attributes to the dimension, you can drag each attribute from the Data Source View pane into the Attributes pane to add it to the dimension.
The Solution Explorer in the top right corner always displays the files in your project. After you complete the Dimension Wizard, a new file with the DIM extensions is added to the project. If you later close the Dimension Designer for the current dimension, you can double-click the file name in the Solution Explorer to reopen it. As you add other dimensions to the project, each dimension has its own file in the Dimensions folder.
Attributes
Attributes are always associated with one or more columns in the DSV. Let’s take a closer look at what this means by browsing an attribute in the Browser, which is the fourth tab of the Dimension Designer in SSDT. Before you can browse a dimension’s attributes, you must first deploy the project to send the dimension definition to the Analysis Services server and load the dimension object with data. To do this, click Deploy on the Build menu. After deployment is complete, you can select one attribute at a time in the Hierarchy drop-down list at the top of the page and then expand the All level to view the contents of the selected attribute, as shown in Figure 15.
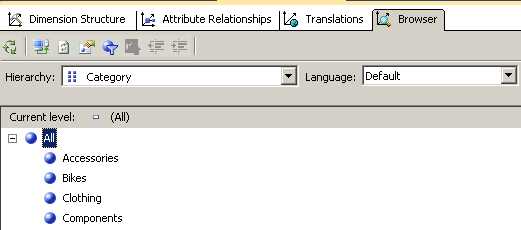
- Dimension Designer
Each label in this list for the selected attribute is a member, including the All member at the top of the list. There is one member in the attribute for each distinct value in the key column that you specified in the Dimension Wizard, with the All member as the one exception. Analysis Services uses the All member to provide a grand total, or aggregated value, for the members when users browse the cube.
Note: The number of members in the list (excluding the All member) is equal to the number of distinct values in the column specified as the attribute’s Key Column property. The label displayed in the list is set by the column specified as the attribute’s Name Column property.
Attribute Properties
Most of your work to set up a dimension involves configuring attribute properties. Let’s take a closer look at that process now.
When you select an attribute in the Attributes pane, you can view its properties in the Properties window, as shown in Figure 16. In this example, you see the properties for the Product attribute, which is related to the primary key column in the Product table in the DSV. There are many properties available to configure here, but most of them are used for performance optimizations, special case design situations, or changing browsing behavior in a client tool. You can tackle those properties on an as-needed basis. For the first phase of development, you should focus on the properties that you always want to double-check and reconfigure as needed. In particular, review the following properties: KeyColumn, NameColumn, Name, OrderBy, AttributeHierarchyEnabled, and Usage.
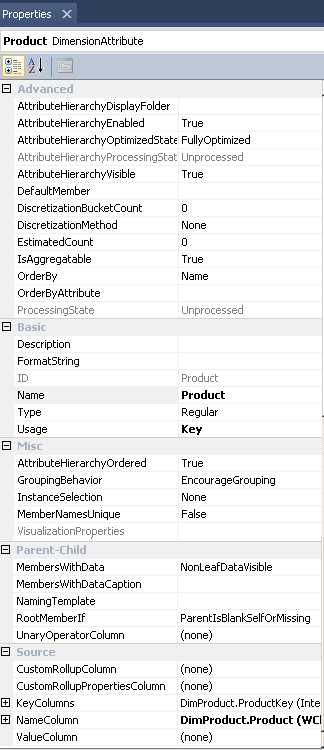
- Attribute Properties
When you create a dimension using the Dimension Wizard, the KeyColumn and NameColumn properties are set in the wizard for the key attribute as described earlier in this chapter. You can use multiple key columns if necessary to uniquely identify an attribute member, but you can specify only one name column. If you need to use multiple columns to provide a name, you must go back to the DSV and concatenate the columns there by creating a named calculation or a named query to produce a single column with the value that you need.
You should next check the Name property of the attribute. It should be a user-friendly name. That is, it should be something users recognize and understand. It should be as short as possible, but still meaningful. For example, you might consider changing the Name property for the Product dimension from Product Key to Product to both shorten the name and eliminate confusion for users.
You might also need to change the sort order of members. The default sort order is by name, which means you see an alphabetical listing of members. However, sometimes you need a different sequence. For example, displaying month names in alphabetical order is usually not very helpful. You can order a list of attribute members by name, by key value, or even by some other attribute available in the same dimension. To do this, you must adjust the OrderBy property accordingly. If you choose to sort by an alternate attribute, you must also specify a value for the OrderByAttribute property.
Whenever you have attribute that you use just for sorting, you might not want it to be visible to users. When you want to use an attribute for sorting only, you can disable browsing altogether by setting the AttributeHierarchyEnabled property to False.
Usage is an important attribute property, but probably not one you need to change because it’s usually auto-detected properly. There can be only one attribute that has a Usage value of Key, and that should be the attribute that is associated with the column identified as the primary key in the DSV. Otherwise, the value for this property should be Regular, unless you’re working with a parent-child hierarchy, which I’ll explain later in this chapter.
Unknown Member
Sometimes the data source for a fact table’s transaction or event data contains a null or invalid value in one of the foreign key columns for a dimension. By default, an attempt to process a cube associated with a fact table that has a data quality problem such as this results in an error. However, there might be a business case for which it is preferable to process the cube with a placeholder for the missing or invalid dimension reference. That way, the cube is processed successfully and all fact data is visible in the cube. To accommodate this scenario, enable the Unknown member for a dimension by selecting the dimension (the top node) in the Attributes pane and setting the UnknownMember property to Visible, as shown in Figure 17.

- UnknownMember Property
There are four possible values for the UnknownMember property:
- Visible. A new member labeled Unknown is displayed in the list of members for each attribute. An invalid fact record does not cause the cube processing to fail, and the fact record’s measures are associated with the Unknown member, as shown in Figure 18.

- Invalid Fact Record Assigned to Visible Unknown Member
Note: If you decide to set the UnknownMember property to Visible, but prefer a different name, set the UnknownMemberName property for the dimension. For example, you might set the UnknownMemberName property to Unknown Territory. Because it is a dimension property, the same name appears in each attribute and user-defined hierarchy in the dimension.
Note: Configuring the UnknownMember property is not sufficient to ignore errors during cube processing if the dimension key is null or invalid. For more information regarding the options you have for managing error handling, see the Data Integrity Controls section of Handling Data Integrity Issues in Analysis Services 2005. Although this information was written for an earlier version of Analysis Services, it remains pertinent to later versions.
- Hidden. With this setting, an invalid fact record does not cause the cube process to fail. However, although the grand total for the dimension correctly displays the aggregate value for the associated measures, the Unknown member does not appear with other members when browsing the cube. Users might be confused when the values for visible members do not match the aggregated value, as shown in Figure 19.

- Invalid Fact Record Assigned to Hidden Unknown Member
- None. An invalid fact record causes cube processing to fail. The problem must be resolved to complete cube processing successfully.

- Processing Error Caused by Invalid Fact Record
- AutomaticNull. This option applies only to Tabular mode in Analysis Services 2012.
Design Warnings
You can avoid common problems in Analysis Services by reviewing and responding to design warnings that are displayed in the Dimension Designer and Cube Designer. A warning does not prevent the processing of a dimension or cube, but might result in less optimal performance or a less-than-ideal user experience if ignored. When you see a blue wavy underline in the designer, hover the pointer over the underscore to view the text of the warning, as shown in Figure 21.

- Design Warning in the Attributes Pane of the Dimension Designer
The steps you must perform to resolve the warning depend on the specific warning. Unfortunately, there is no guidance built into SSDT to help you. However, you can refer to Design Warning Rules at MSDN to locate the warning message and view the corresponding recommendation. For example, to resolve the warning in Figure 21, you add a user-defined hierarchy as described in the next section of this chapter. Sometimes the resolution you implement generates new warnings. Just continue to work through each warning until all warnings are cleared.
Note: The Design Warning Rules link in the previous paragraph is specific to SQL Server 2008 R2, but is also applicable to SQL Server 2012 and SQL Server 2008.
There might be circumstances in which you prefer to ignore a warning. For example, there may be times when you choose to leave attributes corresponding to hierarchy levels in a visible state rather than hide them according to the “Avoid visible attribute hierarchies for attributes used as levels in user-defined hierarchies” warning. You can do this to give greater flexibility to users for working with either attributes or user-defined hierarchies in a pivot table, rather than restricting them to the user-defined hierarchy only (but only after reviewing the options with the users). In that case, you can choose one of the following options:
- Dismiss a warning for an individual occurrence. In the Error List window, which you can open from the View menu if it’s not visible, right-click the best practice warning, and then select Dismiss on the submenu, as shown in Figure 22. In the Dismiss Warning dialog box, you have the option to enter a comment. After you dismiss the warning, the blue wavy underline disappears.

- Dismissal of Best Practice Warning for a Dimension
- Dismiss a warning globally for all occurrences. On the Database menu, select Edit Database, and then click the Warnings tab of the Database Designer, as shown in Figure 23. Here you can view warnings by type (such as Dimension Design), clear the check box to the left of a warning to dismiss it globally, and optionally type an explanation in the Comments column.

- Global and Dismissed Best Practice Warnings
Tip: If you want to enable a previously dismissed instance warning, select it in the Dismissed Warnings list at the bottom of the Warnings page of the Database Designer, and then click Re-enable.
User-Defined Hierarchies
Users can always arrange attributes any way they like in a cube browser, but it’s usually helpful to add a user-defined hierarchy for them to use. User-defined hierarchies are never automatically detected; you must add them manually. This type of hierarchy structure is called a user-defined hierarchy because as an Analysis Services developer, you are defining the hierarchy, in contrast to automatic generation of an attribute hierarchy by Analysis Services when you add an attribute to a dimension.
To create a hierarchy, drag attributes to the Hierarchies pane in the Dimension Designer. As you add each attribute, place it above or below an existing level to achieve the desired hierarchical order, as shown in Figure 24. You should also rename the hierarchy to provide a more user-friendly label.

- User-Defined Hierarchy
When the user selects a hierarchy in a browser, the user can drill easily from one level to the next. For example, in an Excel pivot table, the user can expand a member at the Category level to show members on the Subcategory level. Then, the user can select a member of the Subcategory level to see members in the Product level, as shown in Figure 25.

- Members in a User-Defined Hierarchy
Natural Hierarchies
The addition of a hierarchy to a dimension not only helps users navigate data more efficiently from summary to detail data, but it can also improve query performance when a hierarchy contains a natural one-to-many relationship between each level in the hierarchy from top to bottom, such as exists between Category, Subcategory, and Product. This type of structure is commonly known as a natural hierarchy.
When a natural hierarchy exists between levels, Analysis Services can store data more efficiently and can also build aggregations to pre-compute data in the cube. When a user asks for sales by category, for example, the server doesn’t have to scan through each transaction first and then group by category. Instead, the category totals are available either directly or indirectly, and the query results return from Analysis Services much faster than they would if Analysis Services were required to calculate the sum based on the data at the transaction level. I explain more about aggregations in Chapter 4, “Developing cubes.”
Tip: You might decide to allow users to access an attribute exclusively from within a hierarchy. This is useful particularly when you have a very large set of members in an attribute, such as customers. In that case, it’s usually preferable to require the users to start by adding a hierarchy to the pivot table and then filtering down to a smaller set, such as customers in a particular city. To do this, set the AttributeHierarchyVisible property to false for each attribute. The attribute will be visible within a user-defined hierarchy, but will not appear in the dimension’s list of attributes as an independent attribute hierarchy.
Unnatural Hierarchies
You can also create an unnatural hierarchy in Analysis Services. The purpose of an unnatural hierarchy is to provide a predefined grouping of attributes. For example, in the Product dimension, you might have users who frequently analyze product sales by color and by size. You can set up a hierarchy with the color and size attributes, and then users can use this hierarchy in the browser to drill from color to size, as shown in Figure 26. In a natural hierarchy, a member in a lower level can be associated with only one member in its parent level, but in an unnatural hierarchy, users see sizes like L and M associated with both the Multi and White colors.

- Unnatural Hierarchy
In an unnatural hierarchy, there is no query performance benefit. It’s simply a convenience for common groupings users work with frequently and completely optional.
Attribute Relationships
When you have a user-defined hierarchy in a dimension, it’s important to properly define attribute relationships. Attribute relationships are used to ensure that aggregations work efficiently and totals are calculated correctly. When you first create a hierarchy commonly found in the Date dimension, each upper level of the hierarchy has a direct relationship with the dimension’s key attribute. You can review these relationships on the Attribute Relationships tab of the Dimension Designer as shown in Figure 27.

- Default Attribute Relationships
In some cases, if attribute relationships are not defined correctly, it’s possible for totals in the cube to be calculated incorrectly. However, a greater risk is the introduction of a potential performance bottleneck. For example, let’s say that aggregations are available for Month, but not for Quarter or for Year. When a user requests sales by quarter, Analysis Services must use the transaction-level data in the fact table to calculate the sales by quarter. On the other hand, if proper relationships exist between attributes, Analysis Services uses values already available for lower-level attributes to compute totals for higher-level attributes and usually calculates these values much faster. Even without aggregations, query performance benefits from attribute relationships because they help Analysis Services narrow down the amount of cube space that has to be scanned in order to retrieve results for a query.
To correct attribute relationships on the Attribute Relationships tab of the Dimension Designer, drag a lower-level attribute to the attribute on the level above it. For example, drag Month to Quarter, and then Quarter to Calendar Year. Typically, you don’t need to delete an erroneous relationship first, but if necessary you can select the arrow representing the relationship between two attributes and press Delete to remove it. A correctly defined set of attribute relationships for the Date dimension is shown in Figure 28.
![]()
- Correct Attribute Relationships
Although the fact table in the data source stores a date, Analysis Services can calculate month, quarter, or year by rolling up, or aggregating, values by following the chain of attribute relationships from left to right. Attribute relationships represent many-to-one relationships moving from left to right. In other words, there are many dates associated with a single month, and many months associated with a single quarter, and many quarters for a single year.
Attribute relationships can also have either flexible or rigid relationship types, each of which has a different effect on dimension processing. By default, an attribute relationship type is flexible, as indicated by a white arrowhead. To change the relationship type, right-click the arrow between two attributes, point to Relationship Type, and select one of the following relationship types, as applicable:
- Flexible. A flexible attribute relationship type allows you to update your source dimension table by reassigning a member from one parent to another. For example, let’s say you decide to break the Bikes category down into two categories: Road Bikes and Off-Road Bikes, and you assign the Mountain Bikes subcategory to Off-Road Bikes, add a new Cyclocross subcategory to Off-Road Bikes, and assign Road Bikes and Touring Bikes to the Road Bikes category. When the Category and Subcategory attributes have a flexible relationship type, you can make this type of change to reassign members from one parent (Bikes) to another (Off-Road Bikes) easily by processing the dimension as an update as described in Chapter 6, “Managing Analysis Services databases.” An update process does not require you to process the cube, which means the processing occurs very quickly. The downside of this approach is that any aggregations that were built are removed from the database, which in turn means queries slow down until you can take the time to process aggregations later.
- Rigid. A rigid relationship type allows you to perform an update process on the dimension without losing aggregations. However, if the dimension table is updated to reflect a change where a member moves from one parent to another, an error is raised and stops processing. Therefore, set rigid relationships only when you know that data is not likely to be rearranged later. For example, in a Date dimension, January 1 always has the month of January as a parent and will not be assigned later to a different month, such as August.
Parent-Child Hierarchy
Another type of hierarchy that you might need to create in Analysis Services is a parent-child hierarchy. In this type of hierarchy, the levels of the hierarchy come from the built-in relationships found in a self-referencing table, like the DimEmployee table in the AdventureWorksDW2012 database. In this table, the ParentEmployeeKey column has a foreign key relationship to the primary key column, EmployeeKey, as shown in Figure 29.
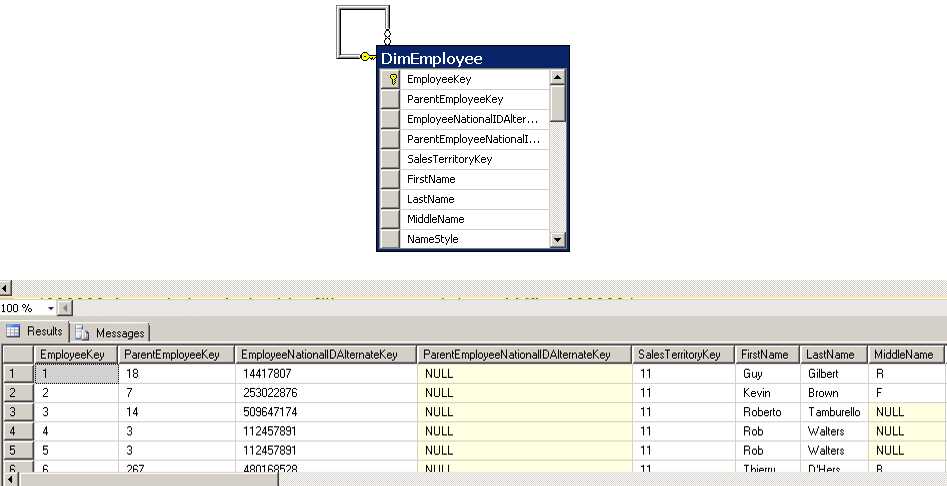
- Correct Attribute Relationships
The benefit of this structure is that there is no need to know in advance how many levels exist in the hierarchy, nor must you create each level explicitly in the dimension. This type of structure is very flexible and used most often for organizational charts, a chart of accounts in a financial application, or a bill of materials list in a manufacturing application. The self-referencing join in the table is automatically detected in the DSV and an attribute with the foreign key relationship is displayed in the Attribute pane with a special icon, as shown in Figure 30, to indicate its Usage property is set to Parent.

- Parent Attribute
Note: Each dimension can have only one attribute with the Usage property set to Parent.
Another benefit of a parent-child hierarchy is the ability to store data in the fact table for non-leaf members. For example, in the FactResellerSales table, there are sales transactions for sales people like Jae Pak and Linda Mitchell, but there are also transactions associated with their respective managers, Amy Alberts, and Stephen Jiang.
You use the parent attribute’s MembersWithData property to control whether the fact table data for the managers is visible. By default, this property is set to True, which means the sales data for managers is visible in the cube, as shown in Figure 31.

- Parent Members with Data
You can use the MembersWithDataCaption property to make the distinction between the managers’ sales and the subtotal of sales for the managers’ employees and the manager. Use an asterisk as a placeholder for the member name and append a string to include in the caption, as shown in Figure 32.

- Captions for Parent Members with Data
An alternate solution is to hide the data by changing the MembersWithData property to NonLeafDataHidden. In that case, though, the subtotals by manager are still correct and the manager’s sales can be inferred, as shown in Figure 33. Therefore, this technique is not a security measure, but simply an alternate way to represent data when fact records exist for non-leaf dimension members.

- Parent Member Data Missing from Query Results
Attribute Types
In the Dimension Wizard, you have the option to assign an Attribute Type to each attribute. In most cases, the default value of Regular is sufficient. However, to support specific business scenarios, you can assign a different attribute type.
The most common reason to change attribute types from the default is to identify date-related attributes. Some client tools can perform calculations based on dates when date attributes are identifiable. In addition, certain MDX functions such as QTD() or YTD() require attributes to have attribute types of Quarters or Years, respectively. You might also change attribute types if you have an Account dimension and need to identify accounts as assets, liabilities, revenue, and expenses to instruct Analysis Services how to properly aggregate values by account type. Some client tools recognize geographical attribute types such as city or country to support the display of cube values in a map.
You can change the Attribute Type value in the Dimension Wizard or by setting the Type property in the Properties window for each attribute. Either of these methods can be a bit tedious, so a third option is to use the Business Intelligence Wizard, which you launch by clicking the first button in the Dimension Designer toolbar. You then select the Define Dimension Intelligence option on the Choose Enhancement page of the wizard and the Dimension Type on the Define Dimension Intelligence page. On this latter page, you select the check box for each type of attribute that exists in the dimension and map a standard attribute type to your dimension’s attribute, as shown in Figure 34. When you close the wizard, the Type property of each attribute you mapped is updated to reflect the new assignment.

- Attribute Type Mapping
Translations
If you are required to support multiple languages to accommodate a variety of users, you can configure translations for the dimension. Although this feature works transparently if the front-end tool supports it, Analysis Services does not automatically perform translations. You must include the translation for each member name in the dimension’s relational source. The source must contain one column for each language and each attribute that you want to translate, as shown in Figure 35.

- Translation Columns in a Dimension Table
Then you have two steps to perform to configure a dimension to use translations. First, open the Translations tab of the Dimension Designer and click the third button in the toolbar labeled New Translation. You must then type the caption to display for each attribute, as shown in Figure 36.

- Translation Captions
Second, click the cell at the intersection of the translation and the dimension object, such as the cell in the Attributes list containing the caption “Mes”, and then click the ellipsis button to open the Attribute Data Translation dialog box for the attribute. In this dialog box, you map the attribute to the column containing the applicable translation, as shown in Figure 37. In this way, you can add as many languages as you need to support in your Analysis Services database.

- Translation Column Mapping
- Seamless integration with SSAS cubes
- Flexible data access through MDX or REST APIs
- Powerful data analysis with multidimensional slicing and dicing
- Real-time insights for informed decision-making