
SQL on Azure Succinctly®

CHAPTER 8
Performance Considerations for Azure SQL Database
In the previous chapters you learned, how easy it is to setup, provision, manage and migrate to Azure SQL Database. Reduced setup time, ease of management, on demand capacity scaling, reduced cost and administrative overhead are some of the biggest motivation for using azure sql database as a backend for your application. However Performance and Security are two important aspects which actually drives the business decision for choosing a database platform. In this chapter, you will learn and understand the performance monitoring tools and considerations for running your database workload in azure sql database.
Choosing the right Service tier for your workload
In an on premise setup of SQL Server, you would choose the right hardware, memory and storage to ensure you get a predictable performance. When using SQL on Azure VM (IaaS) you would choose the right VM size and storage (premium or standard) to ensure you get a predictable performance. Similarly when using Azure SQL Database you need to choose the right service tier for your workload to ensure predictable performance for your workload. Service tiers are therefore often referred as performance tiers for Azure SQL Database.
Following table can be useful as a decision matrix for choosing the right Servicer Tier for your workload.
Table 13: Choosing the right Service tier for your workload
Basic | Standard | Premium | |
Database Size | < 2 GB | < 250 GB | < 500 GB |
Concurrency | Single User | Small to medium | Medium to Large |
Response time | High | Medium | Low |
Best for | Getting Started or Single User development on Azure SQL Database | For servicing websites with moderate traffic or data warehousing workload with moderate reporting traffic | Heavy concurrent workload with CPU, memory and low latency demand |
As discussed earlier, the relative transaction performance supported by each service tier is measured in terms of DTUs and hence while monitoring Azure SQL Database, one of the important metrics to monitor is DTU percentage. The DTU percentage metric gives the DTU for the current workload as a percentage of the maximum DTU supported by that service tier of the database. Hence if the DTU percentage stays consistently to 100, it means it is time to move or upgrade to next service tier. The following section explain where you can see or monitor the performance metrics for Azure SQL Database.
Monitoring Performance metrics for Azure SQL Database
In on-premise SQL Server instance as well as SQL Server on Azure VM (IaaS), we use performance monitor data, Dynamic Management Views (DMVs) and Extended Events to monitor the performance metrics for SQL Server instances. Performance monitor (perfmon) counters are primarily useful for monitoring resource utilization on the server and that consumed by SQL Server while DMVs are useful to track wait statistics, user session details etc while extended events sessions are like trace recorder running on the SQL Instance to capture various events or activity defined in the XEvents session.
On the similar lines, Azure SQL Database allows you to monitor the database performance using performance monitor data, dynamic management views (DMVs) and Extended Events (introduced in V12). The difference here is you do not need to configure or manage the performance data collections since the data is continuously captured & managed by default. You can view the performance monitor data from Azure portal by following the steps mentioned below
Monitoring Resource Usage using Performance Charts
- Log on to Azure Management Portal and Click Browse all -> SQL databases -> Select the database you want to monitor -> Click on Edit on the Monitoring section as shown in figure

Figure 23: Monitoring Performance Metrics for Azure SQL Database
- The Edit Chart blade, allows you to select or deselect various counters which are collected by default.
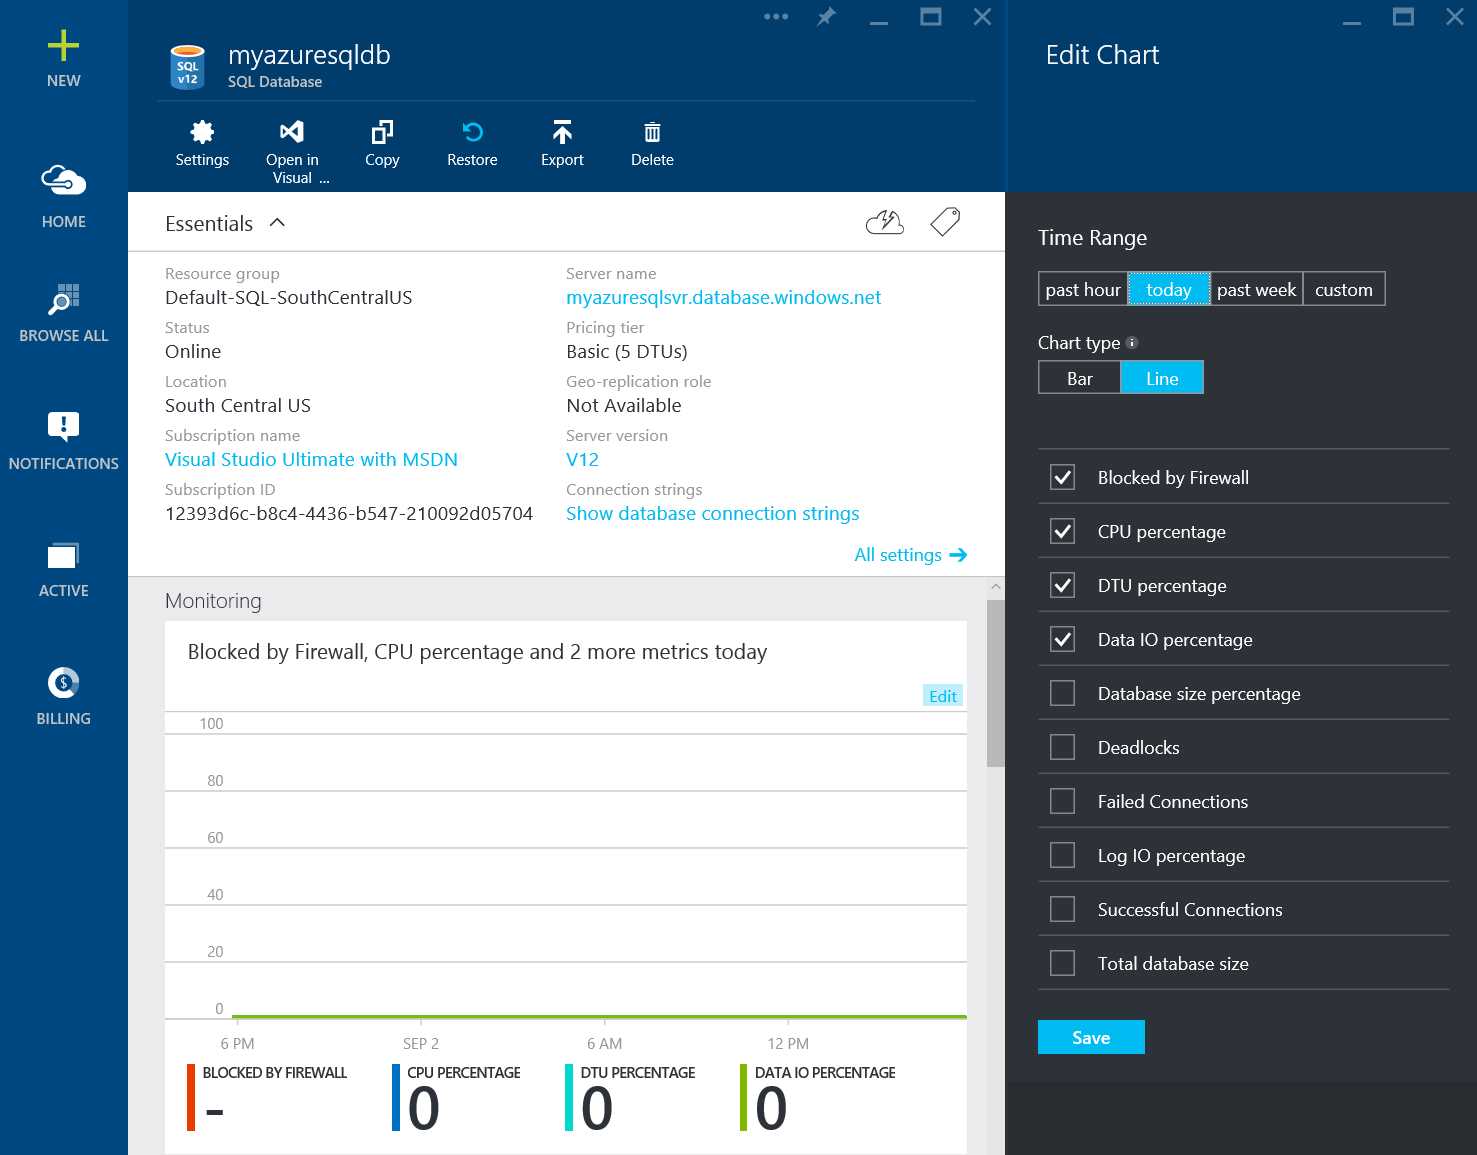
Figure 24: Edit Performance Monitoring Chart
These performance metrics are self-explanatory. As discussed earlier, DTU percentage metrics tells you the DTU of the current database workload as a percentage of max DTU supported by that service tier and hence is an important metric to support the decision of moving to next higher service tier. Similarly Database size percentage provides the current size of the database as a percent of the max database size supported by that service tier which is another important metrics to decide whether the workload should be moved to next service tier. In general, if you see CPU percentage, DTU percentage, Data IO percentage, Log IO percentage and Database size percentage or any of these counters as 100 consistently, you should consider moving to next higher tier so that the throughput of the database is not throttled by any of the tier limitations.
Monitoring Resource Usage using DMVs
You can also the access the resource usage data using sys.resource_stats dynamic Management view which provides the same information as provided by the performance monitoring charts
The following query provides the resource utilization for database myazuresqldb for past 7 days.
Code Listing 26: Monitoring Resource Usage using DMV
SELECT * FROM sys.resource_stats WHERE database_name = 'myazuresqldb' AND start_time > DATEADD(day, -7, GETDATE()) ORDER BY start_time DESC; |
In order to evaluate how well your workload fits into the performance level, you have to drill down at each different aspect of the resource metrics: CPU, reads, write, number of workers, and number of sessions. Here is a revised query using sys.resource_stats to report the average as well as maximum values of these resource metrics.
Code Listing 27: Monitoring Resource Usage using DMV
SELECT avg(avg_cpu_percent) AS 'Average CPU Utilization In Percent', max(avg_cpu_percent) AS 'Maximum CPU Utilization In Percent', avg(avg_physical_data_read_percent) AS 'Average Physical Data Read Utilization In Percent', max(avg_physical_data_read_percent) AS 'Maximum Physical Data Read Utilization In Percent', avg(avg_log_write_percent) AS 'Average Log Write Utilization In Percent', max(avg_log_write_percent) AS 'Maximum Log Write Utilization In Percent', avg(active_session_count) AS 'Average # of Sessions', max(active_session_count) AS 'Maximum # of Sessions', avg(active_worker_count) AS 'Average # of Workers', max(active_worker_count) AS 'Maximum # of Workers' FROM sys.resource_stats WHERE database_name = 'myazuresqldb' AND start_time > DATEADD(day, -7, GETDATE()); |
By monitoring the average CPU, IO trend over a period of time, you can further decide whether it is time to move to the next service tier.
Scaling up or down in Azure SQL Database
Before moving between service tiers or performance levels, make sure you have available quota on the server. If you need additional quota, you will have to contact Microsoft customer support to be able to scale up on a server.
You can change the service tier of Azure SQL Database at any time by following the steps mentioned in this section
- Log on to Azure Management Portal and Click Browse all -> SQL databases -> Select the database whose service tier you would like to change -> Click on the Pricing Tier on the database blade as shown in the figure

Figure 25: Changing the Service Tier of Azure SQL Database
- You can select the Service Tier to which you would like to move and click select, for the database to be upgraded to new service tier.
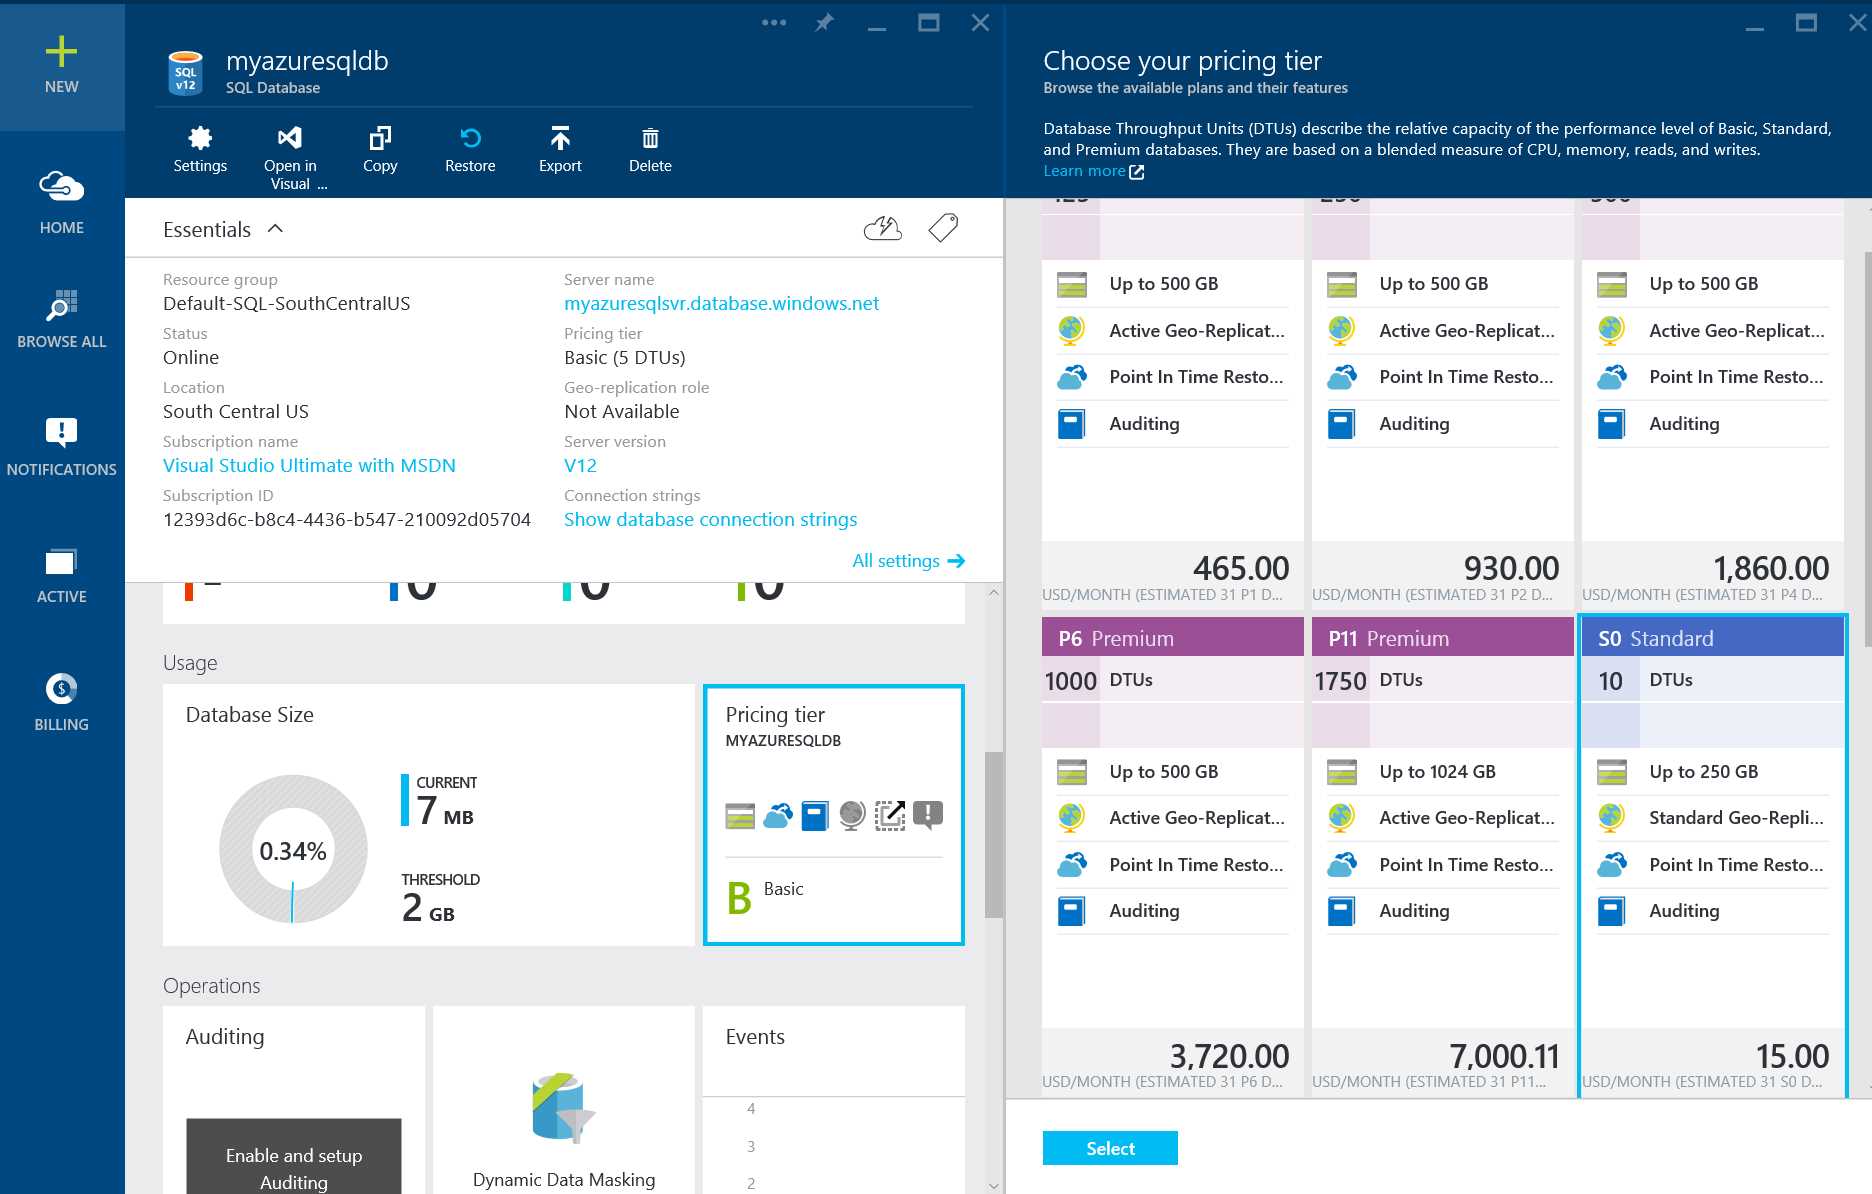
Figure 26: Changing the Service Tier of Azure SQL Database
Changing the Service Tier of the database is an online operation but should be performed during off business hours by stopping the application to expedite the upgrade operation. The service tier of the database can also be changed using Set-AzureSqlDatabase PowerShell Cmdlet.
Monitoring and Troubleshooting Bad Index Design
A common problem in OLTP database performance is related to bad index design for the database. Often database schemas are designed and shipped without testing at scale (either in load or in data volume). Unfortunately, the performance of a query plan may be acceptable at small scale but may degrade substantially when faced with production-level data volumes. The most common source of this issue is due to the lack of appropriate indexes to satisfy filters or other restrictions in a query. Often, this manifests as a table scan when an index seek could suffice.
With bad index design for the database, moving to the higher service tier can alleviate the problem a bit but as the database size continues to grow, the performance of the queries will continue to degrade and hence moving to next performance tier may not help solve the performance issue.
Azure SQL Database contains missing indexes DMV similar to on premise SQL Server to help database administrators find and fix common missing index conditions. This allows a database administrator to quickly guess which index changes might improve the overall workload cost for a given database and its real workload.
The following query can be used to evaluate potential missing indexes.
Code Listing 28: Monitoring Missing Indexes using DMV
SELECT CONVERT (varchar, getdate(), 126) AS runtime, mig.index_group_handle, mid.index_handle, CONVERT (decimal (28,1), migs.avg_total_user_cost * migs.avg_user_impact * (migs.user_seeks + migs.user_scans)) AS improvement_measure, 'CREATE INDEX missing_index_' + CONVERT (varchar, mig.index_group_handle) + '_' + CONVERT (varchar, mid.index_handle) + ' ON ' + mid.statement + ' (' + ISNULL (mid.equality_columns,'') + CASE WHEN mid.equality_columns IS NOT NULL AND mid.inequality_columns IS NOT NULL THEN ',' ELSE '' END + ISNULL (mid.inequality_columns, '') + ')' + ISNULL (' INCLUDE (' + mid.included_columns + ')', '') AS create_index_statement, migs.*, mid.database_id, mid.[object_id] FROM sys.dm_db_missing_index_groups AS mig INNER JOIN sys.dm_db_missing_index_group_stats AS migs ON migs.group_handle = mig.index_group_handle INNER JOIN sys.dm_db_missing_index_details AS mid ON mig.index_handle = mid.index_handle ORDER BY migs.avg_total_user_cost * migs.avg_user_impact * (migs.user_seeks + migs.user_scans) DESC |
The following query can be used to find the indexes which are updated but never used for seeks, scans or lookups. The outcome of this query are indexes, which are potential candidate to be dropped since they are overhead for DML operations and not helping at all to expedite the querying of the table.
Code Listing 29: Monitoring unused Indexes using DMV
SELECT DB_NAME() AS DatabaseName, OBJECT_NAME(i.OBJECT_ID) AS TableName , i.name AS IndexName, s.user_updates AS IndexUserUpdates
FROM sys.indexes i LEFT JOIN sys.dm_db_index_usage_stats s ON s.OBJECT_ID = i.OBJECT_ID AND i.index_id = s.index_id AND s.database_id = DB_ID() WHERE OBJECTPROPERTY(i.OBJECT_ID, 'IsIndexable') = 1 -- index_usage_stats has no reference to this index (not being used) AND s.index_id IS NULL -- index is being updated, but not used by seeks/scans/lookups OR ( s.user_updates > 0 AND s.user_seeks = 0 AND s.user_scans = 0 AND s.user_lookups = 0 ) ORDER BY OBJECT_NAME(i.OBJECT_ID) ASC |
Besides the DMV, the Microsoft Product Team has come up with Index Advisor which is currently under Preview at the time of writing this book. Index advisor monitors and analyzes the queries hitting the database continuously and recommends indexes which will have maximum positive performance impact. It can automatically create the index for you and continue to monitor the newly created indexes and if the newly created indexes do not have significant impact it reverts back and drops the indexes automatically. The feature is still preview in Azure SQL Database V12, you can find further details on this feature in the following article
https://azure.microsoft.com/en-us/documentation/articles/sql-database-index-advisor/
Query Tuning using Query Store
Another new feature which is scheduled to be released in box version of SQL 2016 and which is currently in preview in Azure SQL Database V12 is Query store. As your database goes in production and the real-world data starts populating the database, the queries no longer behave the same as they behave in development or testing. When that happens it takes long time to identify & troubleshoot the queries which are performing badly due to changes in query plans since you might not have previous version of the query plan stored in the database. This problem is solved by query store. Query Store feature acts as an airline flight recorder storing the historical data of the queries, query plans allowing you to identify and understand the changes in the query behavior and query plan over a period of time.
Query Store feature is a database scoped feature and can be turned ON at the database level. You can limit the data collected by specifying the max limit for the data capture or sampling frequency. SQL 2016 Management Studio allows you to see the analysis and reporting of query store plans and objects. This allows you to identify top resource consuming queries or slow performing queries over a period of data capture. If your workload contains a query that is being executed with different plans and variable performance, you can use Query Store to force SQL Server to always use the optimal plan in future executions. This is particularly useful for troubleshooting parameter sniffing scenarios where stored procedure or a parameterized query uses different plan for different values of parameter and if the bad plan gets cached in the SQL Server cachestore first, all the subsequent execution of the stored procedure or query will use the bad plan and perform slow. Using Query Store you can force the query to use the optimal plan & avoid bad plan.
Since the feature is still in preview, it is difficult to document the steps to set up and analyze query store since the feature might change as the product develops but you can find the implementation steps on query store in the following article
http://azure.microsoft.com/en-us/blog/query-store-a-flight-data-recorder-for-your-database/
Cross-Database Sharding or Scaling out with Azure SQL Database
If you believe the resource and capacity limits provided by the highest premium service tier in Azure SQL Database may not be sufficient to handle your workload due to high demands from the business or users, you can consider scaling out or a technique commonly known as cross-database sharding. While using cross-database sharding technique, you can split the data on a single dimension across multiple databases. This is possible because most OLTP applications perform transactions that only apply to a single row or a small group of rows within the schema. For example, if a database contains customer, order, and order details, then this data could be split into multiple databases by grouping a customer with the related order and order detail information into a single database. The application would split different customers across databases, effectively spreading the load across multiple databases. This allows customers not only to avoid the maximum database size limit, but it also allows Azure SQL Database to process workloads that are significantly larger than the limits of the different performance levels so long as each individual database fits into its DTU.
While database sharding does not reduce the aggregate resource capacity for a solution, this technique is highly effective to support very large solutions spread over multiple databases and allows for each database to run in a different performance level to support very large "effective" databases with high resource requirements.
Microsoft recently released the Elastic Database tools for Azure SQL Database, a client library and management tools for creating sharded database solutions on Azure Database. The following article provides more details on getting started with the elastic database tools for Azure SQL Database
http://azure.microsoft.com/documentation/articles/sql-database-elastic-scale-get-started/
- 1800+ high-performance UI components.
- Includes popular controls such as Grid, Chart, Scheduler, and more.
- 24x5 unlimited support by developers.