
SQL Server for C# Developers Succinctly®

CHAPTER 8
Interception, Locking, Dynamic Management Views
In this chapter we'll look at three relatively advanced topics: customizing default behaviors by intercepting SQL execution from C# code, the issues around SQL locking, and performance tuning using Dynamic Management Views.
Interception
SQL interception using C# is not easy, and is probably best avoided. It does give you some low-level control over the generated SQL and additional actions EF should take when it’s executing, or has executed, queries. Interception is based around a couple of interfaces, most notably System.Data.Entity.Infrastructure.Interception.IDbInterceptor.
There are different interceptors for different use cases, such as executing queries (IDbCommandInterceptor), working with transactions (IDbTransactionInterceptor), and connections (IDbConnectionInterceptor). For our case, we need the IDbCommandInterceptor, but we derive from the base class DbCommandInterceptor (which implements IDbCommandInterceptor).
As you can see, each method (SomethingExecuting or SomethingExecuted) gets a DbCommand, which can be manipulated, and a DbCommandInterceptionContext. Now we can simply concatenate “ OPTION (RECOMPILE)” to any SELECT query.
Code Listing 75: RecompileInterceptor
public class RecompileInterceptor : DbCommandInterceptor { public override void ReaderExecuting(DbCommand command, DbCommandInterceptionContext<DbDataReader> interceptionContext) { base.ReaderExecuting(command, interceptionContext); AddOptionRecompile(command, interceptionContext); } public override void NonQueryExecuting(DbCommand command, DbCommandInterceptionContext<int> interceptionContext) { base.NonQueryExecuting(command, interceptionContext); AddOptionRecompile(command, interceptionContext); } public override void ScalarExecuting(DbCommand command, DbCommandInterceptionContext<object> interceptionContext) { base.ScalarExecuting(command, interceptionContext); AddOptionRecompile(command, interceptionContext); } private void AddOptionRecompile<T>(DbCommand command, DbCommandInterceptionContext<T> interceptionContext) { // DbContexts.Any indicates the query is not EF overhead. if (interceptionContext.DbContexts.Any() && command.CommandText.StartsWith("SELECT", StringComparison.OrdinalIgnoreCase)) { command.CommandText += " OPTION(RECOMPILE)"; } } } |
To use an IDbInterceptor, we can use the DbInterception class. Unfortunately, this class registers IDbInterceptors globally, so once registered, an interceptor will be used for every query in your entire application (including other threads). You can, of course, also unregister them.
Code Listing 76: Add an interceptor
RecompileInterceptor interceptor = new RecompileInterceptor(); DbInterception.Add(interceptor); using (CodeFirstContext context = new CodeFirstContext()) { context.Database.Log = Console.Write; context.People.Where(p => p.GenderId == 1).ToList(); } DbInterception.Remove(interceptor); Console.ReadKey(); |
Interceptors are powerful tools. They can be used for logging, additional security, canceling queries, or altering queries, among other things.
Locking and deadlocks
Another issue you may be facing when queries run slowly is locking. I’ve been in situations where queries such as SELECT Field FROM Table WHERE Id = X were running very slowly. We know now that such queries should be very fast, and that parameter sniffing shouldn’t be a problem since the plan should be the same for every value of X. Chances are this query is simply not running because some other query is blocking access to the specified table. We can easily simulate such scenarios. First of all, I want to remind you that it’s possible to run only parts of a script in a single query window. Simply select the part you want to execute, and execute it.
Let’s create a blocking query. Open up a query window and execute the following.
Code Listing 90: A blocking query
BEGIN TRAN UPDATE Production.Product SET Name = 'Adjustable Racer' WHERE ProductID = 1 |
SQL Server locks the row for ProductID 1. Different kinds of locks exist, and SQL Server will determine the best locking strategy, depending on your query. For example, not specifying a WHERE clause would probably end up in a table lock. While a certain object is locked, rows, pages, tables, and other objects can’t usually access it. Usually a lock is lifted when a transaction completes, but in this case we started a transaction and never committed or rolled back. So the transaction will just stay open and lock this row. Locking is not a bad thing, though; it prevents other processes from querying data that is not committed yet, preventing dirty reads.
Open up a new window and execute the following query.
Code Listing 91: A blocked query
SELECT * FROM Production.Product WHERE ProductID = 1 |
You will notice this query will start executing and simply never complete. It’s actually waiting for our first query to complete.
There are a few fixes here. First of all, we should examine why our first query is taking so long to complete and see if we can rewrite it so it finishes sooner. Second, we could set our TRANSACTION ISOLATION LEVEL to (READ COMMITTED) SNAPSHOT. This means that whenever SQL Server locks a resource, it makes a copy of that resource and then uses the copy when selecting data, so your SELECT queries aren’t blocked, but still return committed data.
SNAPSHOT ISOLATION is not in the scope of this book, but a quick Google search will no doubt give you a lot of resources on the subject. The solution I’m going to show you here is to set the ISOLATION LEVEL of the SELECT query to READ UNCOMMITTED so that it will read uncommitted data. In many cases this is a fine solution, since the chances of dirty reads (reading uncommitted data) are very small, and dirty reads may even be acceptable. If your SELECT query is still running, you can stop it by hitting the Cancel Executing Query button or with Alt + Break. Alternatively, you could return to the UPDATE query window and there execute ROLLBACK TRAN, causing the transaction to end and the SELECT query to finish. If you decide to end your transaction, be sure to start it again for the following example.
So, assuming you have a lock on ProductID 1, you can tell a SELECT query to do dirty reads by giving it the NOLOCK hint.
Code Listing 77: Dirty reads WITH (NOLOCK)
SELECT * FROM Production.Product WITH (NOLOCK) WHERE ProductID = 1 |
If you have multiple statements and would like to execute them all using dirty reads, you can set your TRANSACTION ISOLATION LEVEL instead.
Code Listing 78: Dirty reads with READ UNCOMMITTED
SET TRANSACTION ISOLATION LEVEL READ UNCOMMITTED SELECT * FROM Production.Product WHERE ProductID = 1 |
Both queries will return instantly, even when your other transaction is still running. However, both queries will return Name Adjustable Racers, which isn’t yet committed. Now, rollback your UPDATE query, and no one will ever be able to get Adjustable Racers ever again.
A connection string usually has a timeout defined (the default is 30 seconds). This means that when a query is started from C# and takes over 30 seconds to complete, or is blocked for at least 30 seconds, you’ll get a TimeoutException.
When one transaction is waiting for another transaction, and then that other transaction requests a resource that is locked by the first transaction, you’re having a deadlock. The concept of deadlocks should be familiar to programmers, as multithreaded applications can run into the same problems.
Let’s fake a deadlock. Open up a query window and execute the following query.
Code Listing 79: A locking query
BEGIN TRAN UPDATE Production.Product SET Name = 'Adjustable Racer' WHERE ProductID = 1 |
Now open up another query window, make it wait for the open transaction, and lock another resource.
Code Listing 80: A locking and waiting query
BEGIN TRAN UPDATE Production.Location SET Name = 'Tool Cribs' WHERE LocationID = 1 SELECT * FROM Production.Product WHERE ProductID = 1 |
Go back to the first window, where the transaction is still open, and request LocationID 1, which is locked.
Code Listing 81: Deadlock ensues
SELECT * FROM Production.Location WHERE LocationID = 1 |
One of the two query windows should now return an error: Msg 1205, Level 13, State 51, Line 7
Transaction (Process ID 54) was deadlocked on lock resources with another process and has been chosen as the deadlock victim. Rerun the transaction.
The transaction of that query is automatically rolled back. In the other window, you can manually execute ROLLBACK TRAN.
You can track locks and deadlocks using the SQL Server Profiler. Open up a new session, unselect all events, and select the Deadlock graph event under Locks. If you repeat the previous steps, you will get an event and a graph. It should look something like as follows.
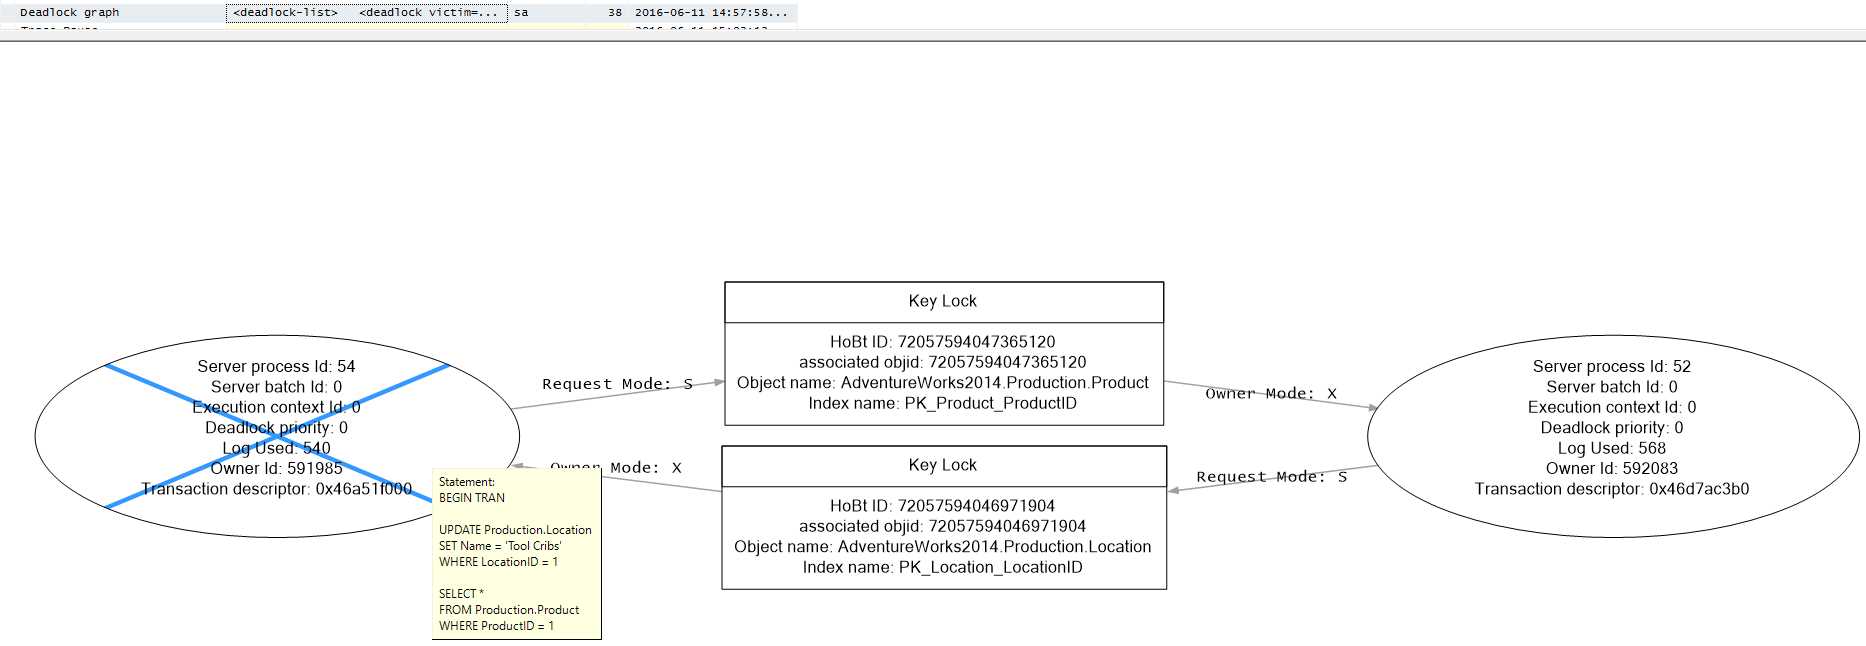
Figure 31: A deadlock graph
The ovals are the queries involved in the deadlock, and the rectangles are the objects that were locked and requested. Deadlock graphs can get very complicated, having tens of ovals and rectangles.
We have already seen two methods of fixing locks that will also fix deadlocks: using SNAPSHOT ISOLATION, and lowering your ISOLATION LEVEL to READ UNCOMMITTED. Another method that will prevent deadlocks is to always access database objects in the same order. Unfortunately, that’s not always easy or even possible. Try keeping transactions short so the chances of (dead) locking are minimized.
Dynamic management views
Knowing a little more on how to get a grip on queries, plans, and other data may be very useful. SQL Server has what are called dynamic management views, or DMVs. The structure of your database, tables, procedures, and practically everything in your database is stored in these views. For example, the following query lists all tables in your database (twice).
Code Listing 82: List all tables
SELECT * FROM sys.tables SELECT * FROM INFORMATION_SCHEMA.TABLES |
You can find the views in the Object Explorer under Views and then System Views. You’ll find views called sys.something and a few INFORMATION_SCHEMA.SOMETHING views. The INFORMATION_SCHEMA views are ISO standards, and using them in your queries should, in theory, make them work in Oracle, MySQL, or any other SQL database that adheres to ISO standards. There are about twenty INFORMATION_SCHEMA DMVs, and (I’m guessing) well over a hundred sys DMVs, so you just go with the sys views, as they have all you need.
Next to the DMVs, there are system SPs and functions, as well. You can find them under Programmability > Stored Procedures > System Stored Procedures > Programmability> Functions > System Functions. You can simply scroll through them and try them out. You’ll probably find you’ve been using many functions already, such as CAST, MAX, and CURRENT_TIMESTAMP.
Let’s move on to the good stuff. We were talking about query plans. There is a view called sys.dm_exec_cached_plans, which has a list of all cached plans. The data in it is a little cryptic, though. In its current form, it’s of no use to us.
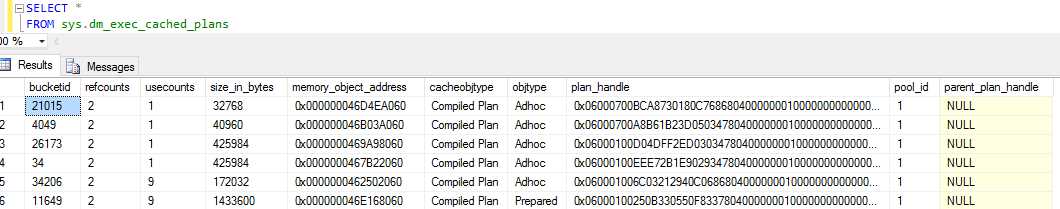
Figure 32: sys.dm_exec_cached_plans
The plan_handle is very useful, however. We will need this once we know which plan and query it actually belongs to. We can get the actual plan with the function sys.dm_exec_query_plan, which takes a plan_handle as parameter. For some reason this also returns the database ID, which is nice if we want to filter on database (which we do, as it also has plans of the master database).
Now that we have the plan_handle and the query_plan, we want the actual query. This is another function, called sys.dm_exec_sql_text, which also has a plan_handle as input parameter. We now also have the text and, again, database ID. We can get the database ID from a database name using DB_ID(database_name).
Code Listing 83: List query plans
SELECT cp.plan_handle, qp.query_plan, st.[text] FROM sys.dm_exec_cached_plans cp CROSS APPLY sys.dm_exec_query_plan(cp.plan_handle) AS qp CROSS APPLY sys.dm_exec_sql_text(cp.plan_handle) AS st WHERE qp.[dbid] = DB_ID('AdventureWorks2014') |
Now here is a most peculiar thing: open up a new query window and run DBCC FREEPROCCACHE. Remove it and, in the same window, run SELECT * FROM Person.Person (or whatever you like). Empty the query window again and run SET ARITHABORT OFF. Clear the query window and run SELECT * FROM Person.Person again. Now list the query plan, and you will see that SELECT * FROM Person.Person is listed twice! But how could this be? Isn’t a query plan reused?
SQL Server reuses query plans, but only if the query is exactly the same, and certain settings are the same as well. ARITHABORT is a setting that will trigger SQL Server to create a new plan if the setting value is different from a currently stored plan. These settings can be retrieved using the function sys.dm_exec_plan_attributes. There are a lot of attributes, and their values are stored together in a single value, so it’s completely unreadable. Luckily for us, SQL Server MVP Erland Sommarskog has written a rather lengthy (but very good and detailed) article about this phenomenon. This part is especially relevant in his “Different Plans for Different Settings” section. I’m going to use his trick to get all these attributes on one line; you can read his blog to make sense of it all.
Code Listing 84: List plan attributes
SELECT cp.plan_handle, qp.query_plan, st.[text], attrlist FROM sys.dm_exec_cached_plans cp CROSS APPLY sys.dm_exec_query_plan(cp.plan_handle) AS qp CROSS APPLY sys.dm_exec_sql_text(cp.plan_handle) AS st CROSS APPLY (SELECT epa.attribute + '=' + convert(nvarchar(127), epa.value) + ' ' FROM sys.dm_exec_plan_attributes(cp.plan_handle) epa WHERE epa.is_cache_key = 1 ORDER BY epa.attribute FOR XML PATH('')) AS a(attrlist) WHERE qp.[dbid] = DB_ID('AdventureWorks2014') |
The takeaway here is that SQL Server creates a plan based on certain settings. ARITHABORT is a very nasty one, too. When you’re running a query from C# code, be it through ADO.NET or Entity Framework, ARITHABORT is set to OFF by default. However, if you run a query in SQL Server, ARITHABORT is ON by default. So whenever your application is running slowly because of some query, and you run the query in SSMS, it will probably be lightning-fast—it will create a new plan because the ARITHABORT setting is different. I have been stumbling around in the dark for years not knowing about this!
Now that you know how to get the query plan for a single query, it is also possible to delete this plan from the cache. We have used DBCC FREEPROCCACHE to delete all plans from the cache, but you can use the plan_handle to delete just that one plan. Just grab the handle and pass it to DBCC FREEPROCCACHE.
Code Listing 100: DBCC FREEPROCCACHE (plan_handle)
DBCC FREEPROCCACHE (0x060007003A0E5604409D13610400000001000000000000000000000000000000000000000000000000000000) |
Another DMV we can use is sys.dm_tran_locks. It shows currently active requests to the lock manager. Additionally, sys.dm_os_waiting_tasks shows all sessions that are currently waiting on a lock resource. So combining the two, we get the sessions that are currently waiting to acquire a lock along with the lock information.
Code Listing 101: List blocked sessions
SELECT * FROM sys.dm_tran_locks tl JOIN sys.dm_os_waiting_tasks AS owt ON tl.lock_owner_address = owt.resource_address |
The most interesting columns right now are the request_session_id in dm_tran_locks (which should correspond to the session_id in dm_os_waiting_tasks) and the blocking_session_id in dm_os_waiting_tasks. We can use these columns to get the associated sessions from sys.dm_exec_connections.
Code Listing 85: List blocked connections
SELECT * FROM sys.dm_tran_locks tl JOIN sys.dm_os_waiting_tasks AS owt ON tl.lock_owner_address = owt.resource_address JOIN sys.dm_exec_connections ec_waiting ON ec_waiting.session_id = tl.request_session_id JOIN sys.dm_exec_connections ec_blocking ON ec_blocking.session_id = owt.blocking_session_id |
The dm_exec_connections view has a column most_recent_sql_handle. This is the last query that was executed by the session, and must be the queries that are currently blocking and waiting. We have already seen how to get the query text and plan from a sql_handle, so we can apply that here as well. Furthermore, a lock is requested on some partition, as indicated by the resource_associated_entity_id in dm_tran_locks. The partition belongs to an object, so this is where we get the object ID, which we can then use to get the object name. If we filter out some fields, we’re left with a resulting table that’s actually pretty readable.
Code Listing 86: List blocked queries
SELECT tl.request_session_id ,owt.blocking_session_id ,tl.resource_type ,waiting_text.[text] AS WaitingText ,blocking_text.[text] AS BlockingTest ,OBJECT_NAME(p.object_id) AS ObjectName FROM sys.dm_tran_locks tl JOIN sys.dm_os_waiting_tasks AS owt ON tl.lock_owner_address = owt.resource_address JOIN sys.dm_exec_connections ec_waiting ON ec_waiting.session_id = tl.request_session_id JOIN sys.dm_exec_connections ec_blocking ON ec_blocking.session_id = owt.blocking_session_id CROSS APPLY sys.dm_exec_sql_text(ec_waiting.most_recent_sql_handle) AS waiting_text CROSS APPLY sys.dm_exec_sql_text(ec_blocking.most_recent_sql_handle) AS blocking_text JOIN sys.partitions p ON p.hobt_id = tl.resource_associated_entity_id |
![]()
Figure 33: Currently blocked query
If you decide that the blocker is less important than the waiter, or that the blocker is breaking too much, you can easily kill the blocker if you want to.
Code Listing 87: List and kill a session
EXEC sp_who -- Lists all sessions. EXEC sp_who2 -- Lists all sessions+. KILL 54 -- Kill a session. |
DMVs are an invaluable tool when trying to troubleshoot problems. Unfortunately, there are a whole lot of them, and most of them just don’t make sense when you don’t know exactly what’s going on. One person who does know what’s going on, and who has helped me and my coworkers a lot, is Pinal Dave. I’ve never met him in person, but luckily he shares his knowledge in his blogs. No doubt you’ve already come across him—he’s the (self-proclaimed) SQL Authority. Hopefully, next time you’re troubleshooting some query, you know what to do.
Tip: We have seen various methods of finding out what’s going on in your SQL Server database. Another way of seeing what’s up is by using the Activity Monitor. It shows processor time, waits, I/O, and recent expensive queries. It’s less detailed than the methods laid out in this chapter, but gives a nice overall picture of your database performance. To open it, simply right-click on your instance in the Object Explorer and choose Activity Monitory from the context menu, or click Activity Monitor on the top menu.
- 1800+ high-performance UI components.
- Includes popular controls such as Grid, Chart, Scheduler, and more.
- 24x5 unlimited support by developers.