
Roslyn Succinctly®

CHAPTER 2
Coding in Visual Studio 2015: A Roslyn-Powered Experience
The best way to get a more precise idea of what the Roslyn APIs can be used for is to look at how Microsoft used the new compilers’ services in Visual Studio 2015. The code editor has been enhanced and brings significant improvements to the coding experience. Some existing tools have been improved, and new features have been added to help developers be more productive than ever by keeping their focus on the active editor window while fixing issues and refactoring code. This improved experience is also known as code-focused experience, and is completely powered by the .NET Compiler Platform. This chapter describes updated and new features in the code editor. In this way, you will become more familiar with Roslyn, starting from how Visual Studio 2015 itself uses the platform.
Live Static Code Analysis: Light Bulbs and Quick Actions
Though restricted to specific code issues, the Visual Studio code editor has always offered live static code analysis, which means that background compilers could detect code issues and report warnings and errors by squiggling the code that needs your attention, and populating the Error List window with detailed error or warning messages. Figure 5 shows an example of live static code analysis with code that declares a variable of type int which is never used, and attempts to call a DoSomething method that does not exist.
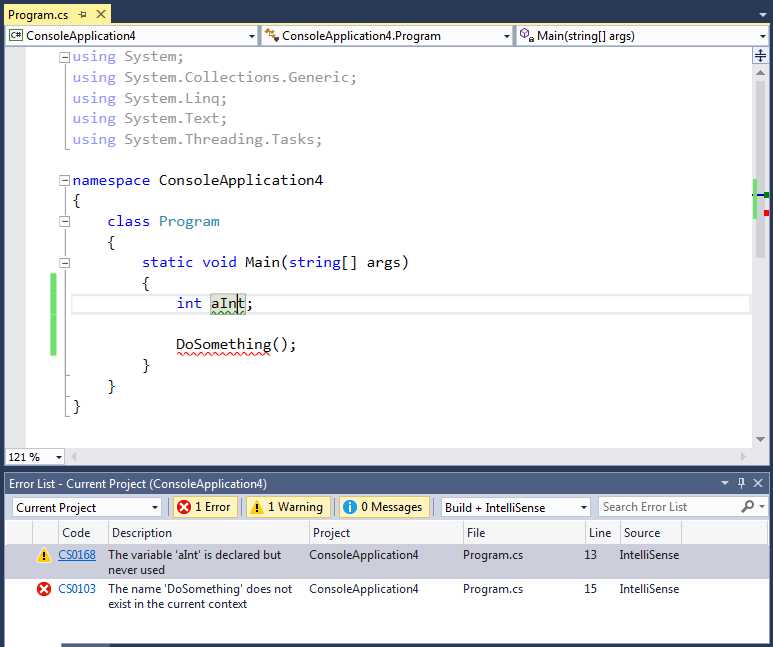
Figure 5: Live code analysis in Visual Studio
However, the code analysis engine prior to Visual Studio 2015 had the following limitations:
- Most code issues could be detected at compile-time only.
- The code editor could only analyze code for a number of rules coded at Microsoft, with no way of adding custom rules.
In Visual Studio 2015, the live, static code analysis engine has been completely rewritten on top of the .NET Compiler Platform. This changes and improves the way you can fix code issues and allows for creating and integrating custom analysis rules, as will be explained in Chapters 4 and 5. For instance, if you hover over an error in the code editor with your pointer, an icon called the light bulb appears (see Figure 6).

Figure 6: The light bulb over an invalid line of code
If you either click the light bulb or the Show potential fixes hyperlink, Visual Studio shows a number of potential fixes (known as quick actions), as demonstrated in Figure 7.

Figure 7: Quick actions offered to fix the current issue
For each quick action, Visual Studio shows a live preview that highlights lines of code that will be added in green, and highlights lines of code that will be removed in red. To apply the suggested fix, click the desired quick action. In this case, you would click Generate method ‘Program.DoSomething’.
Tip: You can also enable light bulbs manually by pressing Ctrl+Period or by right-clicking in the code editor and then selecting Quick Actions from the pop-up menu. This is what you will do to apply code refactorings. Also, when you click a line of code containing an error, the light bulb automatically appears at the beginning of the line.
You can also get a more detailed preview by clicking Preview changes. This will launch the Preview Changes dialog box, which shows a preview of code changes and the list of files affected by the quick action. Figure 8 shows an example based on the current issue.
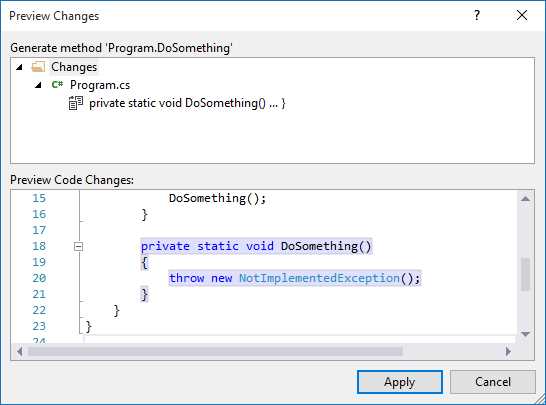
Figure 8: Previewing a quick action’s changes
You can click Apply to apply the suggested fix or Cancel to ignore it. It is worth noting that in Visual Studio 2015, the Error List window has been completely rewritten to support the new code-focused experience. Among other changes, you will see that the Code column reports the error code in the form of a hyperlink; if you click it, Visual Studio 2015 will open a webpage containing information about the error (or a Bing search if no specific page is provided).
The previous example is a simple one, but the Visual Studio 2015 analysis engine is much more powerful. For example, suppose you have a class that must implement the IDisposable interface. If you declare that the class is going to implement the interface, but you do not supply the required code, not only is an error reported as you would expect, but a light bulb also suggests the appropriate fixes. Figure 9 shows how you can implement the interface with four different alternatives, and for each possible fix you can see the preview without losing focus on your code.

Figure 9: Visual Studio 2015 suggests contextualized code fixes
This is a tremendous benefit. Visual Studio 2015 not only saves you the time of writing the required code for a particular scenario, but it also shows the proper fixes for the context you are working on. Exploring the additional potential fixes for the IDisposable interface is left to you as an exercise. Of course, the IDisposable interface implementation is not the only scenario where Visual Studio can suggest multiple and contextualized fixes, but this is definitely a very common situation, and possibly the most effective one to make you understand the power of the new code analysis engine.
Code Refactoring
Refactoring is a technique that allows reorganizing portions of code a better way, without changing the original behavior. Refactoring is very common (and recommended) after writing many lines and blocks, because it improves code readability and maintainability. Visual Studio’s code editor has always offered built-in support for refactoring in C#, but no support at all for Visual Basic (VB). In Visual Studio 2015, refactoring in C# has been improved and support for VB has been introduced for the first time, with tooling parity between languages. In Visual Studio 2015, refactoring tools are available through light bulbs and quick actions.
To demonstrate how this works in the new IDE, consider the example in Code Listing 1, which calculates the area of a circle, given the radius.
Code Listing 1: Calculating the area of a circle
static void Main(string[] args) { double radius = 4; double circleArea = radius * radius * Math.PI; Console.WriteLine(circleArea); Console.ReadLine(); } |
Select the whole method body and then enable the light bulb by right-clicking the selection and choosing Quick Actions from the pop-up menu. As you can see in Figure 10, the light bulb offers the Extract Method tool, whose purpose is encapsulating the selected code into a separate method for better readability and maintainability.

Figure 10: Code refactoring with the Extract Method tool
If you accept the suggested change, Visual Studio will extract a new method and ask you to supply a new name via the inline rename tool, which will replace all the occurrences of the previous name as you type (see Figure 11).

Figure 11: Extracting and renaming a method
Inline renaming is very straightforward because it also allows you to rename occurrences of an identifier inside string literals and comments, and replaces the old modal dialog used in previous versions of the IDE. With this new approach, developers can refactor code without losing focus on the editor, which always stays active. For a comprehensive list of available refactorings in Visual Studio 2015 for both C# and VB, you can download my free e-book, Visual Studio 2015 Succinctly. As with code analysis, you can get a more detailed preview before applying changes via the Preview Changes dialog box.
Removing Redundant Code
The code editor can automatically detect redundant code, such as unnecessary using (C#) and Imports (VB) directives, unnecessary this and Me keywords, or unnecessary conversions between types. Redundant code appears with lighter colors, such as light blue for reserved words, or light gray for identifiers. With light bulbs, you can easily refactor redundant code as demonstrated in Figure 12, which shows how to remove unnecessary using directives.

Figure 12: Removing unnecessary directives
As you can see in the live preview, the lines of code that will be removed are highlighted in red. Regarding using and Imports directives, if you select a number of directives and then right-click, the pop-up menu will show an item called Organize Usings for C#, or Organize Imports for VB, which exposes commands to remove directives, sort directives, or both.
Behind the Scenes: Roslyn Analysis Explained Succinctly
Behind the scenes, all the features described in this chapter so far are powered by the .NET Compiler Platform. To provide the coding experience described previously, the code editor uses a number of special plug-ins called code analyzers to analyze code in real time and detect code issues as you type. A code analyzer, or simply analyzer, is a library that uses the Roslyn APIs to analyze source code for syntax correctness, accuracy with the implementation of programming patterns, adherence to Microsoft’s .NET coding rules, and so on.
Analyzers contain domain-specific rules and seamlessly integrate with the code editor. For each rule, an analyzer provides a diagnostic, which is responsible for code analysis on the single rule. Your code is automatically parsed at every key stroke; when a diagnostic detects code that is not compliant with a rule defined in the analyzer, it sends a notification and exposes possible fixes so that Visual Studio can report the specified error or warning, and provide the proper quick actions.
Visual Studio 2015 ships with a built-in set of analyzers that check for Microsoft’s coding and syntax rules. This set is automatically added to every new project, but you can install additional analyzers and even create your own, as you will learn in Chapter 4, “Writing Code Analyzers”. Similar concepts apply to code refactorings. Visual Studio 2015 ships with a built-in set of code refactorings that help you reorganize your code with common scenarios.
As for diagnostics, a code refactoring is exposed by a library the uses the Roslyn APIs and analyzes the source code to detect if any code blocks can be reorganized a better way. You can also install additional code refactorings, and even create custom ones, as you will learn in Chapter 5, “Writing Refactorings”. Chapter 5 is a summary of how Roslyn empowers the code-focused experience in Visual Studio 2015, but starting with the next chapter, you will learn many more technical concepts required to get the most out of the .NET Compiler Platform.
Note: The code editor is not the only part of Visual Studio 2015 that relies on the .NET Compiler Platform. Language services, expression evaluators, and many tool windows and dialogs are also powered by the Roslyn APIs. To get an idea of what tools in Visual Studio 2015 are built on top of the .NET Compiler Platform, you can browse the source code online and take a look at folders whose names contain the word “Feature,” plus the VisualStudio folder.
Downloading, Installing, and Using Code Analyzers
With Roslyn, developers can create custom analyzers and refactorings and publish them to the online NuGet package repository or the Visual Studio Gallery. Before you learn how to create and publish analyzers to both repositories, which is covered in the next chapters, it’s important for you to know how to use existing analyzers by downloading, installing, and configuring these components inside a project. Because other developers will perform the same steps with your analyzers, you need to understand how they behave.
In the next example, you will download a sample analyzer I created that works with Windows Store apps, Windows Phone apps, and projects that use the OData client libraries from Microsoft. More specifically, this analyzer detects the usage of the System.DateTime type, and suggests using System.DateTimeOffset instead.
Tip: Controls like the DatePicker in Windows Store and Windows Phone apps work with objects of type System.DateTimeOffset, but passing an object of type System.DateTime is not reported as an issue. Also, the OData protocol works with DateTimeOffset, but passing DateTime is not reported as an issue. The sample analyzer helps passing the proper object type.
In Visual Studio 2015, create a new Windows Phone 8.1 project with the language of your choice (this example is in Visual Basic). Depending on which version of Visual Studio you are using, the Windows Phone application templates may not be installed by default. If you wish to try this example, you will have to download and install the Windows Phone SDK. You can do this from within Visual Studio in the New Project dialog after selecting the Windows 8 project templates item. After installing the Windows Phone SDK, you can use the Blank App (Windows Phone) template, which is located under Windows > Windows 8 > Windows Phone in the New Project dialog, as shown in Figure 13. You can leave the default project name unchanged.

Figure 13: Creating a Windows Phone 8.1 project
When the project is ready, save it, right-click the project name in the Solution Explorer, and select Manage NuGet Packages from the context menu. At this point, the NuGet Package Manager window appears. In the search box, type datetime and search for the DateTimeAnalyzerVB package (or DateTimeAnalyzerCS for C#), as shown in Figure 14.

Figure 14: Searching for an analyzer on NuGet
Analyzers for other libraries are also offered as NuGet packages. When you browse for a NuGet package, you can see the description, license agreement (if any), author name, list of available versions, and other information. If you click Install, Visual Studio will first display a dialog box containing summary information and the list of dependencies for the selected package, if any. Then you will be asked to accept the license agreement, as shown in Figure 15.
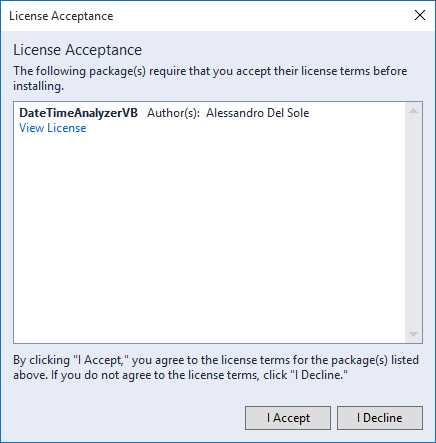
Figure 15: Accepting the package’s license agreement
At this point, Visual Studio’s integrated NuGet package manager will download the package and place the library in the proper place. The operation’s progress is shown in the Output window, and when it completes, you will also see a green check mark symbol near the package name in the NuGet Package Manager window (see Figure 16).

Figure 16: The DateTimeAnalyzerVB analyzer after being downloaded and installed
Tip: This book explains how to install analyzers from NuGet because it is the most common scenario. However, if you want to search for analyzers in the Visual Studio gallery, you must select Tools > Extensions and Updates, and search for the package online from the Extensions and Updates dialog box. This is also exactly what you do when you search for extensions for Visual Studio.
Alternatively, you can install the package from the Package Manager Console. The console can be enabled by selecting Tools > NuGet Package Manager > Package Manager Console. When enabled, type the following in the command line:
Install-package DateTimeAnalyzerVB
Once the package has been installed, expand the References node in the Solution Explorer, and then expand the Analyzers subnode. The latter contains the list of additional installed analyzers, and here you should see the newly installed DateTimeAnalyzer (see Figure 17). Every analyzer appears as an expandable node. When you expand an analyzer node, you will see the list of diagnostics and refactorings that it exposes.
In this case there is only one diagnostic, called DTA001: Usage of System.DateTime. This name is formed from the diagnostic’s unique ID and its title. If you click a diagnostic, you will see useful information about it in the Properties window.
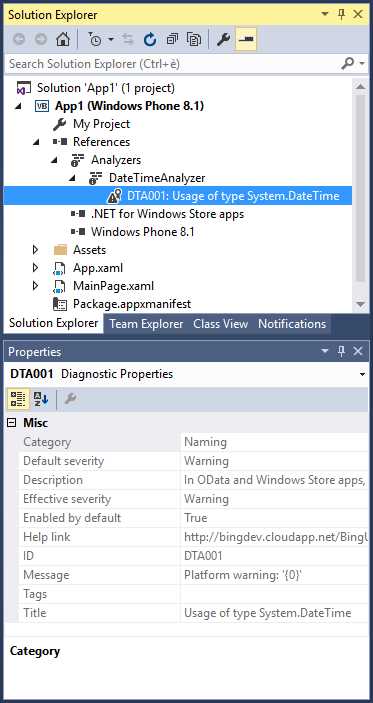
Figure 17: Investigating diagnostics and their properties
Here you can see the diagnostic’s description, its severity level (Warning in this case), if it is enabled by default, and other information. Now you will use the downloaded analyzer in practice, and then you will see how to adjust its configuration. Open any code-behind file in the project (that is, a .vb or .cs file according to the language you chose). Then, declare a variable of type System.DateTime (in Visual Basic you can also use the Date keyword). As you can see in Figure 18, the code editor detects that you are using a DateTime object in a project where you may prefer DateTimeOffset, so it reports a warning and suggests the proper fix.

Figure 18: The analyzer detects a code issue and suggests the proper fix
As you can see, installing and using an analyzer is easy because everything integrates seamlessly with the code editor. You can also fine-tune the behavior of both built-in and external analyzers. To accomplish this, double-click My Project (for VB) or Properties (for C#) in the Solution Explorer. When the project’s properties window appears, select the Code Analysis tab, as shown in Figure 19.

Figure 19: The Code Analysis tab in the project properties window
Do not change the default rule set. Just click Open. This will open a window containing the list of analyzers for the current rule set, which includes a number of built-in analyzers. Figure 20 illustrates this.

Figure 20: Configuring an analyzer’s behavior
Expand the DateTimeAnalyzer node. You can enable or turn off the diagnostic by selecting or clearing the check box next to the ID, and you can also change the default severity. For instance, you might disable the diagnostic because you need to work with DateTime objects, or you can change the default severity from Warning to Error, causing the code editor to display a red squiggle beneath the line of code shown in Figure 18, which would prevent the project from compiling. These adjustments can be also performed against the built-in analyzer shown in the window, but of course you are encouraged to leave the default settings unchanged. Now that you have a better idea of what Roslyn can do and what you can do with analyzers, it’s time to move to more complex concepts.
Chapter Summary
This chapter described how the coding experience in Visual Studio 2015 has been enhanced, explaining how many of the features you use in the code editor have been actually rewritten on the .NET Compiler Platform. This empowers the live, static code analysis engine, which detects code issues as you type and suggests proper fixes. Live code analysis relies on code analyzers and refactorings, both of which are exposed by libraries that leverage the Roslyn APIs.
The very good news is that you are not limited to using built-in analysis rules; you can also download and install third-party analyzers from NuGet or the Visual Studio Gallery. Once installed, analyzers integrate seamlessly with the code editor, and work perfectly detecting code issues based on the custom, domain-specific rules. Additionally, you can fine-tune an analyzer’s behavior by enabling and disabling diagnostics, or by changing its severity level.
- 1800+ high-performance UI components.
- Includes popular controls such as Grid, Chart, Scheduler, and more.
- 24x5 unlimited support by developers.