
Rider Succinctly®

CHAPTER 3
Running, Debugging, and Testing
Having customized the IDE, we are now ready to run the programs we write. But whether you’re coming with experience of Visual Studio or no experience at all, Rider has new features and mechanics that you’ll have to learn.
We’re going to discuss the key topics: how to edit and run code and how the debugger works, as well as the support for NuGet and unit testing.
Installing requisite tools
If you are running Rider on a system where Visual Studio is installed, you can skip this section. If you are not, here is the set of tools that you’ll need to install in order to get Rider to actually build anything:
- Microsoft Build Tools (just grab the latest version).
- .NET Framework (unless it was already installed with Build Tools).
- (Optional) .NET Core, if you plan to build those types of apps.
- (Optional) IIS Express (choose the X86 distribution for your language).
- (Optional) If you plan to do F# development, add the FSharp.Compiler.Tools NuGet package to your project. You might also have to change the TargetFrameworkVersion project setting.
With these tools installed, you can now compile and run .NET applications in Rider.
Creating a project
The whole point of making a computer program is to write some source code that gets compiled into a binary file. There are two main forms of output: an executable and a library. An executable is a program that that you can run straightaway; a library is a binary file that can be used by another executable or library.
A project in the Rider/Visual Studio terminology is a collection of files that get compiled into a single binary file. But since large systems are built of multiple projects, these are typically grouped into solutions. A solution is simply a collection of projects that may or may not be related. Sometimes you just want to group related projects under one roof; at other times, you have an executable and a bunch of libraries used by that executable. In either case, a solution is what you want.
If you look at the right-hand side of the Start screen, you’ll see some options for how to get started working with actual code:
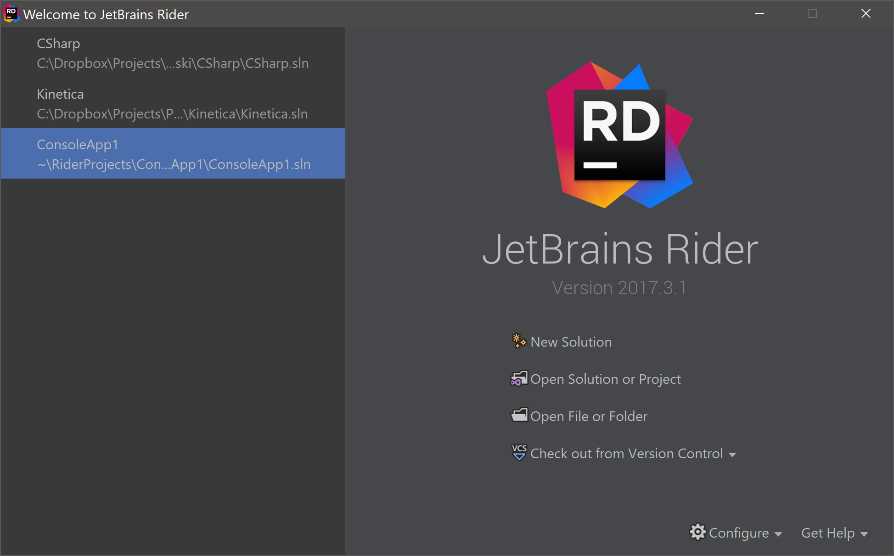
Figure 28
So the big options on the right are:
- New Solution makes a new solution with a single project. There are many project templates that we’ll see in just a moment.
- Open Solution or Project opens either a solution file or a project file. If you open a project file, a solution file for that project can be automatically created. Remember, even though you can compile projects individually in MSBuild, Rider chooses to work specifically with solutions.
- Open File or Folder allows you to open a single file or a folder full of files when a project or solution file is not available.
- Check out from Version Control is a super-useful option that lets you automatically download sources from a repository (e.g., on GitHub) and open the solution straightaway in Rider.
When you make a new solution, Rider gives you the option to make the first project in that solution for you. It offers quite a selection of templates, as you can see:

Figure 29
The first option is to create an Empty Solution—something that’s only really useful if you’re still thinking about exactly what kind of project you want to add. It generates a default .sln file, and that’s it.
The More Templates option lets you install and manage additional templates that would subsequently be available. Note that those are not your canonical Visual Studio templates; instead, they are templates related to the dotnet new command of .NET Core.
Following those two options, we have several different sections related to .NET Core, .NET (your good old-fashioned .NET Framework), and Xamarin. If you are not familiar with the types of applications that can be built on the .NET ecosystem, here’s a brief refresher:
- Class Library makes a library, a binary component that isn’t executable but can be used in other libraries and applications. Essentially, it’s a reusable component.
- Console Application is an executable that runs inside your OS’s terminal window. It can only read and write textual output; there are no graphics.
- Unit Test Project is a project that would contain unit tests. In actual fact, a unit test project is typically also a class library (though there’s no harm in making it a console app) that gets loaded and processed by a unit test runner. In our case, one unit-test runner is Rider itself!
- ASP.NET Web Application is a web application (a website or just a web service) that uses the ASP.NET infrastructure. Until recently, you could only run ASP.NET apps on Microsoft’s own Internet Information Server (IIS) platform that was tightly coupled to Windows. Nowadays, the choice of ASP.NET hosts is much greater, and includes Windows Azure (which is admittedly still tied to Microsoft) as well as Kestrel, a cross-platform ASP.NET web server that is free and isn’t Windows-specific.
- WPF Application is what you’d choose if you want to make a plain-old Windows application with a user interface. The older technology, Windows Forms, is a lot more difficult to use in Rider (it relies heavily on visual designers that Rider doesn’t have), so there is no template for it.
- Xamarin is a platform for making cross-platform mobile applications that can work on many devices (Android, iOS, and even UWP) from a single source code. Naturally, there are differences in UI implementations, so a typical implementation of a Xamarin app is composed of a business logic in one or more libraries coupled with two or more front-end implementations. Luckily, most of the scaffolding gets generated automatically.
Depending on your choice of template, the right-hand side of the dialog window will present you some options for customizing the project.
Running programs
Once you’ve written your program, you can run it right from the IDE and, if your program is a console application, it will also run inside the IDE, thanks to Rider’s integrated console. In practice, this means that your command-line input/output will be intercepted and shown inside a separate tool window:
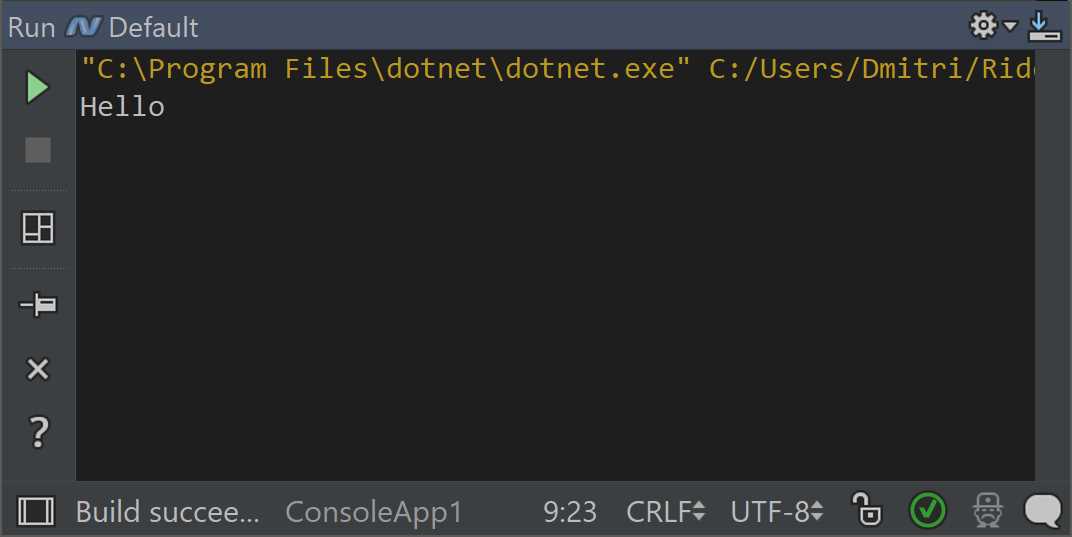
Figure 30
Note: It’s important to understand the difference between the Run window and the Terminal window. The window seen in Figure 30 shows up when you execute an app. The Terminal window is a separate plug-in that hosts the native OS terminal.
If your app is not a console app, then the result of actually running the app depends on the type of application you’re working with. If you have a WPF app, the main window of that app will be shown. If you are working with ASP.NET, you’ll see a browser. If you fire up a Xamarin app, it can open up in an emulator (or on a mobile device).
In order to be able to run or debug anything, you need to create an appropriate configuration; the configuration options are available from the top menu in Run > Edit Configurations, and typically look as follows:
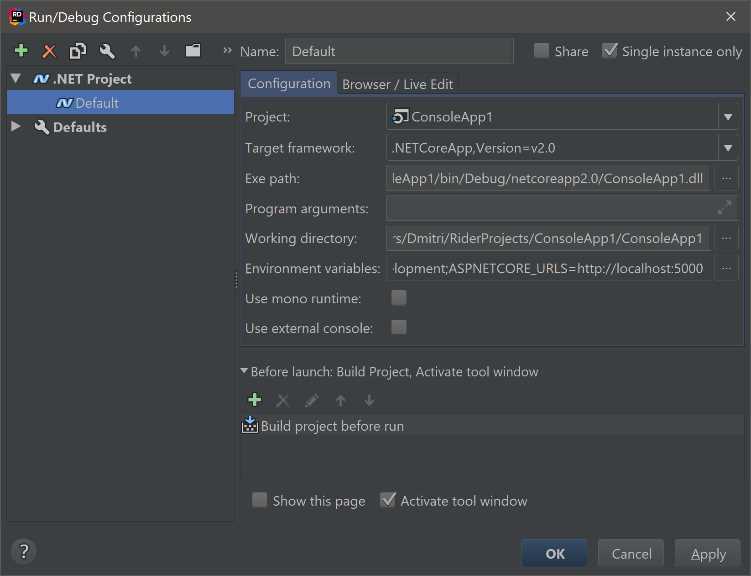
Figure 31
A configuration defines all the parameters related to how the app is executed. You can choose the project to run, which version of .NET Framework to run on, and the path on which to run the app, as well as lots of other useful information.
Rider comes with lots of different types of configurations (for example, covering different web frameworks), but the main ones relevant to .NET developers are either the .NET Executable or various Xamarin templates. That’s it.
Debugging
The whole point of debugging is being able to stop in the middle of a running program in order to figure out what’s going wrong. This is done using breakpoints—special markers that tell the execution engine where to stop.
You add a breakpoint by clicking in the blank area just to the left of your code. A red circle appears for each breakpoint:
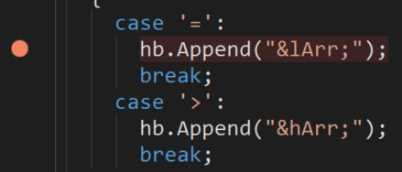
Figure 32
By default, a breakpoint will hit whenever we come to this line of code. But breakpoints can be customized; if you right-click a breakpoint, you’ll see the following:
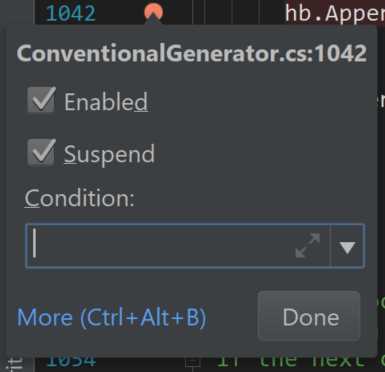
Figure 33
There are two checkboxes here: Enabled lets you control whether the breakpoint is “in play” when it comes to debugging, and Suspend determines whether or not execution actually suspends at this particular location. You see, sometimes you want breakpoints to do things other than suspending execution, such as writing something to a log.
The last option, Condition, allows you to only trigger the breakpoint whenever some condition holds. This condition can be any chunk of code, but naturally, it needs to evaluate to a bool to work.
There are lots more options if you click the More link (or use the keyboard shortcut). Here’s the dialog box you’ll get presented with:
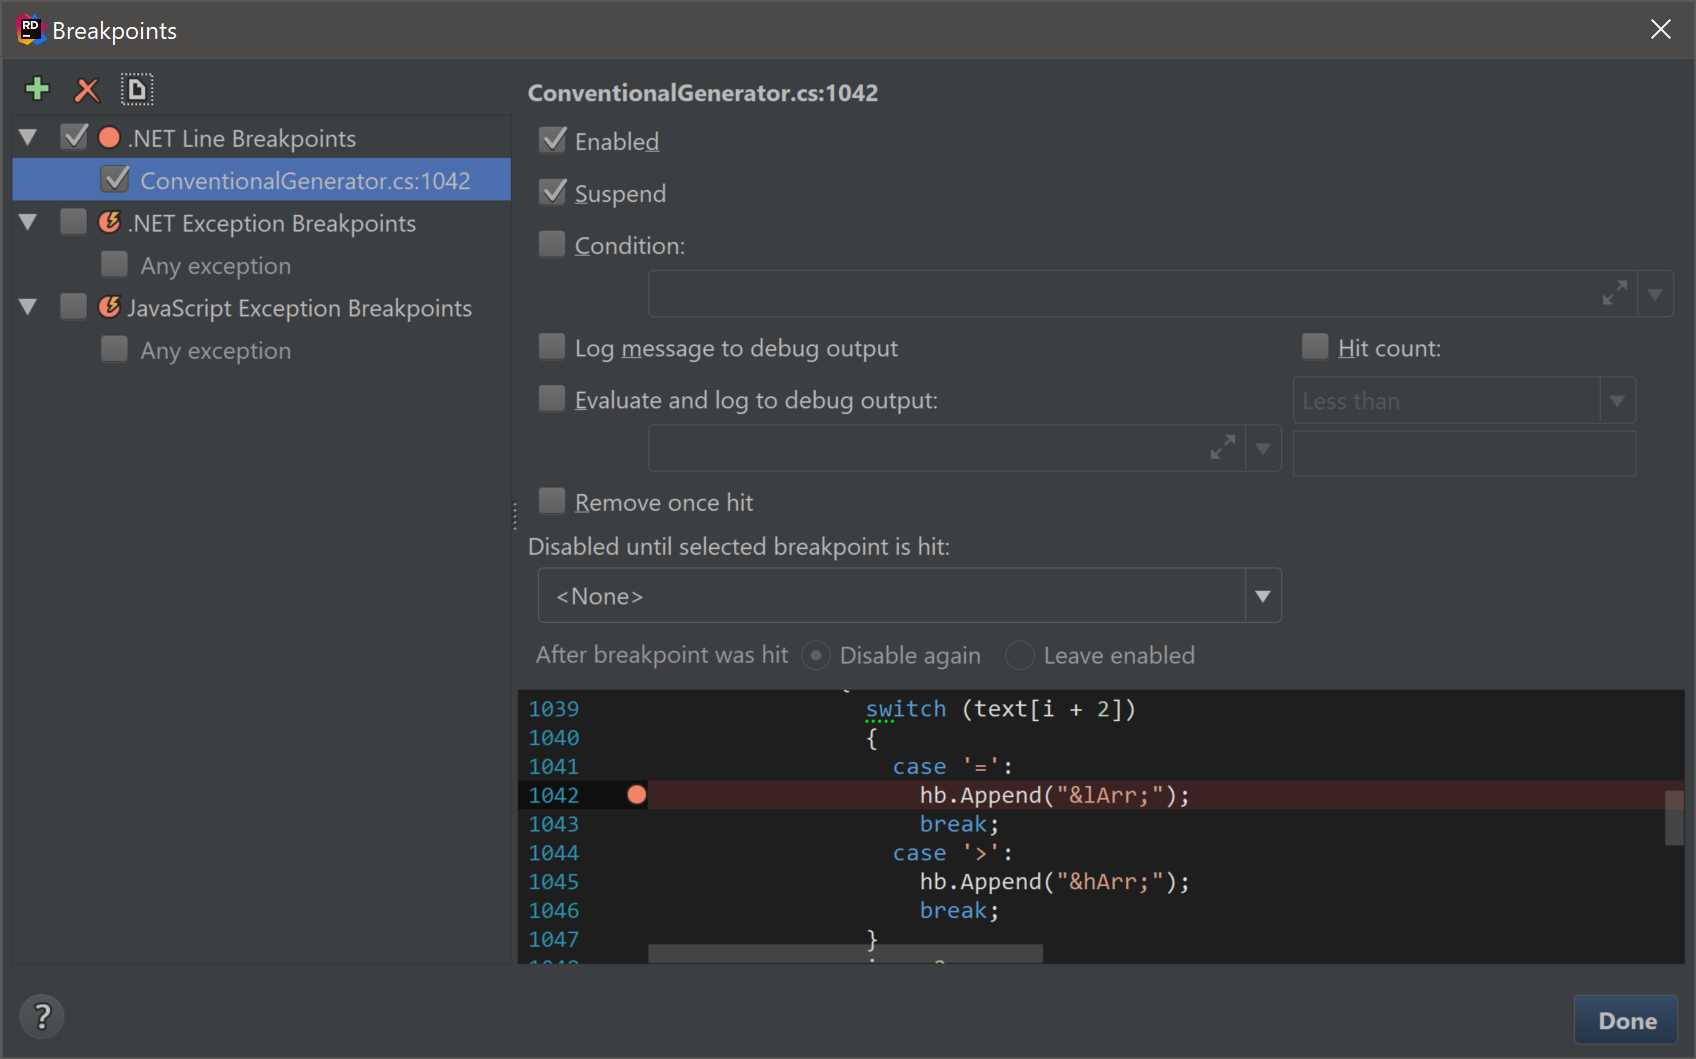
Figure 34
There’s a lot to digest here. Apart from the Enabled, Suspend, and Condition settings, you can also log a message to debug output: either just a general message that this file/line combination has been hit, or an evaluation of some expression. You can also control the span during which this happens by specifying what hit count you are prepared to do this for.
There’s an option to remove a breakpoint entirely once hit and, finally, you can disable this breakpoint until some other breakpoints hit and determine what happens after this breakpoint hits.
Towards the left-hand side, you see a list of all of your own breakpoints as well as settings related to breaking on exceptions (currently supported for .NET and JavaScript).
What happens when a breakpoint is hit? Program execution is paused, and you get to see a Debug tool window:
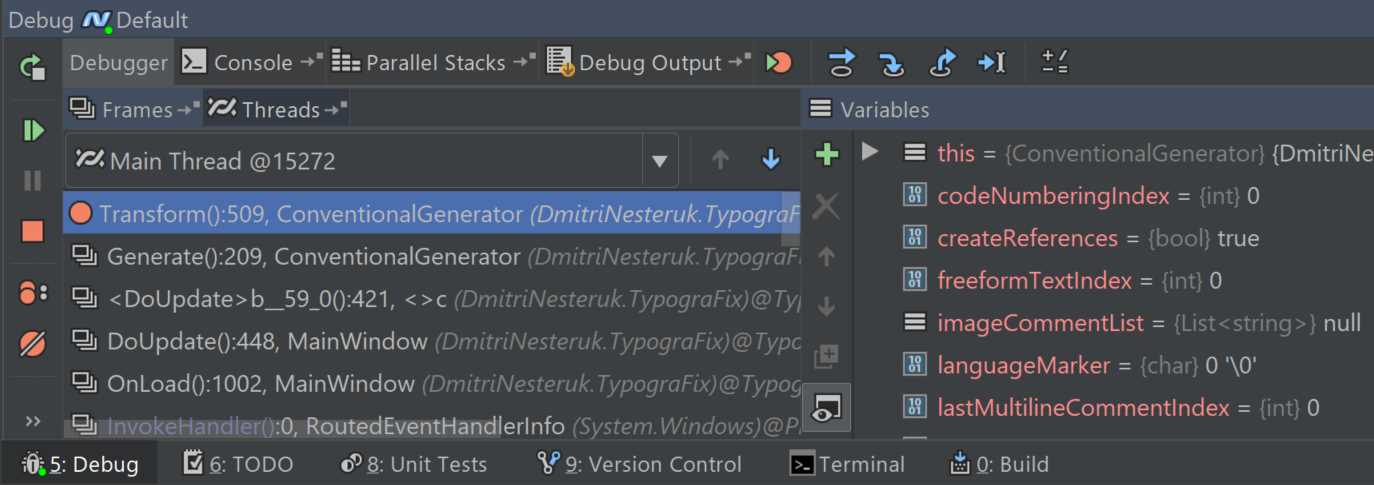
Figure 35
Having hit a breakpoint, we can see the stack frame on the left and the variables that are available for inspection on the right. The buttons on the far left let you stop and resume the debugging process, whereas the toolbar on the top has a few buttons (blue arrows) for stepping through the code currently executing.
One interesting debugging feature is Evaluate Expression (Alt+F8). This lets you type in and evaluate any expression you might be interested in, and immediately get a result in a separate pop-up window:
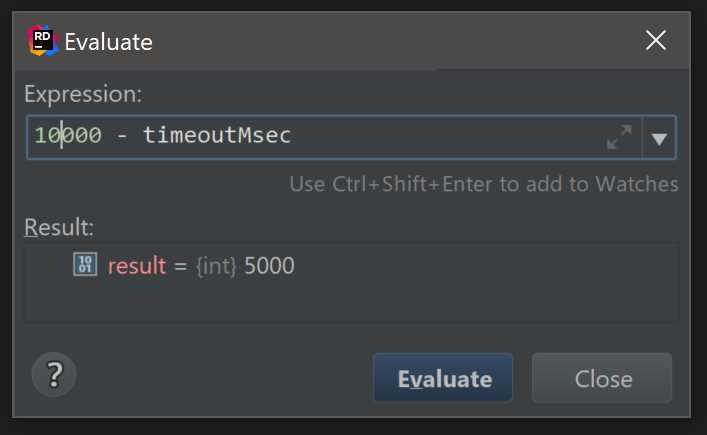
Figure 36
Individual variables and results of evaluations can be added to a separate tab called Watches: this tab helps you keep track of just the values you need as the program is executing:
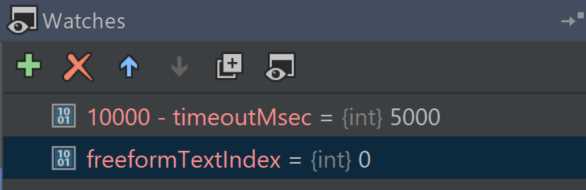
Figure 37
Unit test support
Rider has a built-in unit test runner, providing support for the NUnit, MSTest, and xUnit frameworks, as well as supporting additional test frameworks via plug-ins. The support for unit testing is present in many locations, but the two that matter most are the code editor itself and the test runner.
When working with test fixtures, tests, or other related attributes, Rider decorates the code with gutter icons that can be either clicked with the mouse or exposed with Alt+Enter to provide options related to testing:
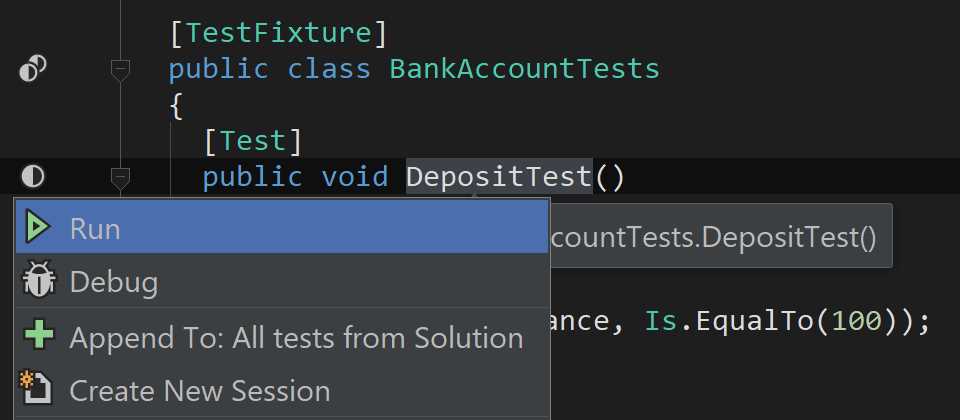
Figure 38
The first two options are fairly self-evident: you can either run the test or debug the test. The difference is that, in a debug session, all affected breakpoints are triggered, which lets you step through a tricky test and figure out what’s going wrong. All tests are added to a test session, represented by a separate tool window pane that shows one or more tests being executed.
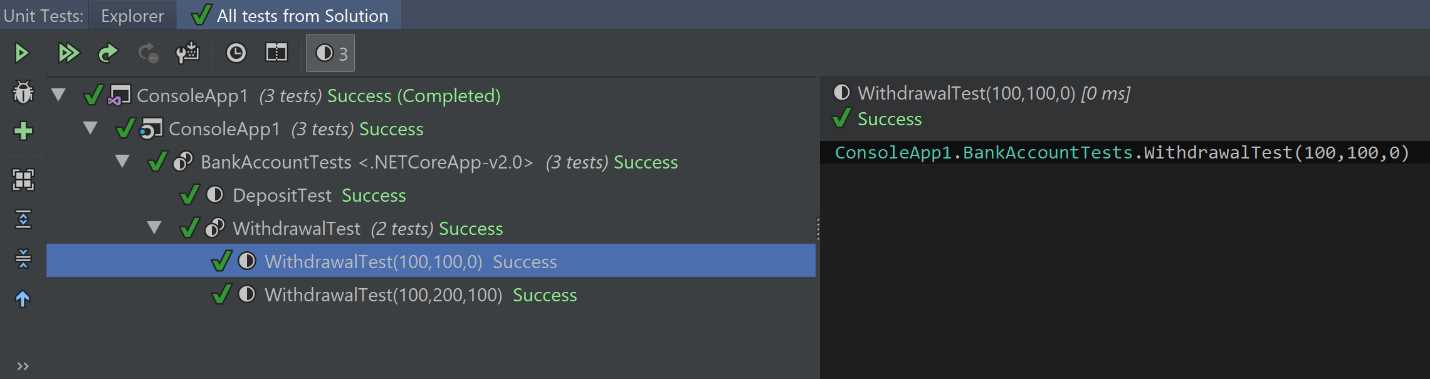
Figure 39
In the screenshot in Figure 39, I simply let Rider index and execute all tests from the solution. This is one of the most common operations. You can define sessions with your own selections of tests, and then run the test within them—either individually or collectively.
The set of options shown for a typical test can get a lot more sophisticated. For example, if you have parameterized unit tests, you can run either all the cases of a test or run/debug each of the cases individually:
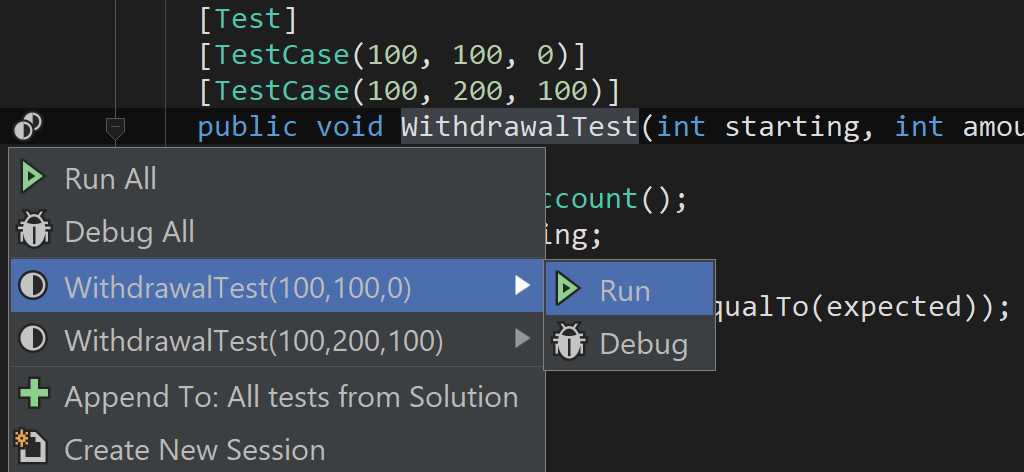
Figure 40
Rider also has a separate Quick List for unit tests, available either from the top menu as Tests > Unit Testing Quick List or via a keyboard shortcut (Alt+Shift+U in VS layout):
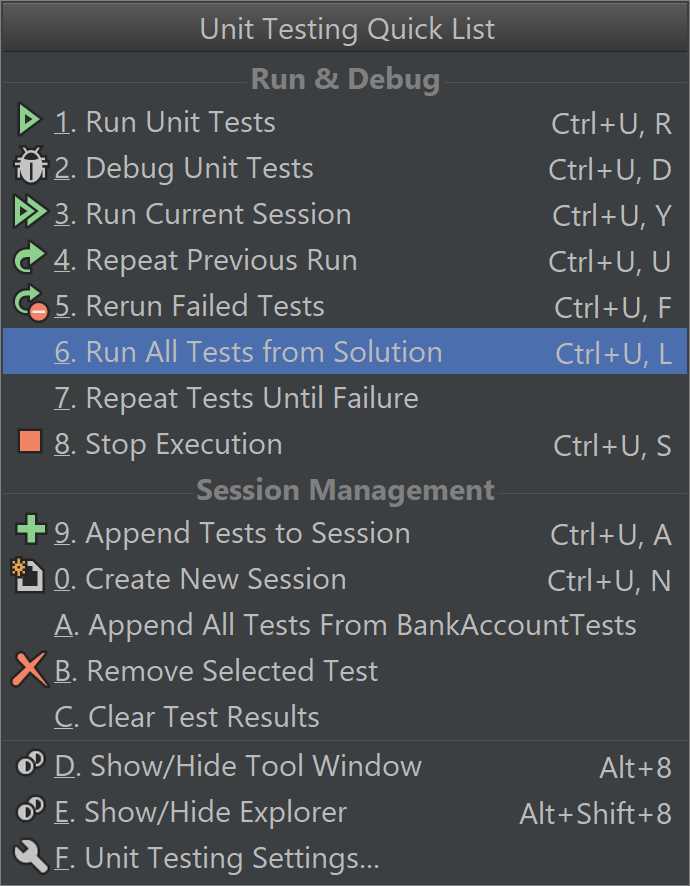
Figure 41
The last option in this list is the (rather involved) group of settings for unit testing, split into general settings, as well as settings specific to different unit test frameworks (such as NUnit, MSTest, xUnit, and Javascript [QUnit/Jasmine]).
NuGet browser
NuGet has effectively become the standard package manager on the Microsoft ecosystem—not just for .NET projects (that’s a given), but also for web-based projects, and even C++. Using a third-party NuGet package has become the norm, so it’s no surprise that Rider has its own implementation:
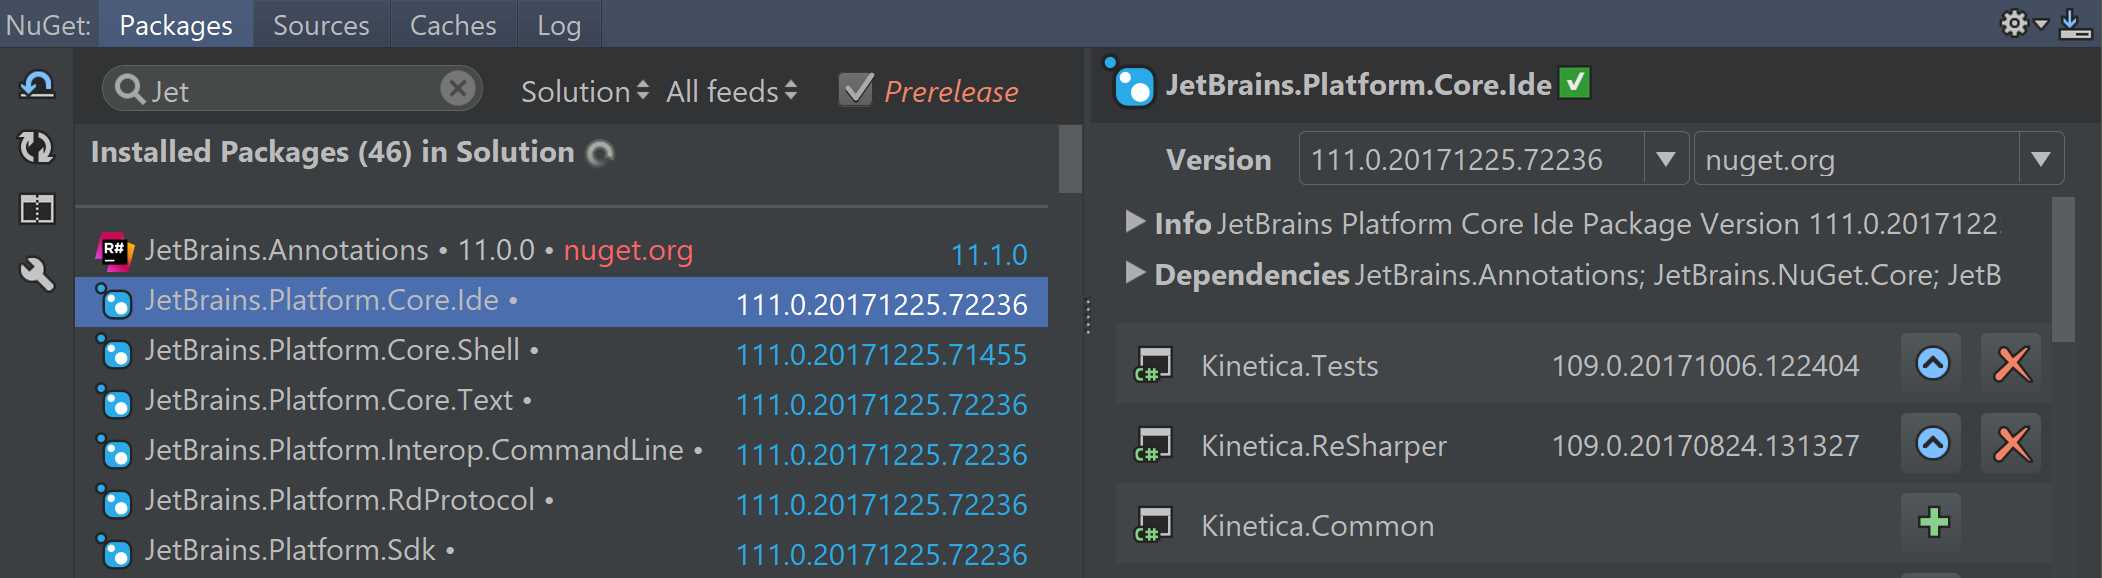
Figure 42
As you can see in Figure 42, the NuGet tool window has four different tabs:
- Packages gives you a list of the packages currently installed and the ability to install new packages, as well as upgrade/downgrade/remove them for the different projects in your solution.
- Sources lets you add and remove package sources.
- Caches lets you control the location of the NuGet caches and lets you specify whether or not you want to clear those caches automatically.
- Log shows a read-only log of NuGet operations.
Note that Rider does not give you a package manager console in the same way that Visual Studio does. If you need one, you’ll need to spawn one yourself.
- 1800+ high-performance UI components.
- Includes popular controls such as Grid, Chart, Scheduler, and more.
- 24x5 unlimited support by developers.