
ReSharper Succinctly®

CHAPTER 8
Unit Testing Tools
If you’re a TDD practitioner, then you'll no doubt know that there's an absolute mass of different tools out there with the sole purpose of making testing easier.
There's more frameworks than you can shake a stick at, and then there's the continuous integration and build tools, that will run these tests and perform automated builds for you.
The problem is, most developers actually don't have time to investigate all of these frameworks—all they want to do is to begin writing their tests, then to be able to run them and find out a result.
Unfortunately, what generally happens is that they spend more time learning the subtle nuances of each framework. Then they spend time making sure they can test everything they want to test…then they spend even more time figuring out how to integrate the test framework into their build environment.
With all these factors in play, TDD nirvana in Visual Studio would be best achieved by just being able to write a test and not worry about how to make it work.
R# brings this option to the table in the form of its Unit Testing tools, and out of the box it supports NUnit and MsTest, along with JavaScript unit test support in the form of QUnit and Jasmine.
On top of that, you can choose to use your default browser or PhantomJS to run your JS test scenarios, and the built-in test runners and session managers for your .NET code.
If you take a look in the Tools > Unit testing options from the ReSharper Options dialog box, you have a very fine-grain amount of control over how the test frameworks run should you need it, but R# is set by default with the best practice defaults, enabling you to immediately just start writing tests.
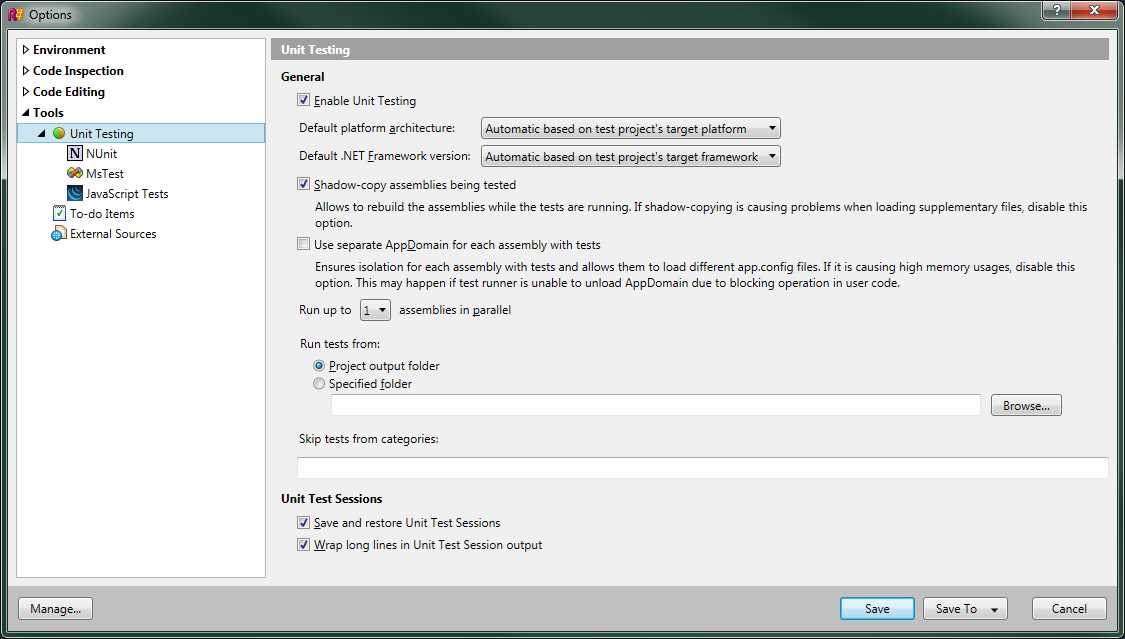
- R# general unit test options
Some of the options you have include being able to force tests to run under a specific .NET version or on a specific app domain. You can even relocate your tests so they run from an entirely different location to that of your project, and each of these settings can be saved at project level, so the settings traverse the entire team.
The menu itself is typical of the others we've seen so far, with options being context-sensitive.

- The R# unit tests menu
For me personally, I very often only use the bottom two options: Unit Tests and Unit Test Sessions, the first of which will open the following window:
- R# Unit Test Explorer
The Unit Test Explorer allows you to explore and manage all the tests you have available from one central location. When you have tests available in your solution, they show up in here grouped by the option you have set in your Group By drop-down menu at the top of the window.
The second window, Unit Test Sessions, allows you to manage your test runs as individual entities. This is useful because it allows you to do things like comparing current and previous runs side by side to observe the differences.
When selected, the Unit Test Sessions options will open the following window:

- R# Unit Test Sessions window
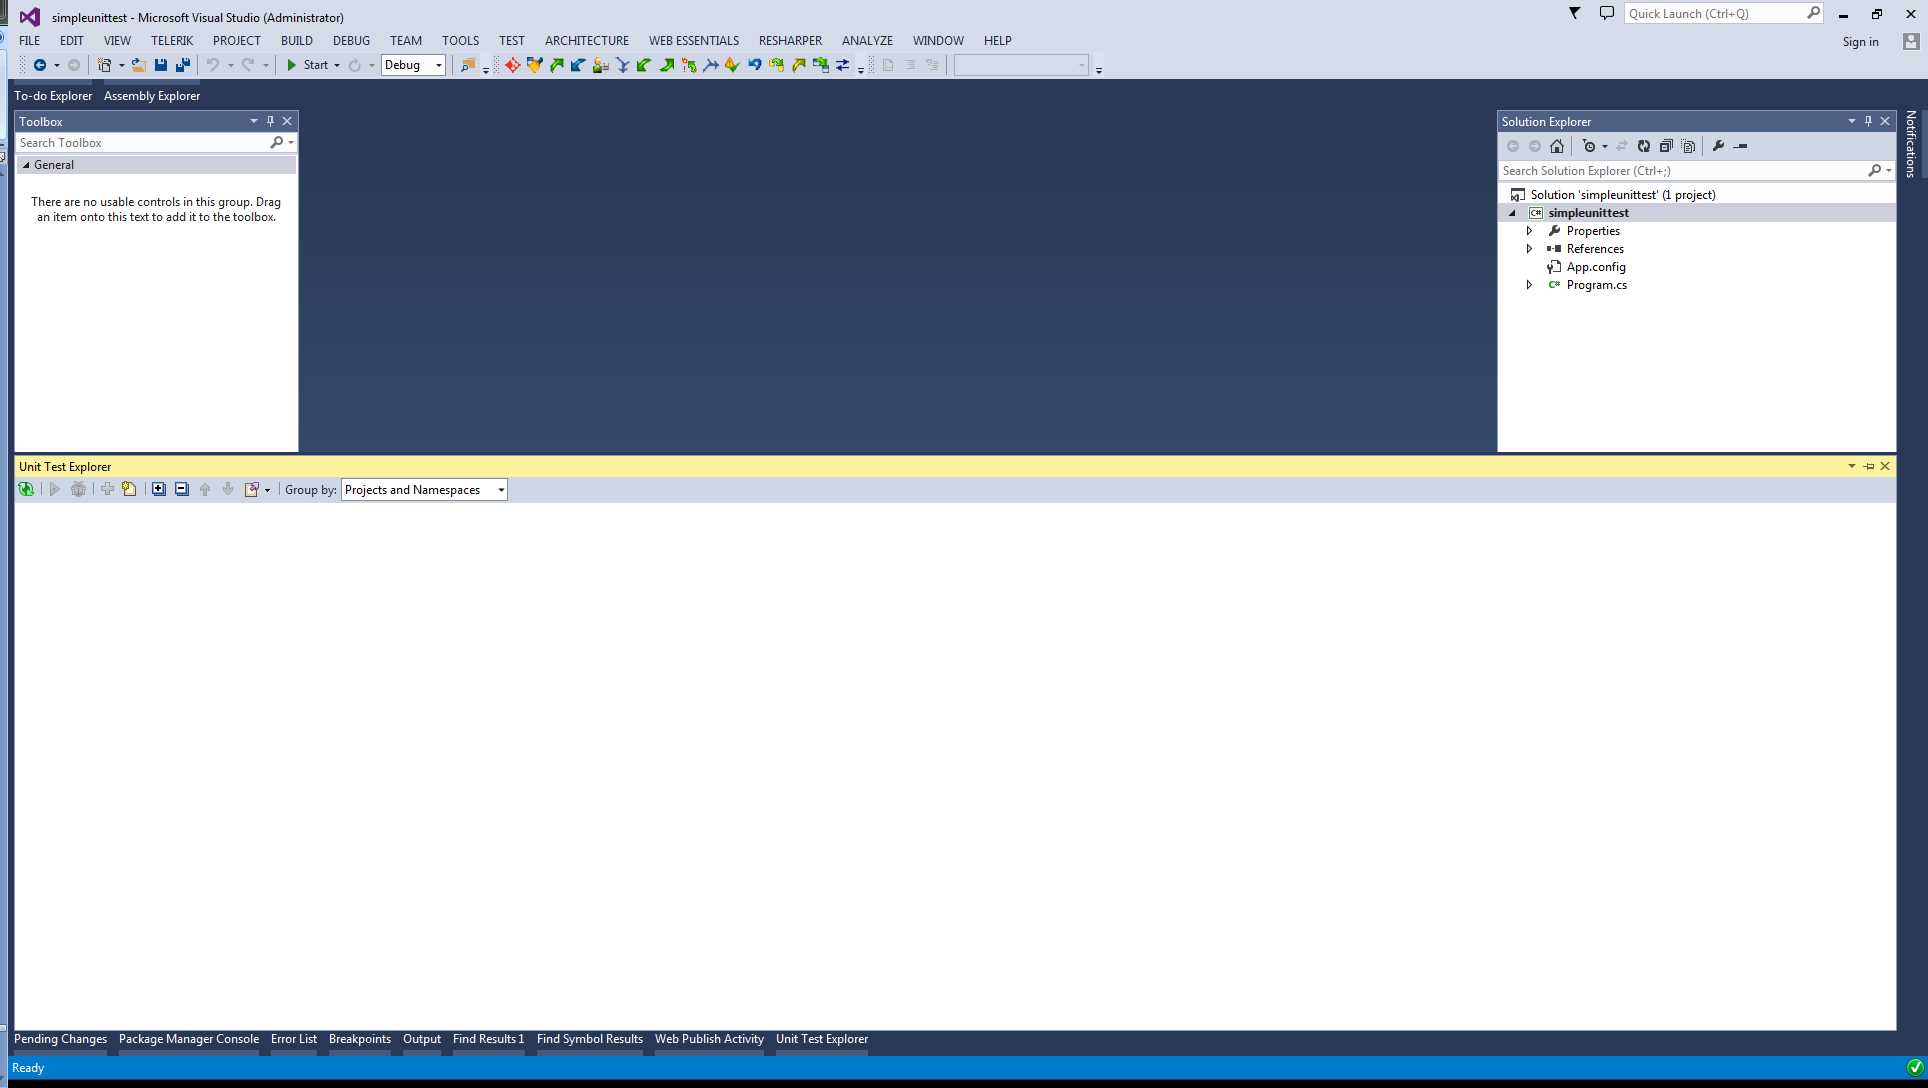
A sample project
For the purposes of showing the functions available, I've created a very simple Console mode project into which we’re going to add a couple of dummy arithmetic classes. We'll then manage the tests for these classes using the various R# options.
To start with, we just have a simple, empty project:

- Sample project ready to have tests and classes added.
Our specifications tell us that our arithmetic engine needs to provide functionality to add and subtract fixed values and a percentage, and to keep a running total. We should also be able to set an initial level when we create a copy of the class.
To get started, we'll create the following class:
namespace simpleunittest { public class Arithmetic { private decimal _runningTotal; public decimal RunningTotal { get { return _runningTotal; } } public Arithmetic(decimal runningTotal) { _runningTotal = runningTotal; } public decimal AddValue() { return 0; } public decimal SubtractValue() { return 0; } public decimal AddPercentage() { return 0; } public decimal SubtractPercentage() { return 0; } } } |
In addition to the required functions, each function should also return the new running total as a result. We should also have a constructor that creates a copy of the class with a default value of 200 in the running total, and a public accessor that allows us to read the running total at any time, but not modify it.
First we'll add a regular unit test project to our solution—right-click on your solution entry in Solution Explorer, then add a new project. Select Unit Test Project for the project type.

- Creating a unit test project
As is usually the case, Visual Studio will create a default test feature. However, if you look closely at the new file in the VS IDE, you'll see it looks a little different than usual:

- Initial test fixture created by Visual Studio
You'll notice that R# has been working its magic and added its own little icons in the left margin; these markers are R#'s control icons for your tests.
By clicking on an individual icon (such as the lower one highlighted in red in Figure 153), you can run just a single test, directly from within your test project. The upper icon (that looks like multiple icons) allows you to run all tests in a class.
The icon also serves as an Alt+Enter quick menu icon, and if you press the default R# key combo when your cursor is on the method signature, you should also get the following context menu:

- R# Alt+Enter menu for test fixtures
R# brings something to the unit test table that other frameworks do, but it provides it in a more convenient form, and that's the ability to set breakpoints on your tests and then debug them in exactly the same way that you use Visual Studio to debug production code.
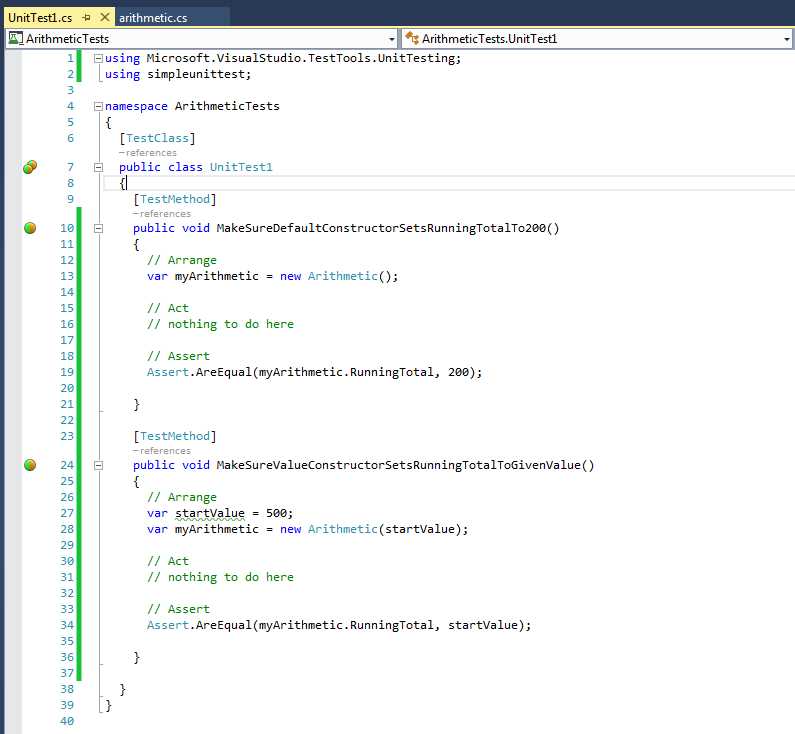
We'll come back to the debugging side of things in a little while, but for now let's create a test to new up and make sure our default constructors work.
I've created the following two tests for the constructors on our Arithmetic class, but as you can see, the class entries are highlighted in red to show that the unit test project can't find them.
This is a good point to use some of the tools seen in previous chapters to get R# to add the appropriate references for our test class.

- Our first unit tests in the VS editor
If I position my cursor on line 12 in my test fixture, then press the default R# key combo, we get the following pop-up menu:

- R# pop-up menu in our test fixture code
As shown previously, if you select the first option, R# will add a reference to the project, a using statement, and anything else needed to make sure the error is resolved.
Once we resolve these links, we can see our test code should now be ready to run.
- Our test fixture is now ready to rock and roll
If we click on our double icon at the top of our tests, we can run them. Let’s go ahead and do that:
![]()
- Clicking on the double icon gives us this menu
Select Run All, then after a moment or two (depending on the speed of your machine), you should get something like the following:

- Running a new test session using the R# test runner
As you can see from Figure 159, one of our tests has failed. Let's go take a look at why. If you click on the name of the failed test, the test runner will tell you the exact reason things failed.
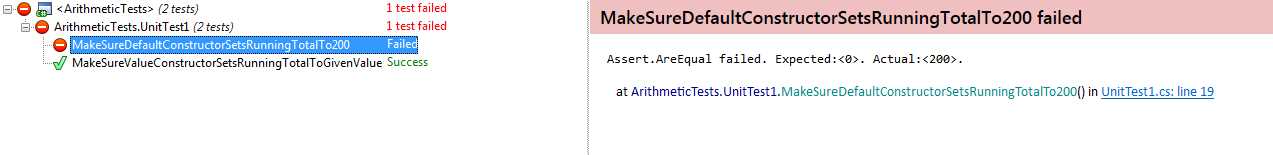
- Result from our failed test
You can see from the report in Figure 160 that the result from the assert was 0 when it should have been 200. If we take a look at the default constructor in our class, we'll quickly see why.

- Our default constructor is empty
We don't do any initialization of our running total in the default constructor; if we correct that and add this into the constructor:
_runningTotal = 200; |
Then re-run our tests:

- Re-run the previous test session
We should see that everything now passes.
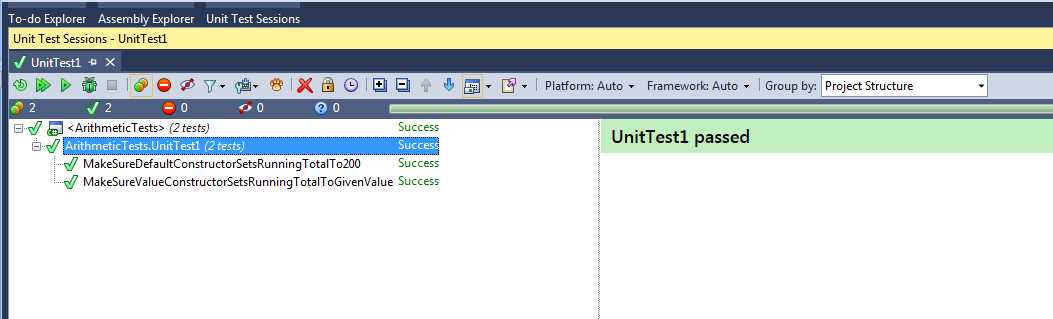
- Our tests are now successful.
We can now go back to our test project and add a new test fixture. This time we'll test adding a fixed value of 200 to our running total. We'll create the arithmetic object using the default constructor, so the running total at start should be 200.
Before we even get to running anything, we can see there's a problem.

- Before we even try to run anything, we can see a problem
Let's fix that first—we won't be able to run our tests if we can't compile things.
Change the AddValue method in your arithmetic class so that it looks like the following:
public decimal AddValue(decimal amountToAdd) { return 0; } |
Our test fixture should now have no errors and be able to run. If you go back to your test sessions window, you should see that R# has automatically added your new test fixture to the runner window.

- Unit test session with new test automatically added
As before, if you click the double arrow the tests should all be run, with the two previous still passing and the new one failing.
Again, you’ll see the test failure report in the test runner session window. However, if you look back at your test fixture code, you'll see that the left margin icon has also changed:

- Test fixture code after running the tests
The successful tests now have a small green tick next to them, whereas the failing tests have a small red “no entry” sign next to them to indicate that they currently don't pass.
Just this small change to the IDE means you can leave your tests running in the background and go straight back to work, knowing that when the tests finish, the results will be right there in front of you without needing to break off what you’re doing and context-switch to another task.
This instant feedback means you can just continue working through your test coverage with no interruptions and down time. Couple that with the following default keyboard shortcuts:
- Ctrl+U, L—Run all tests in solution.
- Ctrl+U, Y—Run currently open test session.
- Ctrl+U, U—Repeat previous test run.
And just as with everywhere else in R#, you save time and stay more productive, with your hands on the keyboard.
All while we've been doing this, the Unit Text Explorer has been quietly keeping track of our test coverage.

- R# Unit Test Explorer
You can run your tests from here, which will open your current session and trigger everything. You can export a list of your tests, or use it to navigate to the tests in your solution by double-clicking on them. Think of the Unit Test Explorer as a file manager for your unit tests, allowing you to organize them and see at a glance what you have.
You can export your tests in text, HTML, and XML formats by clicking the Export icon on the Unit Text Explorer toolbar.
![]()
- Unit Test Explorer, Export icon
When you choose to export, you get a data preview allowing you to either copy and paste the data, or choose a file to save it to.

- Text export of unit test list

- HTML export of unit test list

- XML export of unit test list
You can also perform the same operation in the test runner session in order to export your current test coverage into another application.

- Current unit test run

- XML export produced by the run in Figure 172
Taking the current state of your project’s unit tests, and being able to incorporate that data into your own coverage and management system, means you can easily graph test coverage and progress for project managers and business units, allowing instant dashboards and other tools to keep a near real-time update on a project.
Unit testing with R# as your companion is now easier and faster than it previously was. This is great because it allows you to get your focus back on the code and away from the admin side of things. And don't be fooled—I've only covered creating tests in C# here. R# gives the same level of detail and attention to tests written in JavaScript too.
All tests in a solution, irrespective of language, appear in the same windows and have the same left-margin controls for instant running and feedback.
- 1800+ high-performance UI components.
- Includes popular controls such as Grid, Chart, Scheduler, and more.
- 24x5 unlimited support by developers.