
ReSharper Succinctly®

CHAPTER 2
ReSharper as a Programmer’s Aid
As you've already seen, R# integrates perfectly fine into your general developer’s workflow, but as of yet we've not actually mentioned much of exactly what it does or indeed can do in this workflow.
Looking back at Figure 19 in the previous chapter, if I were to position my cursor on one of the shaded import lines, then press Alt+Enter and expand the menu, I should see the following:

- Expanded unused import action menu
Just selecting the first menu option on the first menu would remove only that unused import line, but as you can clearly see, there is also a submenu that allows you to make this change in all files in the same folder, in the entire project or even your whole solution. In this case we’re using the removal action. Many actions are only applicable to the immediate line they are placed on, and only a select number of actions have the ability to affect the entire solution. The entire process is known as Fix in Scope in the ReSharper documentation.
There is a list of available actions for these Fix in Scope menus on the JetBrains website.
(Note: The list in our example is for version 8; once version 9 is released, there may be more.)
If you click Alt+Enter followed by a couple of arrow key presses, you can potentially rid a solution with hundreds of files of every unused import warning in about three key presses.
You can also configure how R# responds to unused import warnings. If we expand the second option in the same manner, we should see something like the following:
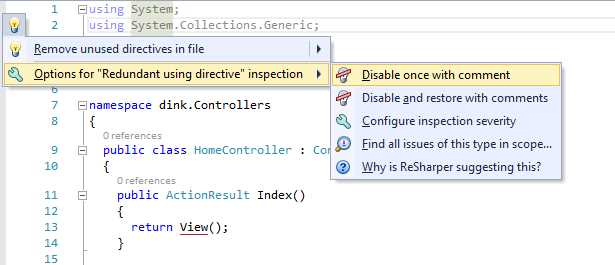
- Unused import actions menu inspection options
If you select Disable once with comment, the line in question will get wrapped with a specially formatted comment that R# recognizes. This comment will prevent R# from flagging the line as an issue to address, but this will apply only to the file in which the comment is placed—it will not affect inspection of the same issue in other parts of the solution.
The Disable and restore with comments option allows you to enable and disable the notification, if you just want to disable it temporarily, for example. This saves you having to delete the lines in the first option manually).
If you select Configure inspection severity, you should see the following dialog box:
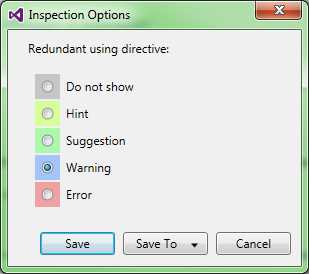
- Inspection severity options
This dialog box allows you to permanently set the global options as to how R# notifies you for the particular case being looked at. For instance, if you were happy to have unused imports left in your source code, then you might select Do not show; you will not be notified again about this particular case. If you mark something as an Error, then you'll get the red squiggly underline that's commonly seen when other errors are flagged in your source code.
Hints and Suggestions are the green underlines for possible improvements in your code, but these won't make any difference in operation if you choose to ignore them. Finally, Warning shows the issue as a warning in the ReSharper errors list.
How you choose to mark an issue is entirely up to personal preference. If you’re a team lead however, this is the first step you may want to take, to force your team to adopt a given set of standards (more on this in just a moment).
The last two options on the menu are Find all issues of this type in scope and Why is R# suggesting this? The first allows you to do a regular search operation just as if you'd pressed Ctrl + H, but instead of searching for a phrase or pattern, you only search for the issue that you’re currently inspecting.
Why does R# give you this option if it already gives you the ability to solve them all with a single key press? Well as I've already pointed out, there may be cases where you know you're going to be importing a library, for example, but for now you just want the import statement left there. In this case you might wish to find some of the issues, wrap them in comments, then go back and run the option to correct any other warning of that type.
By doing things this way, you can search out those that you want to treat separately with great ease, and then you a global fix on the rest. Remember, R#'s sole purpose is to make you more productive, and even though this feels like something minor, it could potentially (like many other R# options) save you more manual work that you realize.
The final option, Why is R# suggesting this?, is just a helpful aid to the developer designed to aid in the decision process. In our example it's only an unused import. However, it could be some other issue that the developer in question doesn't have a great deal of experience with.
If this option is selected, your default browser should open and take you to an explanation page on the JetBrains website describing the ramifications of the selected issue that looks something like this:

- Issue description on the JetBrains website
For our unused import issue, there's really not much to say, but other inspections have much more inside information available, and as you start to use R# more you may be surprised by some of the tips you pick up.
Revisiting the inspection severity options
If you recall when I showed you the inspection severity options (Figure 22), I mentioned that as a team lead this might be your first port of call in setting up some inspection options for your team’s projects.
Well, if you’re like me, when you first saw this, you might have thought "I like this idea, but it's going to take a lot of work to set it up." I initially thought this because I figured I'd need to find the options for every inspection I was interested in, then go through this single dialog box and make a decision on each one.
You'll be pleased to learn that you don't need to do this at all. If you open the R# options as we did previously, then go to Code Inspection > Inspection Severity, you'll find that you have every inspection that R# knows about right at your fingertips.
You can expand the trees of issues for a given file type in the right-hand pane, and configure how that issue responds to Visual Studio in exactly the same way you would have from the individual dialog box.
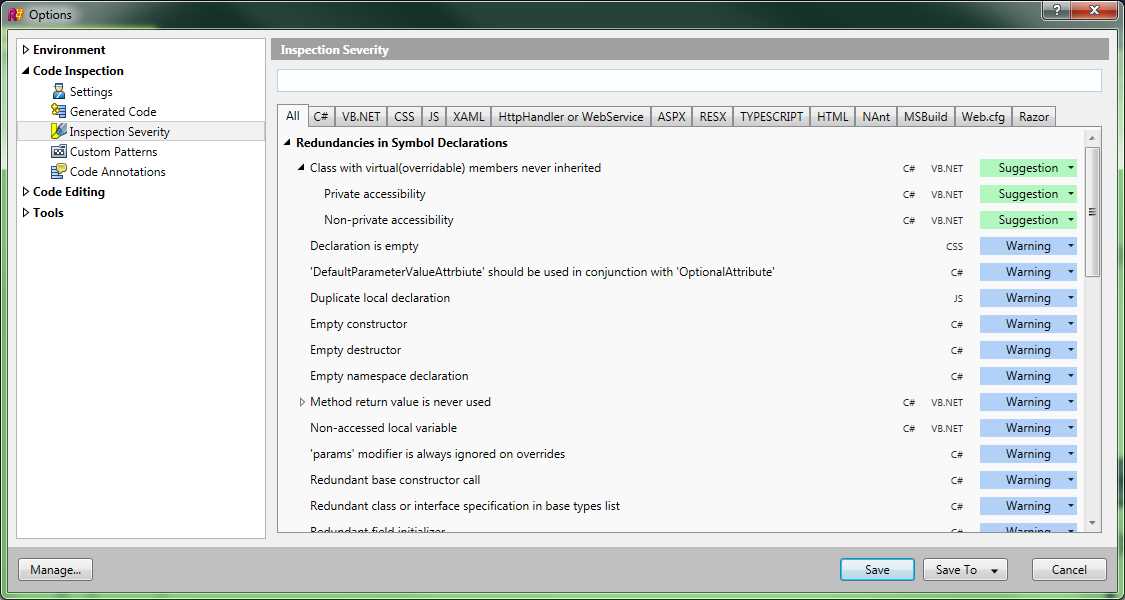
- R# Inspection severity options
If you look closely at Figure 24, you’ll also notice that there are two Save buttons on the bottom of the options dialog box. The first is just a regular Save button, and saves all your chosen options as the default options for your installed copy of R#. The Save To button, however, has more options.
If you click Save To, you should see the following three options:

- Save To options for the R# options dialog box
Selecting the first option saves the options directly into your active project. This allows you to have different settings for different projects, and if R# finds these settings when you load a project, it will use what it finds to override the current settings for that option.
The second option saves the file in the solutions directory alongside the existing solution files. The intention here is that this file is saved in your project’s source repository so that all team members automatically have the same settings.
The last option, This computer, saves the file in the default place that ReSharper would normally save its settings; these settings can then be exported using Manage Options (found on the main ReSharper menu). Typically, exporting options allows you to spend time setting up collections of settings and file them away to reuse them in the future—simply load them when starting a new project.
The options for saving to different stores are the very thing that allow a project lead to enforce a given set of standards, giving them the option to maintain control over the generated code. Remember too, that when you save these option sets, it's not just code severity settings you’re saving; you’re saving any options changed from the defaults in ReSharper.
Which inspections can ReSharper do for me?
To close this chapter, I'm going to show you just a few of the different code inspections you’re likely to see regularly. Producing and describing an entire list of every single thing R# will look out for is way beyond the scope of this book—there are so many things that R# can watch for, I could easily fill the rest of this book, and quite possibly another two!
You've already seen one of the most common ones, the unused import; this is an easy one to understand. If you do a lot of ASP.NET MVC programming, another one you'll likely see often is the missing view inspection:
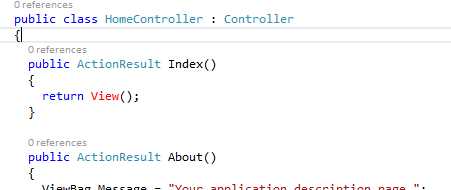
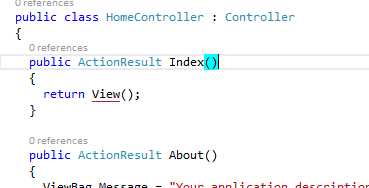
- ASP.NET MVC Controller with a missing Razor view
In this case you can see that rather than underlining it with a squiggly line, it actually displays the keyword in red.
Note: In Figure 26, you can see a line that reads "0 references". This line is not a part of ReSharper, but part of a Visual Studio 2013 Ultimate feature, called CodeLens.
It all still works the same way though. If you position your cursor on the word and press the default R# key (Alt+Enter), you should get the following menu:
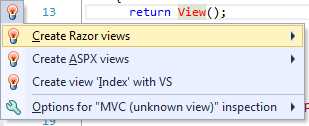
- Inspections menu for a missing MVC razor view
If you expand on the various options using the arrow keys, you'll see that you get straightforward options to create partials, create a view with a layout, and all the normal options you’re used to.
You can also select Create index with VS to get the normal Visual Studio dialog box up, and you have the same options for notification as you saw previously.
You'll also see that in this case the light bulb in the menu is red. This is showing you that this is a serious error, and if left unattended, it may cause your application to break when deployed.
If you go ahead and fix the issue by creating a view, then come back to your code, you might notice that it now looks slightly different:
- MVC Controller code after fixing view issue
You'll now see that you have a solid red line under it now. Don't worry though, this is not a bad thing; what you’re looking at now is ReSharper's view navigation feature, which allows you to quickly navigate directly to a controller’s view with minimal effort.
One other thing that R# does for you is to provide extra navigation features. If you position your cursor on the View keyword, but this time instead of pressing Alt+Enter, press F12 (or hold Ctrl and click with your mouse), you should get the following menu:
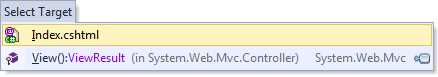
- R# F12 menu on an MVC View keyword
If you then press Enter on the first of those options, you'll be taken directly to your Razor view code. If you select the second, then you'll end up in the object browser right on the appropriate view result assembly in the .NET Framework.
This solid underline can also be found in other places. For example if we take a look at our Razor views, specifically where we generate links, we may see something like this:

- R# solid underlines in a razor view
You'll see immediately when you move over this, that you have a menu icon in the left-hand column. As before, the left-hand icon tells you that you have an Alt+Enter menu available; however, if you also position your cursor on one of the underlined options and press F12, you'll also be taken straight to the controller in question that this link would refer to.
Where you see solid underlines, you'll likely have operational choices too. These choices range from navigation aids to procedures that you might commonly want to do, such as splitting a long string into two separate strings. The key thing here is that if it's solid and not squiggly, then it's not likely to be an error; if it's a squiggly line, then depending on its color it will be either a notification, hint, warning, or an error.
To give you an example of a green squiggly, the following image shows a snippet of code from a default account controller produced using the ASP.NET MVC 5 web application default template:
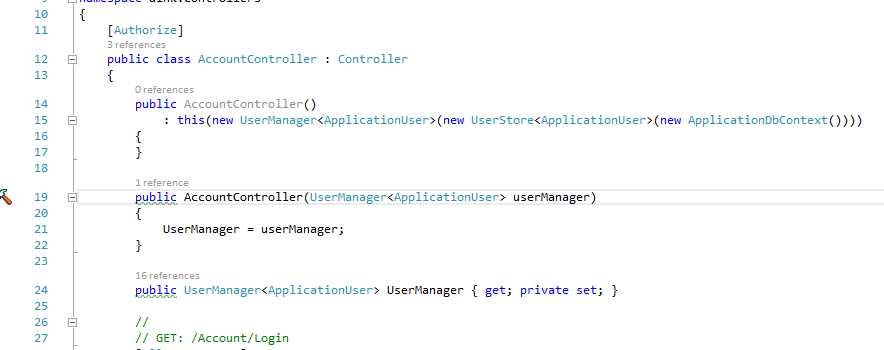
- Snippet of code from the ASP.NET MVC account controller
You'll see that the public keyword in the two cases shown is underlined in green; this would mean that you're looking at either a hint or a suggested improvement.
If you position your cursor on it and press the default R# key (Alt+Enter), then you should see the following menu:
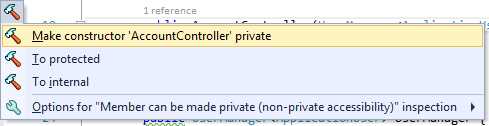
- R# suggestion menu for the public keyword
If you actually hover over the option prior to opening this menu, you'll see that R# tells you it is possible to make the constructor private, and so the menu reflects this with appropriate choices for actions you might want to take.
In this case R# has analyzed your project source code, and realized that the constructor is never called from any external code. This means that you can seal that method away, or even remove it all together. Inspections like this help make your object-orientated code much better by removing public hook points that may never get used, or identifying code that may be surplus to requirements, leading in the end to a much simpler code base.
R# doesn't only make you more productive, but after a while you'll also find that you start to spot these good practices yourself and actively remove them—or even not add them in the first place. In essence R# actually trains you to be a better developer.
And there we go—that's the 100-foot overview of R#. Going forward from here, we'll start drilling down into the various menus available from the Visual Studio toolbar and take you on a tour of the specific R# tools that are at your disposal.
- 1800+ high-performance UI components.
- Includes popular controls such as Grid, Chart, Scheduler, and more.
- 24x5 unlimited support by developers.