
ReSharper Succinctly®

CHAPTER 4
Find and Editing Tools
You could be forgiven for wondering why R# has an entire section devoted to finding things—after all, most of the navigation tools we covered in the last chapter are designed for that, right?
The answer here is actually a yes and a no answer. Why? Well the navigation tools are designed to get you around quickly and efficiently. In a way, they do have to search for things, but that search is often very general and not specifically targeted to a particular point in time.
Yes, you can use the navigation tools to jump from method to method, but what if you don't know the method name or place to start?
That’s where R#'s Find tools come into play.
Say you’re jumping around between tabs that you have open, and you can't remember which tab a particular function is in, but you remember it starts with "abc." Most developers working in Visual Studio will instinctively press Ctrl+F to bring up the find.
R#’s Find tools work in a similar way; they are designed expressly to find something that you’re not entirely sure of.
Finding Usages
In a complex project, you might have many dependent modules and layers, especially if you follow n-tier style architecture. Presentation layers might use business layers, which in turn might use data layers, and everything may be all cross-cut with security layers—and that’s before we start thinking about things like attributes in MVC projects and NuGet dependencies across the board.
If you have a data library for example, you might want to know which parts of your solution it’s used in. For this task you can use the Find Usages option.
Position your cursor on a method anywhere in your project. I’ve picked a class in my intranet application that uses Yahoo Query Language (YQL) to get the news local to my area. I want to see which parts of my project use the local news feed, so I right-click on the method declaration, and select Find Usages from my context menu:

- Selecting Find Usages from the Context menu
You can also use the main R# menu in Visual Studio by clicking on ReSharper > Find > Find Usages. Find Usages by default doesn't have a keyboard shortcut setup, but like everything else in R#, this is easily changed in the keyboard options.
You'll also note that there's a Find Usages Advanced menu option too; if you click on this one, you'll get a different dialog box altogether:

- R# advanced find usages dialog box
By default, the Find Usages tool only searches for code-based usages at a solution level. The Advanced dialog box allows you to be more precise with your searches, and allows you to perform tasks such as searching in comments and looking for dynamic uses.
You can narrow the scope down too, so that rather than searching the entire solution, you can search only the given project. You can also look for overloads of your methods, which is especially useful when using a lot of abstract classes.
Moving on down the menu brings us to Find code dependent on module. This option is one for the NuGet fans among you. If you expand the references section of any of your projects, and right-click on any of the references in the tree, you'll see that this option also appears on the Context menu, as Figure 51 shows:

- Find Code Dependent on module, direct from the Solution Explorer
When you select this menu option, R# will find all the code in your current scope that references the selected module in your references.
In Figure 51, I've right-clicked on my Data Access layer, so once I click the left arrow button to select the option, I'll immediately get a list of all the places in the current project where that library is in any way referenced:

- R# searching for references to the current module

- The results of the search that took place in Figure 52
Once the Find Results window appears, you can dock it into the Visual Studio environment just like any other panel, and double-clicking on any of the entries will take you directly to that location in your source code.
Multiple searches will also open multiple search result tabs in the same panel, so you can easily search on a number of different packages, then keep the lists open for rapid access.
The next option, Find Symbols External to Scope, works best at a project level. When used correctly this option will search for and list any external references to the selected file, module, or project. If we try this on the WebUI in my intranet project, you'll get a list of anything that the project depends on (and knows about) to function correctly.

- Results for Find Symbols External to Scope on the WebUI project
As you can see, I can instantly build up a picture of exactly which references are used and which are not, allowing me to easily remove redundant links and promote smaller, quicker builds.
The Optimize References option is designed to do exactly that, so that we don’t have to do it manually. Right-click on the References branch of a project in your Solution Explorer, and select Optimize References. After a short while, you'll get a report showing you exactly which references are and are not used, how those that are used fit into the big picture, and which references R# believes can be removed. The result should look something like Figure 55:

- R# optimize references report
You can then use the various tools along the top of the report to organize and act upon R#'s recommendations.

- Organize References toolbar
Remember, though—this is not guaranteed to get everything 100 percent correct. Some libraries use some very clever tricks to get themselves where they need to be, and occasionally R# cannot detect their usages correctly.
To be safe, ALWAYS save your project and back it up before you make this kind of large-scale change. That way if anything does go wrong, you can easily go immediately back to where you started.
Pattern Searching (the Holy Grail of “Find all the things”)
The final search tool has to be one of the most powerful search tools I've ever seen in any code editor or IDE. I generally don't do meme culture, but in this case it's absolutely justified:

- FIND ALL THE THINGS meme
Pattern searching goes above and beyond searching for simple strings, and instead introduces you to a whole new concept of being able to visually create complex search scenarios that are geared towards examining code in ever-increasing, specialist ways.
You can also use the R# options dialog box to permanently save collections of often-used search patterns, which can be shared with other members of your team, as mentioned previously.
Structural patterns can also go one step further. You can define them, then set them up to eliminate common code smells. You'll see more on this later on, but for now, know that R# constantly keeps an eye on your code as you type. As it does this, it watches out for common patterns that developers use and suggests improvements.
For example, R# might watch for “For Each” loop usage where the entire loop can simply be replaced with a single LINQ style select statement.
Using structural patterns, you can easily set up your own solution-wide code smells detections and then decide how you want them to be handled. A practical example will help demonstrate what I mean. The following image shows a snippet of code from a project a recently converted from Java source code:

- Snippet of C# code converted from Java
A common pattern used by Java programmers is to use the Format function with the Java implementation of the StringBuilder class to produce formatted strings. This converts quite easily to C#, because all we have to do is prefix the Format calls with string, and everything is good.
C#'s string builder, however, has an AppendFormat method, which takes exactly the same parameters as string.Format, but gives much neater source code.
Let's use R#'s structural patterns to detect, notify, and help change this code smell.
Click ReSharper > Find > Search with Pattern to get the pattern definition dialog box open:

- R# Structural search pattern dialog box
If you look at the converted code, we want to search for an expression that is of the StringBuilder type, followed by a period and the keyword Append. This keyword is then followed by the phrase string.Format(), which contains two arguments—a format string and a variable number of parameters. In your Search pattern dialog box, enter the following structured search string:

- Structural search pattern to find converted Java code smell
The $SB$ part at the beginning represents the string builder expression, the $FORMAT$ part represents the format string, and the $PARAMETERS$ section represents the remaining parameters in the string.Format call. If these are initially red instead of blue, you need to define them and their types.
In R# 8.2 however (compared to earlier versions), I was pleased to find that R# automatically figured out what I was doing and set the parameters up for me. Even if you have this capability, you still need to tweak the parameter settings, however.
To the right of the structured pattern dialog box you should see a section that looks similar to the following:

- Structured Search parameters
If you don't already have anything added, use Add Placeholder instead of Edit in the next set of actions.
Click on (or add) SB, then click Edit. You should see the following:

- Expression editor for the SB parameter
Ensure that Expression Placeholder is selected, the Name is set to SB, Expression type is set to System.Text.StringBuilder, and that the box beside Exactly this type is checked. Then click OK.
This will ensure that R# only searches for expressions that are of type string builder and followed by Append, while honoring the other criteria also.
As you did with the SB parameter, click on FORMAT, then click Edit and bring up the properties for that token:

- Expression editor for the FORMAT parameter
For FORMAT we want one occurrence of a string, and one only; we also want to make use of the matched text soon, so we want this to be an argument placeholder. Make sure the settings for FORMAT match those in the dialog box in Figure 63, then click OK.
Finally, do the same for the PARAMETERS token; this one will be used to grab anything that's left in the string.Format call. Because string.Format takes a variable number of parameters, we need to ensure that we grab them all.
Set the PARAMETERS options up as follows:

- Expression editor for the PARAMETERS parameter
You'll see here that we want to ensure there's at least one parameter, but we don't really care how many more there are beyond that, so we specify a minimum of one, and no maximum.
If you set Look in (near the bottom) to Current File and click the Find button, you should end up with something similar to the following (assuming you’re using similar code):

- Results from the string builder structured pattern search
I only set it to Current File because I know this is the only file that has this pattern, but I could have easily set the search to be solution-wide, and then gone through and found every occurrence of this pattern in my solution.
For now, just close the results, then from the R# menu, reopen the Search with Pattern dialog box.
If you look toward the top-right corner of the dialog box, you'll see two buttons: Find and Replace. If you click Replace, your dialog box should change to look like the following:

- Structured search dialog box with replace options enabled
What you can do now is to enter a replacement string in the lower box, which can use all the parameters you specified in the search. Enter the replacement pattern into the lower half as follows:

- Replacement pattern for our code smell example
If everything is ok, you should see that your Find button near the bottom of the dialog box has changed to Replace. Go ahead and click it. You'll get the normal selection box to decide which ones you want to replace, and with a couple more clicks you should find that you quickly eradicate those nasty code smells and make C# a happy place to be once again.
Impressed? We still have one more trick up our sleeve—press Ctrl+Z to undo that last change and bring our code smells back.
Once we have our original string.Format lines reinstated, head to ReSharper > Options > Code Inspection > Custom Patterns. You should end up with something like this:

- R# Options dialog box for structured patterns
If you click Add Pattern, you should see your original pattern still in its editing box show up, just like the following image:

- R# pattern editing box called from Options
This time however, you should see there are now two description boxes, one under each of the editing inputs. These descriptions are used by R# in the code editor to highlight and point out code smells that match the “append” one automatically.
The first one is used by the tooltip; when you hover over a highlighted pattern in your editor, the second one shows up as the name in the Alt+Enter quick-fix menu. For now, add Usage can be changed to AppendFormat in the first description, and Change to use AppendFormat in the second. You'll also see that you have a Pattern Severity dropdown menu. You can change this to any of the warning and error conditions we discussed earlier in the book. If you set it as an error, then you can actually prevent your project or solution from being built if it contains any matches to this pattern. For now let's change the severity to Show as Warning, and then click Add.
If you now click Save to save to the default settings location, then look at your editor, you should see you have yellow warning marks in the right-hand margin and colored underlines with tooltips under each of the lines.

- Visual Studio editor showing R#s reaction to the append structured pattern
Press Alt+Enter or click on the Quick Fix menu, and you'll see the replacement description now appears as an option:
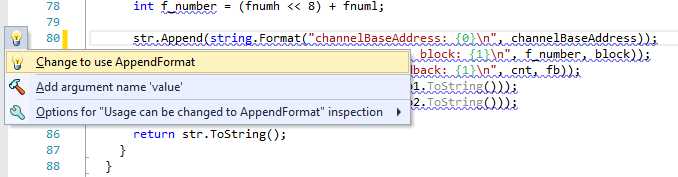
- R# Quick Fix menu showing the fix option for the append code smell
As expected, selecting the menu option, or double tapping Alt+Enter will quickly fix the issue just as you would for any other R# Alt+Enter action.
I'm sure you can think of a lot of creative uses for this. I have structured patterns set up in mine to quickly switch between data access technologies for example; this is done by looking for "SQLite*" style patterns and replacing them with "PSql*" which when activated, allow me to quickly replace connectors, string builders, table adaptors, and all sorts of other things easily and quickly. Remember too that these patterns are saved to “team-shared” settings as described previously, which means that when you set them up, and share them, your entire team then has access to them.
The last three options on the Find menu are all have to do with marking and navigating to those found areas in your code. Highlight usages in file, where appropriate, will close any search dialog box you might have open and place a highlight on any match to any search you just performed.
These highlights can and will span multiple files if that’s what you asked for. Solution-wide, project-wide or even just local to a file, every match that matches the criteria will be highlighted.
To help with this file spanning, you'll find the two final options presented in the Find menu are Go To Previous Location and Go To Next Location, which do exactly what they say on the tin, and allow you to jump back and forth through your search results with a simple key press.
Editing Tools
In the last section of this chapter, we'll turn our attention to the editing tools that R# provides for the developer.
As with the previous sections, we'll start off with an expanded image of the main menu:

- R# Edit menu
Many of the options you see here are dedicated to completing the statements you’re currently typing, or the snippets and variable names you may be currently working on.
Complete Symbol, for example, is functionally identical to the normal Visual Studio IntelliSense that most VS users see every day.
Import Symbol, on the other hand, is like IntelliSense on steroids. This option will not only look for matches within your local namespace, class, or other local object, but it will look at the entire landscape of your current project or solution. Then it will present a list much like the normal IntelliSense completion list, with the added option of listing namespaces, assemblies, and anything else that is also reachable from your current source code position.
If, for example, I have AutoMapper installed as a NuGet package in my project, but have not yet added a using or other reference to the library. I could start typing one of AutoMapper's symbols and import symbol will correctly identify that; the mentioned reference could be reached by including a using clause to AutoMapper.
Not only will R# then complete the statement for me, but it will also ensure that any using statements or further references required to make things work are also added into my current source file.

- Import symbol completion pop-up menu showing AutoMapper before it was registered.
The next menu option is Smart Code Completion, which, like the previous two, is designed to complete the statement or part thereof that you’re currently working on. What makes Smart Code Completion different to the others however, is its treatment of variables and types.
Smart Code Completion ONLY displays candidates that are either of the same type or a compatible type, or can be confined to the same interface, object, or abstract type as the entry you’re typing against. This means that smart completion is mostly geared towards completion of function parameters, or already declared and known result types.
It reduces the chance that you’ll add code errors to your project by simply not giving you the choice of something that it knows will not work. While it's still not foolproof (you can assign an integer to a double, for example), it does prevent many of the mistypes that you often see in code produced by junior and trainee developers.
If you’re working to a specific interface, then it helps by only listing class types that conform to that interface, rather than listing objects that are spelled similarly or in the same type family, which can often shorten the list of choices you have and make a menu easier to navigate.
Complete Statement is an amalgamation of all of the above menu options, and just serves to wrap everything up under one menu. The advantage here is that you can perform all three types of completion in the same action. In my case I don't have shortcut keys set up on the other three options, only on the final one. When my custom shortcut key is pressed, I get to select the best option from the menu at the appropriate time.
The last two options in the top group are mainly to help you as a developer from a documentation point of view. When your cursor is placed inside an area of your source code that takes parameters, activating the Parameter Information option will display the parameters information tip as follows:

- R# parameter information tip
The parameters tip will show you the parameters from any code in your solution, or from any framework and third-party libraries you might have loaded. It does this by periodically examining the landscape of your application, and caching what it finds available in the metadata of the loaded assemblies.
Show Quick Documentation is also a similar development aid, in that it attempts to give you a miniature help view of the function or method call you’re currently positioned over:

- R# quick help pop-up menu
Just like the parameter tip, this will also attempt to automate documentation for your own code and projects in your solution. If you use the XML commenting system built into Visual Studio, and mark up your methods correctly, quick help will build on-the-fly doc tips like those above, and display the required information for developers writing software against your own in solution toolkits. If the call is against .NET framework or other third-party assemblies, then it will do its best to obtain either symbolic information or metadata where it can.
In the case of the .NET base libraries, R# has a lot of these tool tips built into its internal product, ready for use. The default shortcut key for this is Ctrl+Shift+F1.
- 1800+ high-performance UI components.
- Includes popular controls such as Grid, Chart, Scheduler, and more.
- 24x5 unlimited support by developers.