
ReSharper Succinctly®

CHAPTER 6
Code Inspection Tools
One of ReSharper’s main features is its ability to tell you where you can improve your code, and while a lot of this functionality is pretty much automatic, there are a number of things hidden under the hood to help you even further.
Like other tools, most of these are accessible from the main RESHARPER menu under the Inspect submenu.
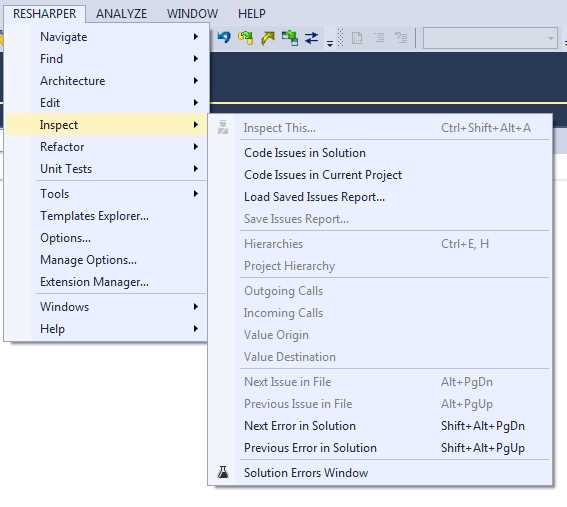
- R# Code Inspection menu
Everything here, like the majority of R#'s toolset, is context-sensitive, so the options you have available will depend on where you are in your project.
To kick things off, we'll start by examining the global options, which can be seen in Figure 107.
When you’re working with R# as your guide, you'll already be aware that you get different colored squiggles, warning and error ticks, and other helpful indicators.
In many cases, you don't actually need to address those as you see them. Using the Code Issues in Solution, Code Issues in Current Project, and Load Saved Issues Report, you can get the overview of anything that R# thinks needs your attention.
As the name suggests, one option covers the entire loaded solution and all its projects, and the other covers only the project you currently have open in your editor.
Opening a project view in my editor and selecting Code Issues in Current Project gives me the following view:

- Code issues in Current Project
The window that opens for your project is exactly the same as that for a solution, just likely with fewer entries, depending on how large the solution is.
You can immediately see that by default, issues are grouped into functional areas. This is deliberate so that your thought train remains in similar areas of concentration when working through the items in the tree. As developers, we’re all too painfully aware of what it's like to context-switch between vastly different subjects. Dealing with potential code changes, errors, and changes is no different.
Jumping from, say, an advisory that you can change something to a LINQ expression, to a bunch of missing symbols and syntax errors, is just as challenging as changing tasks, so to me, the default organization shows great thought from the product designers regarding how developers might use R#.
In Figure 109, you can see that all the issues I have in the project I'm looking at are warnings, and if we expand the redundancies in the code tree for example, we can clearly see what the issue is. If we then double-click on any of those issues, we'll be taken directly to the location in our project where that issue occurs.
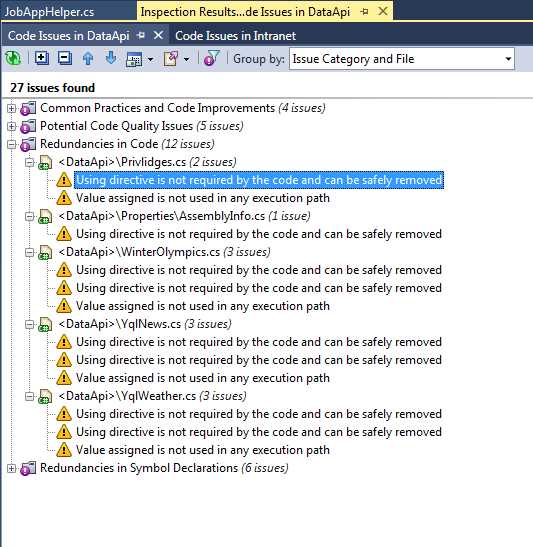
- Code issues in project expanded to show warnings
If you think back to previous chapters where we covered finding similar issues, you quickly see that just from one entry in one project, you could potentially eradicate many issues with just a few key presses and mouse clicks.
If you’re the tech lead on a project, it gets better. Just above the issues tree you'll see a toolbar that allows you to effortlessly move from issue to issue, collapse and expand all nodes, and more.
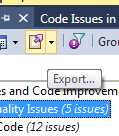
- Export button on Issues toolbar
The Export button shown in Figure 110 allows you to export the entire list to a file, which can then later be reloaded using the Load Saved Issues report option on the Inspect menu.
With this option, you can isolate sets of issues for specific team members, and then pass those lists to team members in an email, or attach them to a bug tracking system, allowing you to easily delegate tasks and keep track of what's being done.
Inspecting variable value flow
If you open a source file in your project, then move to and optionally highlight an assignment to a variable or property:
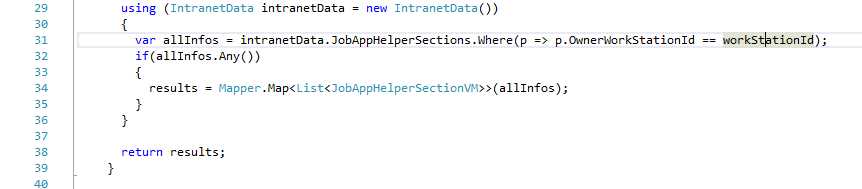
- Code snippet showing a variable being used
You can then open the R# Inspect menu and choose the Value Origin option. R# will open an inspection window showing you the exact source of the selected variable, allowing you to instantly pinpoint where its value was last set.
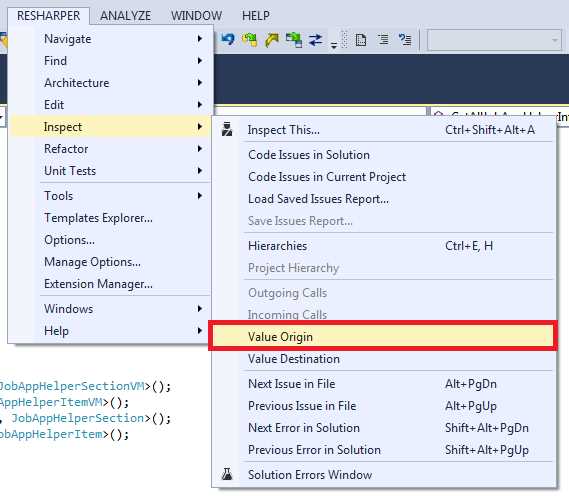
- R# Inspect menu showing Value Origin option
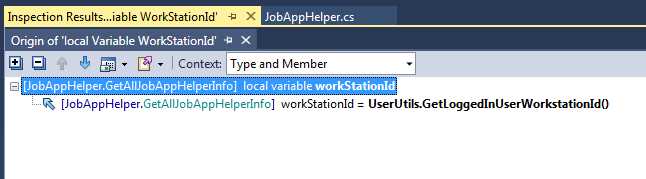
- Inspection results showing the origin of a variable
Pinpointing the destination of a variable is just as easy—select Value Destination from the same menu, and you can just as easily go the other way. Using these two options allows you to easily track the progress of a value through any piece of code without having to read and follow every line.
As an example, this helps a great amount when following code in an if-then construct, as it gives you the option to traverse deep into any of the clauses and then instantly backtrack to get the source value used to make the decision in the first place. If you’re rewriting old code, particularly spaghetti code, then this is a real time saver.
In the code in Figure 111, you can see that we have a custom data context called intranetData. If you’re working with this code, you might want to know the namespace tree where this custom type is defined, possibly even leading right back to its base object. R# also has this covered.
In your code, position your cursor on a line with a custom data type in it, then select Hierarchies from the Inspect menu. This will produce a window showing you the type path leading all the way back up the chain to the base object, and everything in between.
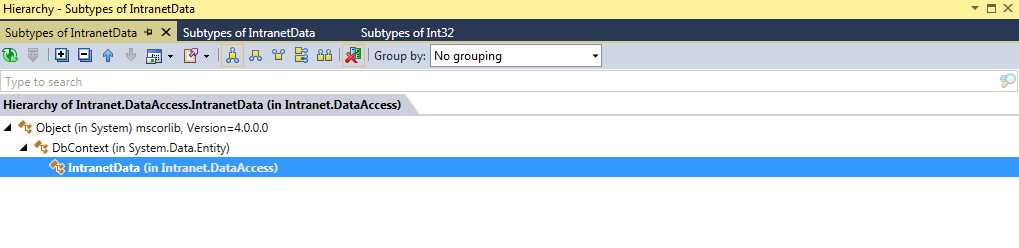
- Type Hierarchy inspector
Like any of the other inspection windows, you can double-click on any entry in the tree and be taken to the appropriate location in the appropriate viewer. If the source for a module is available, then a source view will be provided; if not, the assembly viewer or object browser will be used instead.
Inspecting method flows
Variables and properties are not the only things to get the all-star treatment when it comes to inspecting and analyzing your projects. If you open up a source file, and position your cursor on a function call, then use the inspect menu to select Incoming Calls, you can easily get a list of each place in your project or solution that a call to that method comes from.
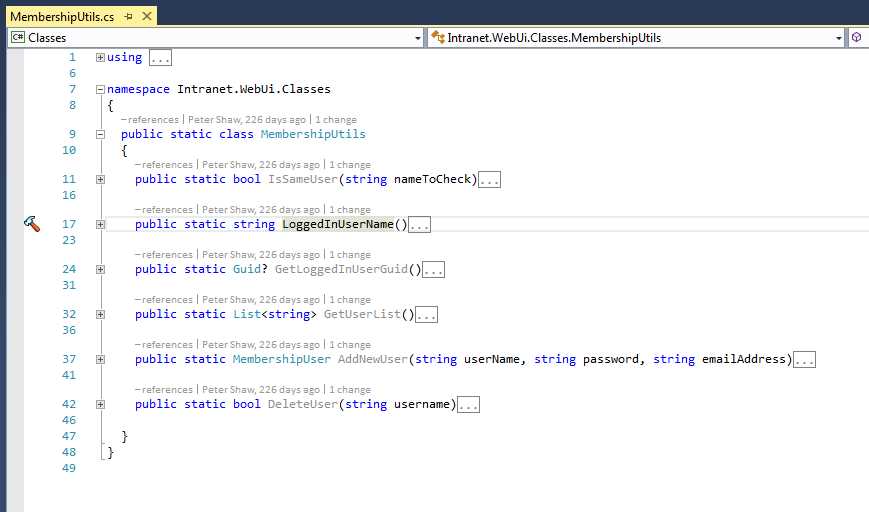
- Code sample showing a utility library
In Figure 115 only one usage of LoggedInUserName was detected, and this was used in one of the project’s Razor views.
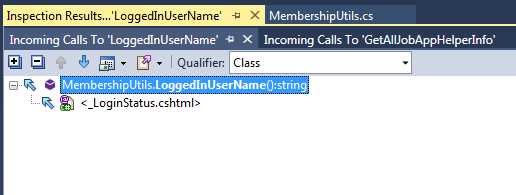
- Incoming calls tree for selected method in Figure 115
The inverse is also available—if you select Outgoing Calls from the same menu, R# will then show you all the methods used by the selected function or method.

- Outgoing calls for the selected method in Figure 115
In a very short space of time, it's possible to inspect a section of code for potential issues, then find exactly what calls and what is called by the highlighted code. This ease of navigation and understanding of a complex project makes the task of getting to grips with a new code base easy right from the start.
The remaining options on the inspect menu are all amalgamations of the other issues, or exist to allow single shortcut key-press navigation following the main mantra of R#: allowing the developer to keep his or her hands on the keyboard while coding.
- 1800+ high-performance UI components.
- Includes popular controls such as Grid, Chart, Scheduler, and more.
- 24x5 unlimited support by developers.