
ReSharper Succinctly®

CHAPTER 9
Architecture Tools
Once you've bent, refactored, and tested your solution to destruction, then the last thing you need to do is examine the 1,000-foot view to ensure that your overall architecture looks exactly the way you planned it to.
It comes as no surprise then, that R# also has that covered too.
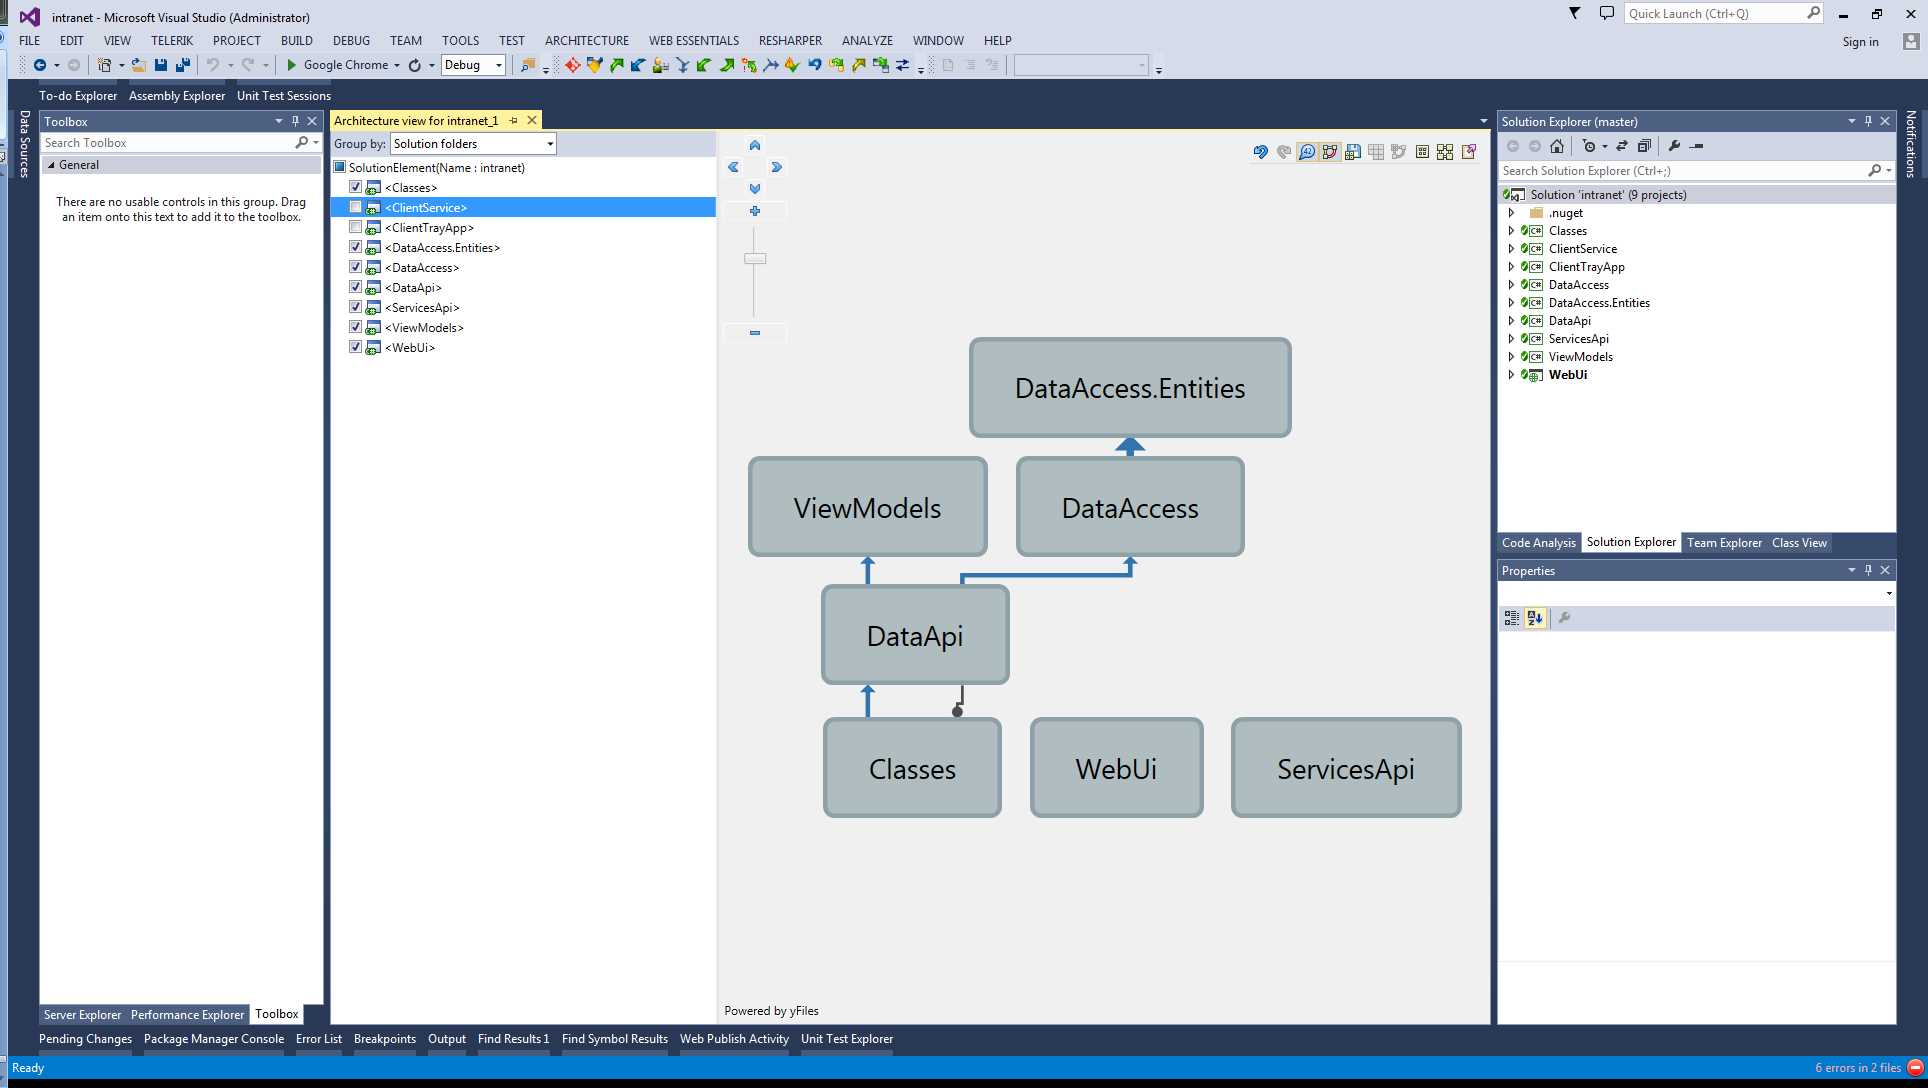
Left-click on the Solution node in your Solution Explorer, then head to RESHARPER > View Project Dependencies, and you should get something similar to the following:

- The R# architecture explorer
You can immediately see the big picture, and you instantly have tools to zoom in, move around and export, and manipulate the diagram in different ways.
The first two controls (blue arrows) are the Undo and Redo controls, allowing you to move back and forth through changes in your diagram.
The third button is the Coupling Analysis control. This control turns R#'s deep inspection of the references between modules in the solution on and off. It generally runs in the background, and on large solutions, may take several minutes to complete. Allowing it to run (it’s on by default) means that R# can build an incredibly detailed picture of the architecture, but at the expense of waiting for that diagram.
The fourth button is the Show/Hide transitive references icon. With this on, links between modules are collapsed into one single link, and with it off, independent multiple links between modules can be seen. With a large project, this can make a lot of difference in the readability of your diagram.
The fifth button, with a small disk image on it, allows you to save the currently displayed architecture file to disk—not just to safeguard a copy of the diagram, but also to allow future comparison.
If you go back and look at the architecture menu on the main VS toolbar, you'll see there's a second menu item allowing you to load a file for comparison.
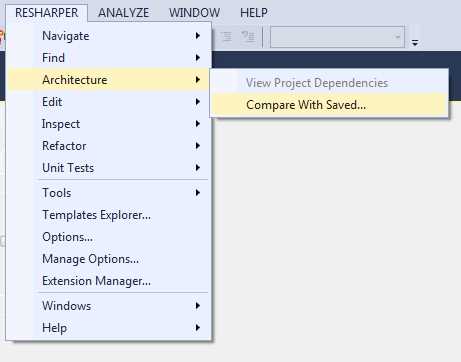
- ReSharper Architecture menu showing Compare With Saved
The idea here is that you can take snapshots of your architecture as you develop it, then run comparisons on the project to see what the differences are over a period of time.
You'll see that the sixth button along in Figure 174 is what looks like a small grid. When you have a saved file loaded in alongside the current architecture diagram, clicking on this icon will ask R# to generate a human-readable description of the differences it finds between the two models.
Continuing on, the next button is the Show Possible Paths button. In my screenshot in Figure 175, this option is dimmed due to the fact that the solution I have loaded is simply not big enough, or complex enough, for it to work effectively.
The Show Possible Paths function is typically used when you have large, multi-solution projects open, or when you create a dependency graph from many different items at project level, rather than a singular one at solution level. The tool is used to analyze the current architecture and detect possible violations, such as circular references, or links between modules that where unintentionally placed via references to other modules.
The next two buttons are used to collapse and expand the nodes in the graph, and the final button is used to export a copy of the currently displayed graph, out to a PNG file for use elsewhere.
In Figure 174 you can also see that to the right of the diagram is a list of the projects included; un-ticking the modules you don't wish to see will remove them from the diagram. In my case, If I un-tick ClientService and ClientTrayApp (since they are not direct dependencies of the overall project), my diagram reorganizes itself to remove those two modules.
- R# Architecture view, reorganized to show the un-ticked references removed
If you hover over a graph node, the rest of the graph is un-highlighted to give emphasis to the selected node:

- Architecture view with de-emphasized nodes
If you then right-click on a node, you get a pop-up menu giving you instant access to many of the tools we've already explored, allowing you to quickly asses the state of a given node in the project.
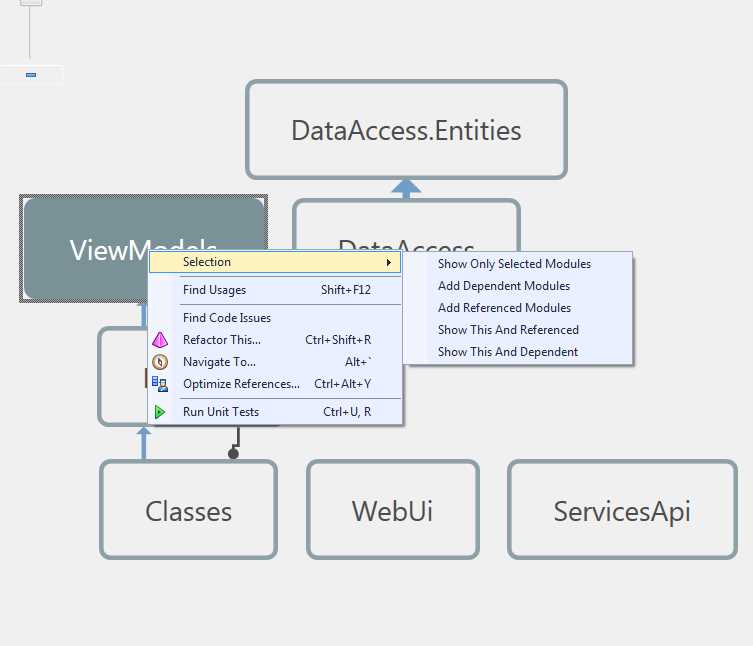
- Architecture diagram showing quick access to tools via the pop-up menu
The architecture diagram is your project’s road map, allowing the senior and lead developers to see at a glance if things are progressing the way they should be, and allowing quick trouble-shooting and remedial action when needed.
- 1800+ high-performance UI components.
- Includes popular controls such as Grid, Chart, Scheduler, and more.
- 24x5 unlimited support by developers.