
Real-Time ASP.NET Core 3 Apps with SignalR Succinctly®

CHAPTER 15
Using Chrome Developer Tools
Chrome developer tools are an absolute lifesaver if you run into any problems. This is true for debugging any web application, especially if you are using scripts or plug-ins. To access Chrome DevTools, right-click anywhere on the page and select Inspect from the context menu.

Figure 42: Console in Chrome DevTools
Clicking on the Console tab (Figure 42), you will see any errors highlighted in red.
Note: The messages you see in Figure 42 are not error messages. These are normal output messages.
It is also useful for a quick look at values in your code (without placing a breakpoint). We can achieve this by adding some console.log statements in the code. Modify the charting.js file’s ValueReceiver, as illustrated in Code Listing 43.
Code Listing 43
connection.on("ValueReceiver", function (chartValue) { if (chartValue && !isNaN(chartValue)) { lineChart.data.series[0].push(chartValue); lineChart.update(); console.log('Chart value entered was ' + chartValue); document.getElementById("valueInput").value = ""; document.getElementById("valueInput").focus(); console.log('Input cleared and Ready'); } }); |
Save and refresh your page, enter the value of 1.75 in the Value text box, and hit Enter. Now, inspect the Console tab again.
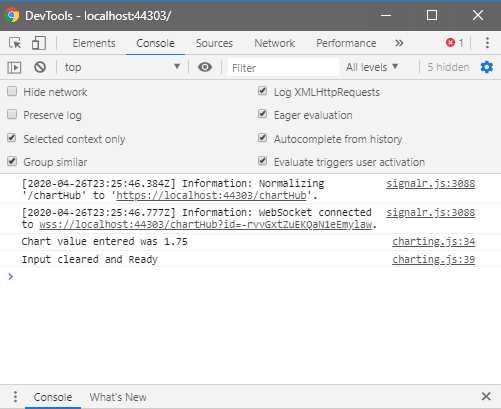
Figure 43: Viewing Logged Messages
You will see that the messages you added were logged to the Console tab (Figure 43).
You are also able to view ChartHub messages. By selecting the Network tab, selecting chartHub from the left Name list, and clicking on the Messages sub-tab on the right, you can see the WebSocket messages (Figure 44).
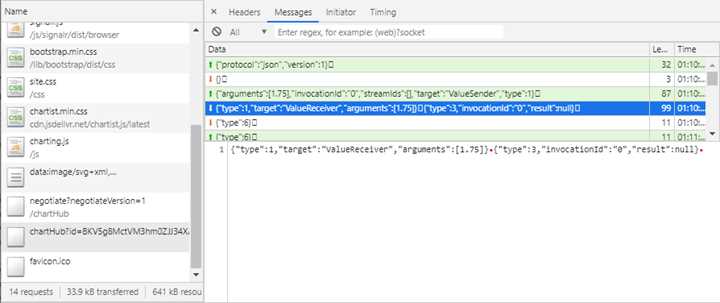
Figure 44: Viewing ChartHub Messages
The selected message in Figure 44 can also be seen in Code Listing 44.
Code Listing 44
{"type":1,"target":"ValueReceiver","arguments":[1.75]}‑{"type":3,"invocationId":"0","result":null} |
Another very helpful tip is the ability to place breakpoints in the JavaScript code. Click the Sources tab and expand the folders under the Page tree on the left. Look for the charting.js file and click on it.
You will see your charting.js code displayed as seen in Figure 45. You can then place a breakpoint as I have illustrated, by clicking on line 36. Breakpoints are indicated by a blue tag in the line number gutter.

Figure 45: Setting Breakpoints
Staying on this screen, you will see that you can set a Watch. This allows you to keep track of a variable when it is in scope, and you can see how that value changes.
With your breakpoint still set on line 36, enter a value of 3 into the Value text box, as seen in Figure 46, and hit Enter. The page will immediately enter a paused state.

Figure 46: Enter Value to Hit Breakpoint
Swing back to the developer tools, and you will see that the execution of your code has paused at line 36 (Figure 47).

Figure 47: Add a Watch
From here, you can expand the Watch and add a variable to keep an eye on it. In Figure 47 you will see that I just added the chartValue variable to a Watch. You will notice that it contains the value that I entered on the page.
- 80+ high-performance ASP.NET Core controls, including DataGrid, Charts, and Scheduler.
- Lightweight and responsive.
- Modular and touch-friendly.
- Built-in themes.