
Real-Time ASP.NET Core 3 Apps with SignalR Succinctly®

A
A
A
CHAPTER 13
Running the Real-Time Chart Application
Now for the moment of truth. Build your project and run it.
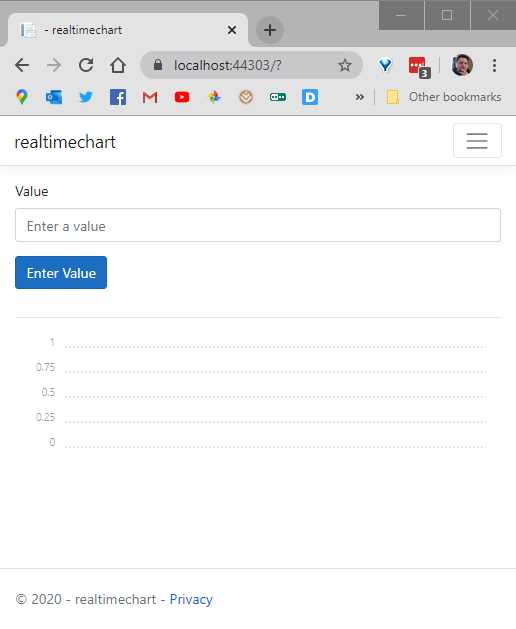
Figure 39: Running the Chart App
The application loads the page. If you see the line chart below the button, you know that the page has correctly loaded the Chartist CSS file.
Next, add the following values (Code Listing 36) one by one, pressing the Enter Value button after each value has been entered.
Code Listing 36
1, 2, 1.75, 3, 2.2, 1 |
As you enter each value, you will see the line chart render. After adding the last value, your line chart should look like Figure 40.

Figure 40: Data Values Entered
Build modern ASP.NET Core apps
using Syncfusion® ASP.NET Core control suite.
- 80+ high-performance ASP.NET Core controls, including DataGrid, Charts, and Scheduler.
- Lightweight and responsive.
- Modular and touch-friendly.
- Built-in themes.
Thank you for your interest in the Succinctly® Series Premier Collection!
I agree to receive emails for updates about products, free resources, and promotional offers in exchange for downloading premier Succinctly® ebooks.
You are one step away from downloading ebooks from the Succinctly® series premier collection!
A confirmation has been sent to your email address. Please check and confirm your email subscription to complete the download.