
Real-Time ASP.NET Core 3 Apps with SignalR Succinctly®

CHAPTER 9
Creating Real-Time Charts
You should now have an idea of the power that SignalR gives developers when they’re creating real-time web applications. You might be wondering how easy it would be to create another type of real-time application.
Let us have a look at something more suited to business applications. We will create a real-time ASP.NET Core web application that displays a line chart.
Create a new ASP.NET Core 3.0 web application as outlined in the previous sections, “Project Creation and Setup” and “Add the Required SignalR Client Library.” Call the new project realtimechart.
Once you have added your ASP.NET Core 3.0 web application to your solution, your Solution Explorer window will look as shown in Figure 31.
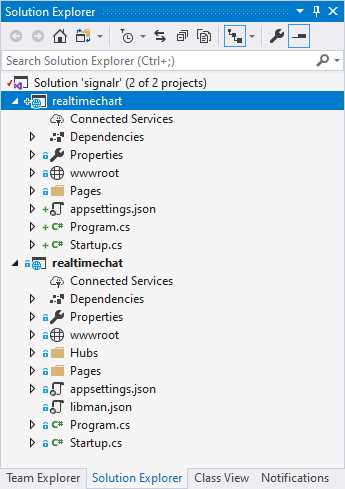
Figure 31: Adding Real-Time Charting Application
With your new project added to your solution, we can now begin to add the logic needed to display the real-time chart.
Note: From here on, the book assumes that you have added the required SignalR Client Library to your new project, as illustrated previously in the book.
Real-time charting can be very beneficial in many applications. Think of a real-time KPI (key performance indicator) dashboard of sales figures, a stock market price ticker, a shared calendar scheduler, or even a doctor in/out notification dashboard for a hospital ward.
- 80+ high-performance ASP.NET Core controls, including DataGrid, Charts, and Scheduler.
- Lightweight and responsive.
- Modular and touch-friendly.
- Built-in themes.