
Power BI Succinctly®

CHAPTER 1
What is Power BI?
Power BI is a cloud-based business analytics service that gives us a single view of the most critical business data. Using a live dashboard and creating rich, interactive reports, Power BI allows access to data for monitoring the health of a business. Essentially, it is a tool for creating our own BI reports and dashboard. Power BI is not complicated—it is powerful, easy, and for everyone.
Over time, there have been three BI waves.
1st Wave—Technical BI (IT people-to-end users): In order to achieve BI results, in the past companies had to rely on consultants and IT professionals in order to develop Analysis Server Models. These professionals would develop a data warehouse and then create reports and analysis in order to give end users options for making sound business decisions. However, there was a problem: there were not enough IT people. And, actually, this is the problem we still have today. Because of a lack of IT professionals, oftentime companies, which are always looking for reports, must wait too long while assuming the additional risk that what they eventually obtain is not still valid.
2nd Wave—Self-service BI (analysts-to-end users): This wave included PowerPivot Excel, which allowed users to make their own data analysis. This worked well. Data analysis and data scientist consultants began to buzz in the BI world. However, this wave was not as innovative as first expected because, despite improvements, the data analysis was still difficult.
Data analysis requires a flexible mindset that comes from traveling a long path of rethinking both our mental and data approaches.
3rd Wave—BI wave (end user BI). The aim is to give business intelligence to all. What is the difference between the first wave and the second wave? In the first, we have tools such as ClickView and PowerPivot. In the third wave, end users not only have a tool, but a tool series. Different tools for different users. The idea is that each user has a unique platform with many choices available for their unique needs.
Developers who take care of ops integration; data scientists who take care of data analysis; visualization experts who take care of data visualization and choose the best visualization option—each professional has a role in developing data analysis in Power BI.
However, some issues remain.
The first problem involves access to data. Data is often stored in a database, and on-premises data decreases over time. Data is typically stored in the cloud, in an Excel file, or on websites. We need to collect information and bring it into our own analysis systems. In order to do that, we also need to have data access and the correct tools.
In general, our data is stored in a database, but often we do not know exactly where it is. If we use a web service, we will have the access credentials to the portal, but we still won’t know where the data is saved. For example, Google Analytics allows to us analyze data access for websites, but we do not know where the database is. We can’t plug a direct cable into the Google databases and collect or select data. We need a tool to simplify this process, one that starts from Google Analytics and uses its own process or application.
The second problem involves security and accessibility. We need our data stored in a virtual machine, otherwise that data is available for some users (or user groups) but not for everyone. We need to implement safety mechanisms and rules—user mechanisms that allow particular groups to view different information—in order to achieve this security goal.
We can solve all these problems with Power BI.
Power BI Scenario
In order to understand the Power BI scenario, we must understand clearly who the content creators are and who uses the content.
Generally, the following positions are present within an organization:
The Executive needs heavily aggregated information in order to see a high-level image of the company’s state or a particular functional area. This information for the executive is often presented in the form of a dashboard or a scorecard, and it is bound to raise strategic questions.
The Analyst needs raw, or slightly summarized, data with the aim of creating a detailed analysis of a specific problem or business opportunity. The analyst presents the data in the form of spreadsheets, presentations, or ad hoc reports that focus on the specific problems they have been called upon to solve.
The Manager needs data, which provides a detailed analysis of an area, a specific business, or a function. The data for the manager is used to evaluate past performances or to plan future activities. The data must have a detail level that can define specific actions, for example a sales plan or a marketing activity for the launch of a product. The data for the manager is usually supplied as reports or scorecard details.
The Operational Users deal with data on a transactional level. For example, an operating report in which the invoice registers information that comes from bookkeeping or a daily production plan. The operational data is usually shared in the form of reports. More and more frequently, the data for the operational users is shared online through an Intranet or directly through mobile devices.
All of the people in these positions work and cooperate by using tools of Business Intelligence.
The data visualization and discovery tool is important for several reasons. First, it allows us to use a very strong and sensitive organ—our eyes. Through our eyes we interpret the information correctly. It is a sophisticated instrument, so much so that machine learning algorithms still rely on it.
Second, the data can deceive us sometimes.
In 1973, Frank Anscombe produced four collections of information that he called “the quartet,” to demonstrate this idea. He drew 11 points in each quadrant of his diagrams. The points have very similar statistical features, and they represent variance, average values, correlation, and linear regression. The values vary by a few percentage points. The way in which the points give us completely different information is shown in these graphs. The graphs allow us to identify the outliers—the individual points that are meaningfully different from others and therefore provide us with the information needed to write our analysis.
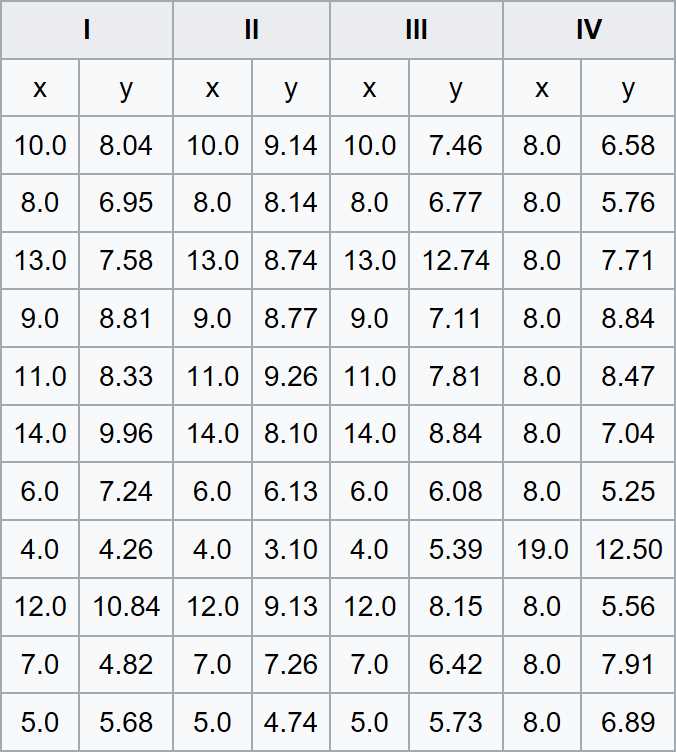
Figure 1: Anscombe’s Quartet (source: Wikipedia)

Figure 2: Anscombe’s Quartet (source: Wikipedia)
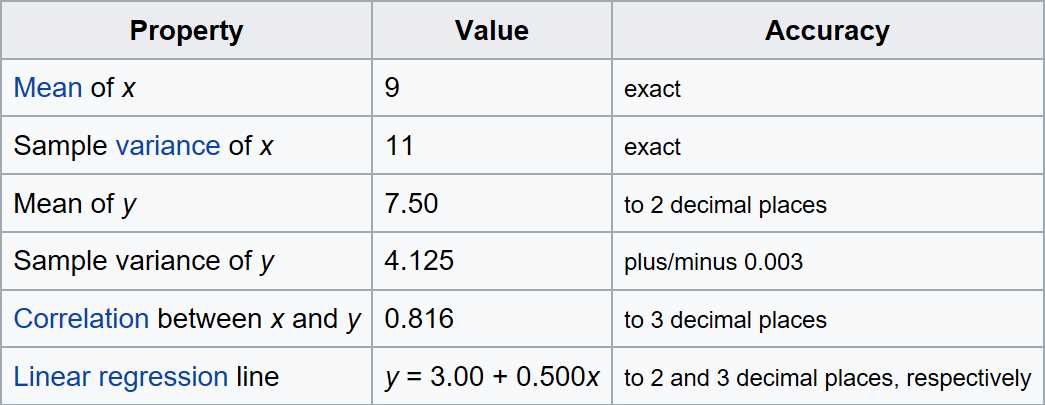
Figure 3: Used Property (source: Wikipedia)
We can deduce that, once our data reaches millions or billions of rows, it would be helpful for the analysis to have an expression power such as Power BI. This helpfulness is another reason why the Power BI tool is having great success. Users prefer Power BI because of its easy usage, great availability of visualizations, and capacity to integrate data from different sources.
Power BI is arguably one of the two or three most powerful and sophisticated data analysis programs. Research firm Gartner places it as the leader among the Magic Quadrant in business intelligence, transactional systems, data warehousing, and advanced analytics. At the time of this writing, the Microsoft data platform is first in all the reports regarding safety, performance, and capacity to do advanced analytics “in-place” (that is, inside the data contained in the database). By adding the in-memory and the capability to work in either on-premises systems or in the cloud, as well as in hybrid environments, we can obtain the full richness and the power of this tool.
Two licenses of Power BI are available:
- Power BI: Free
- Power BI Pro: Currently at $9.99 a month with annual subscription
- 1800+ high-performance UI components.
- Includes popular controls such as Grid, Chart, Scheduler, and more.
- 24x5 unlimited support by developers.