
Power BI Succinctly®

CHAPTER 5
Solution Template
Now let’s examine the latest sharing mode, which is the most innovative mode and offers us the ability to create content packs.
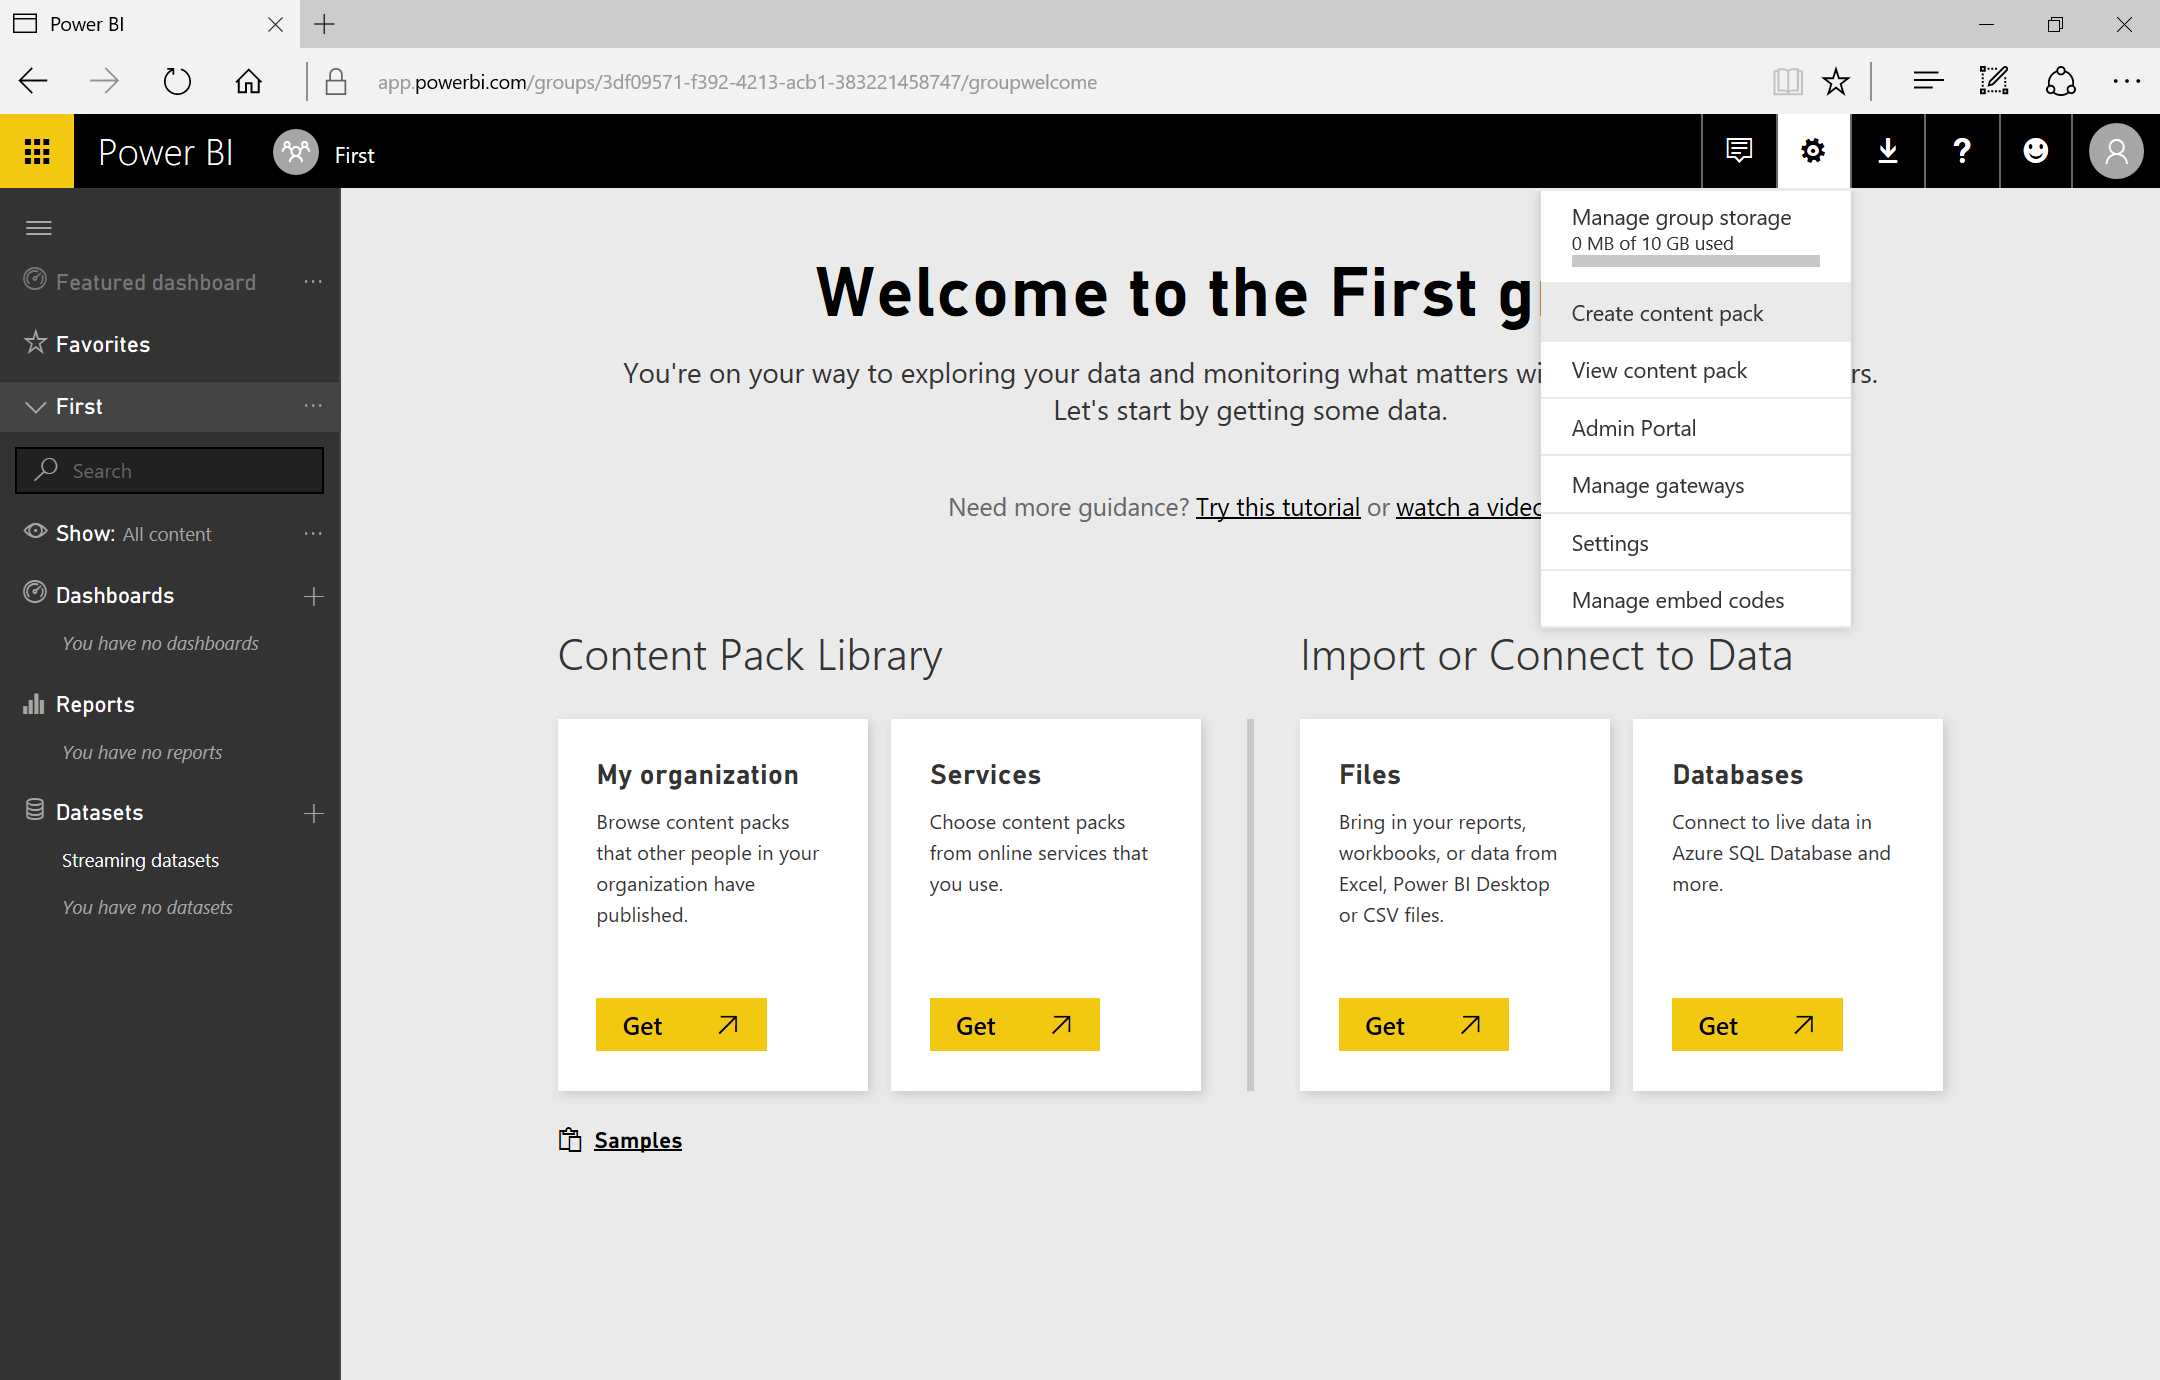
Figure 131: Power BI Settings Menu
In order to create a new content pack, first we go to the top right, click the Setting icon, and select Create content pack, as in Figures 131 and 132.
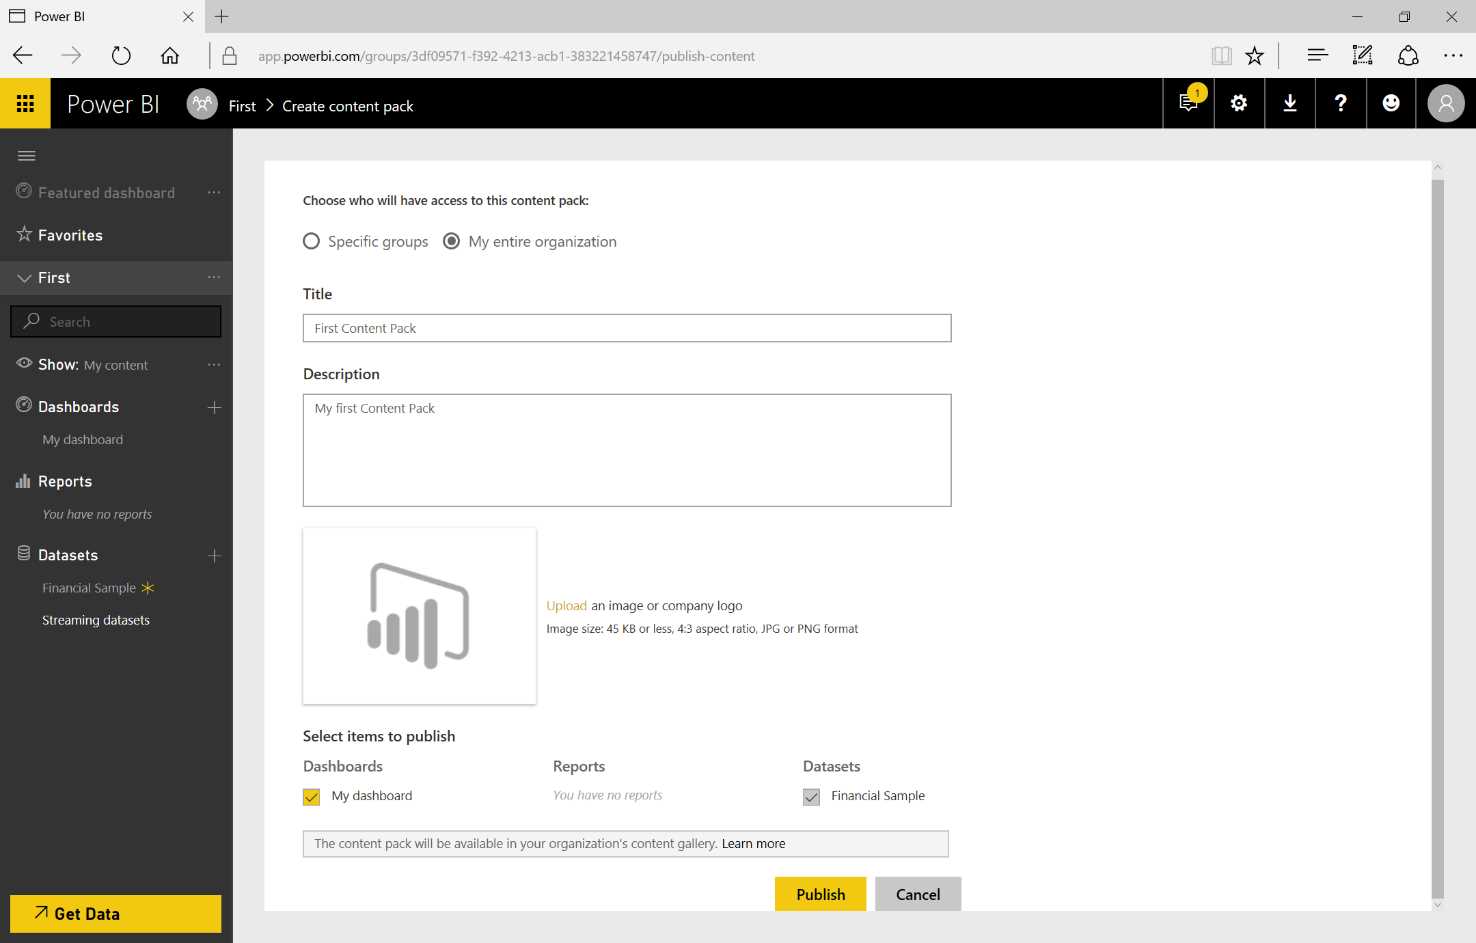
Figure 132: Create Content Pack
We can quickly decide if we want to share this with our entire organization or only with a specific group. In fact, we can specify:
- The user/users or the group/groups.
- The name of the content pack.
- A description of the content pack.
- The icon matched to the content pack.
- Any contents we want to share.
With any items we want to share, dependent reports and datasets can be selected, too. We can also add other datasets and reports without having problems related to interdependence restriction.
When we have finished the configuration, we can carry out the publication by clicking Publish.
Next, we can enter the Get Data as user, via the icon in Figure 133.
![]()
Figure 133: Get Data
As the graphics in Figure 134 show, we can next select My organization, where we can see all the previously published content packs. When we select the content pack, the owner is indicated. By clicking Get, we add that to the workspace.
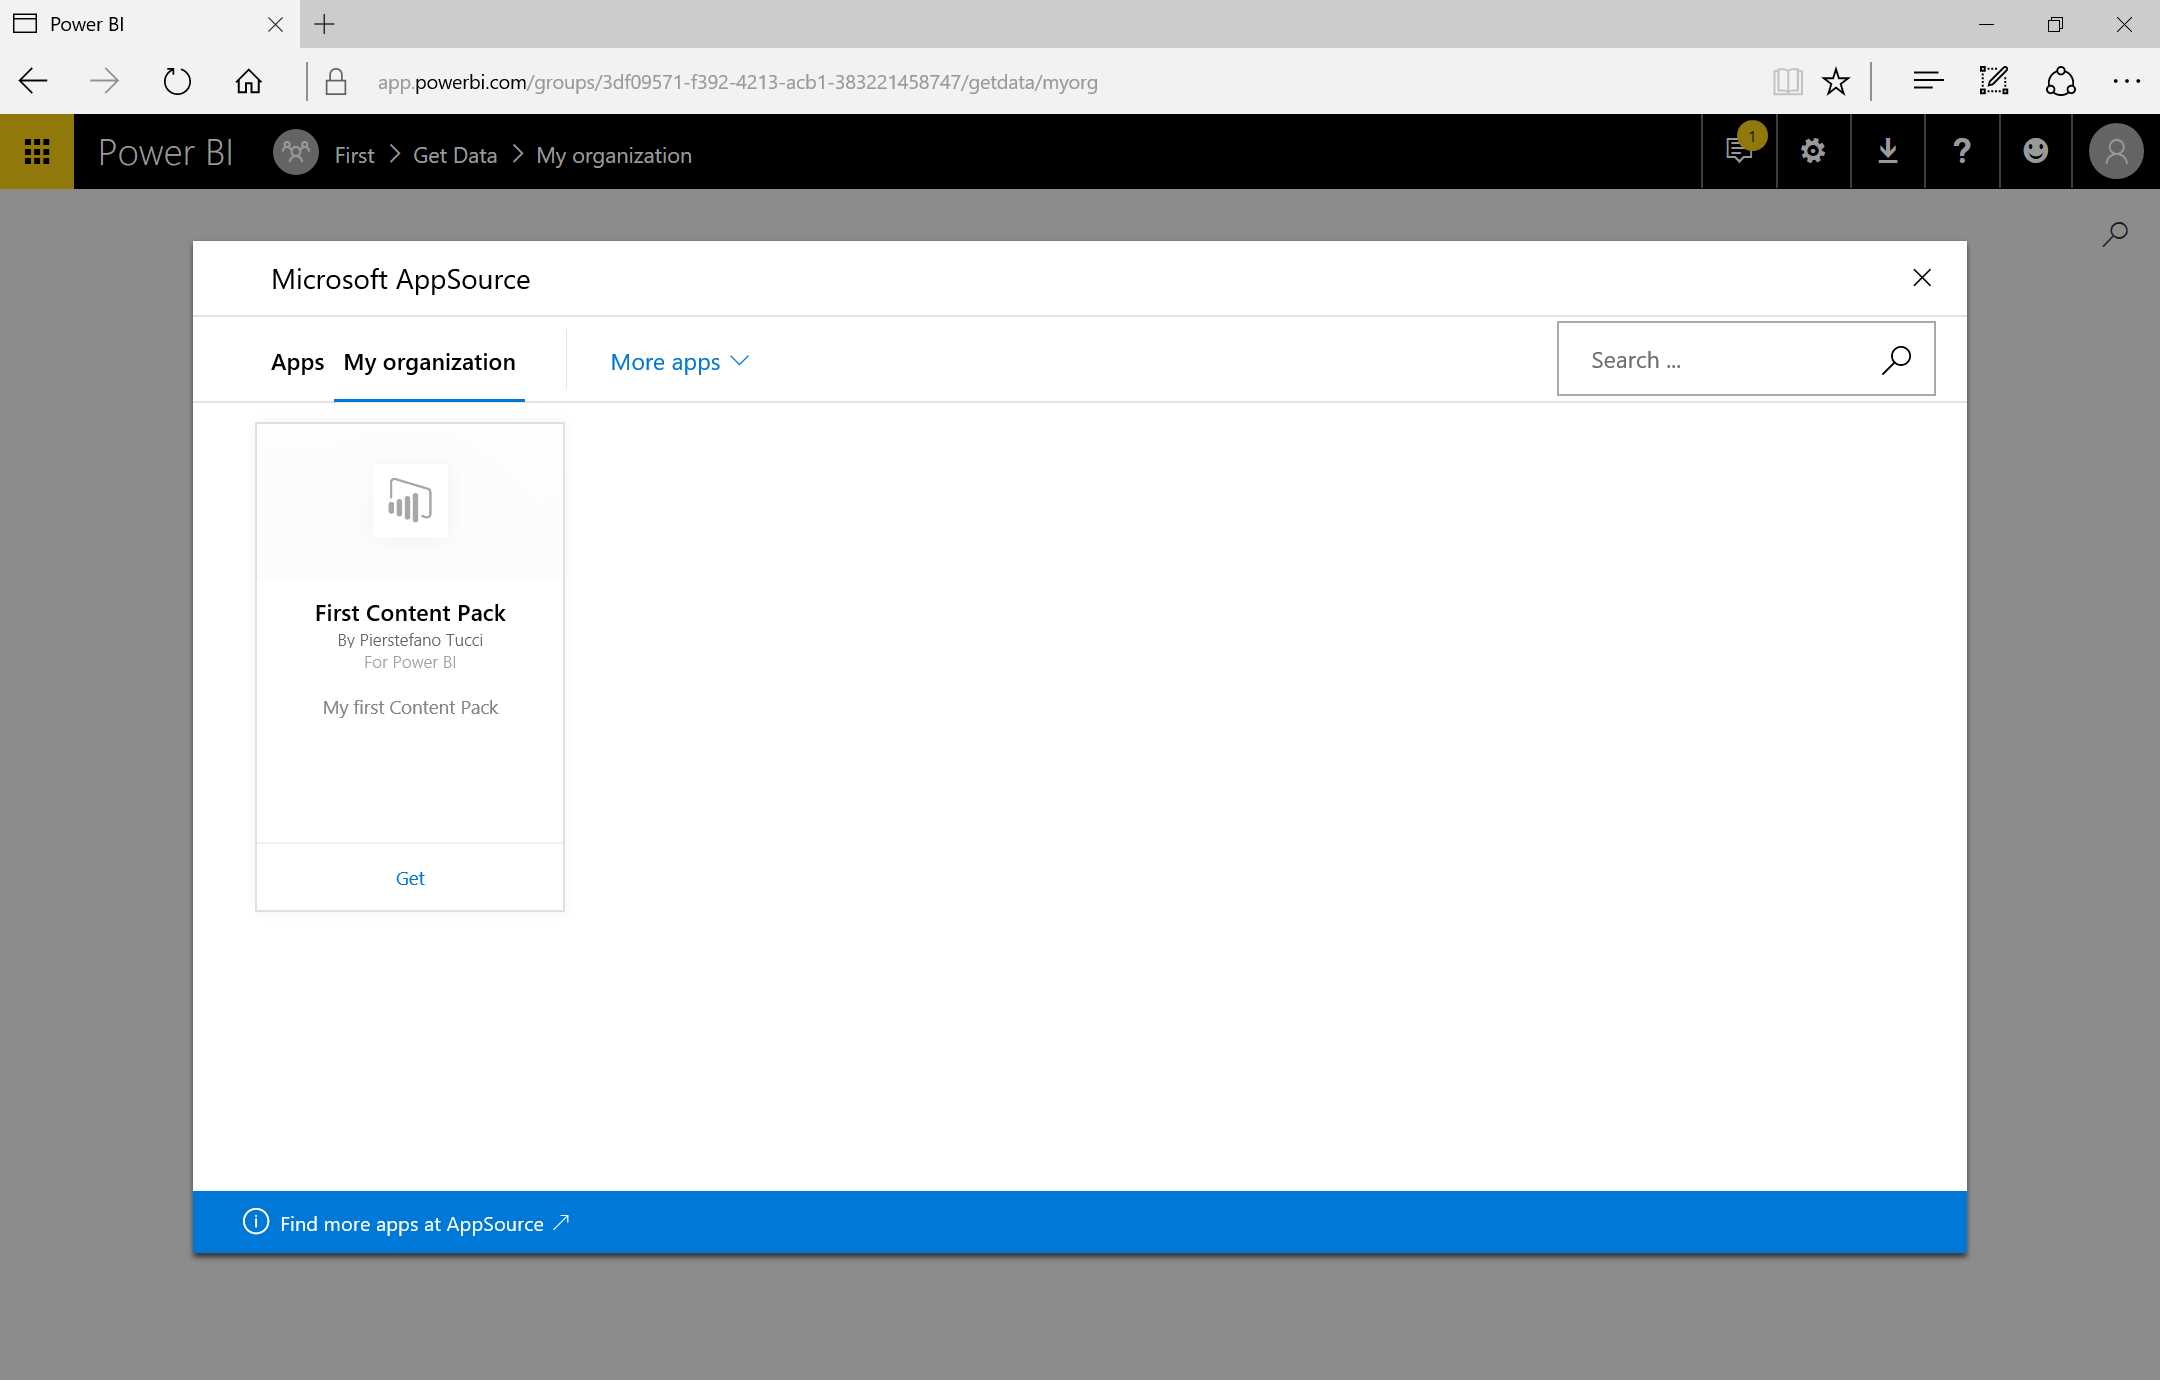
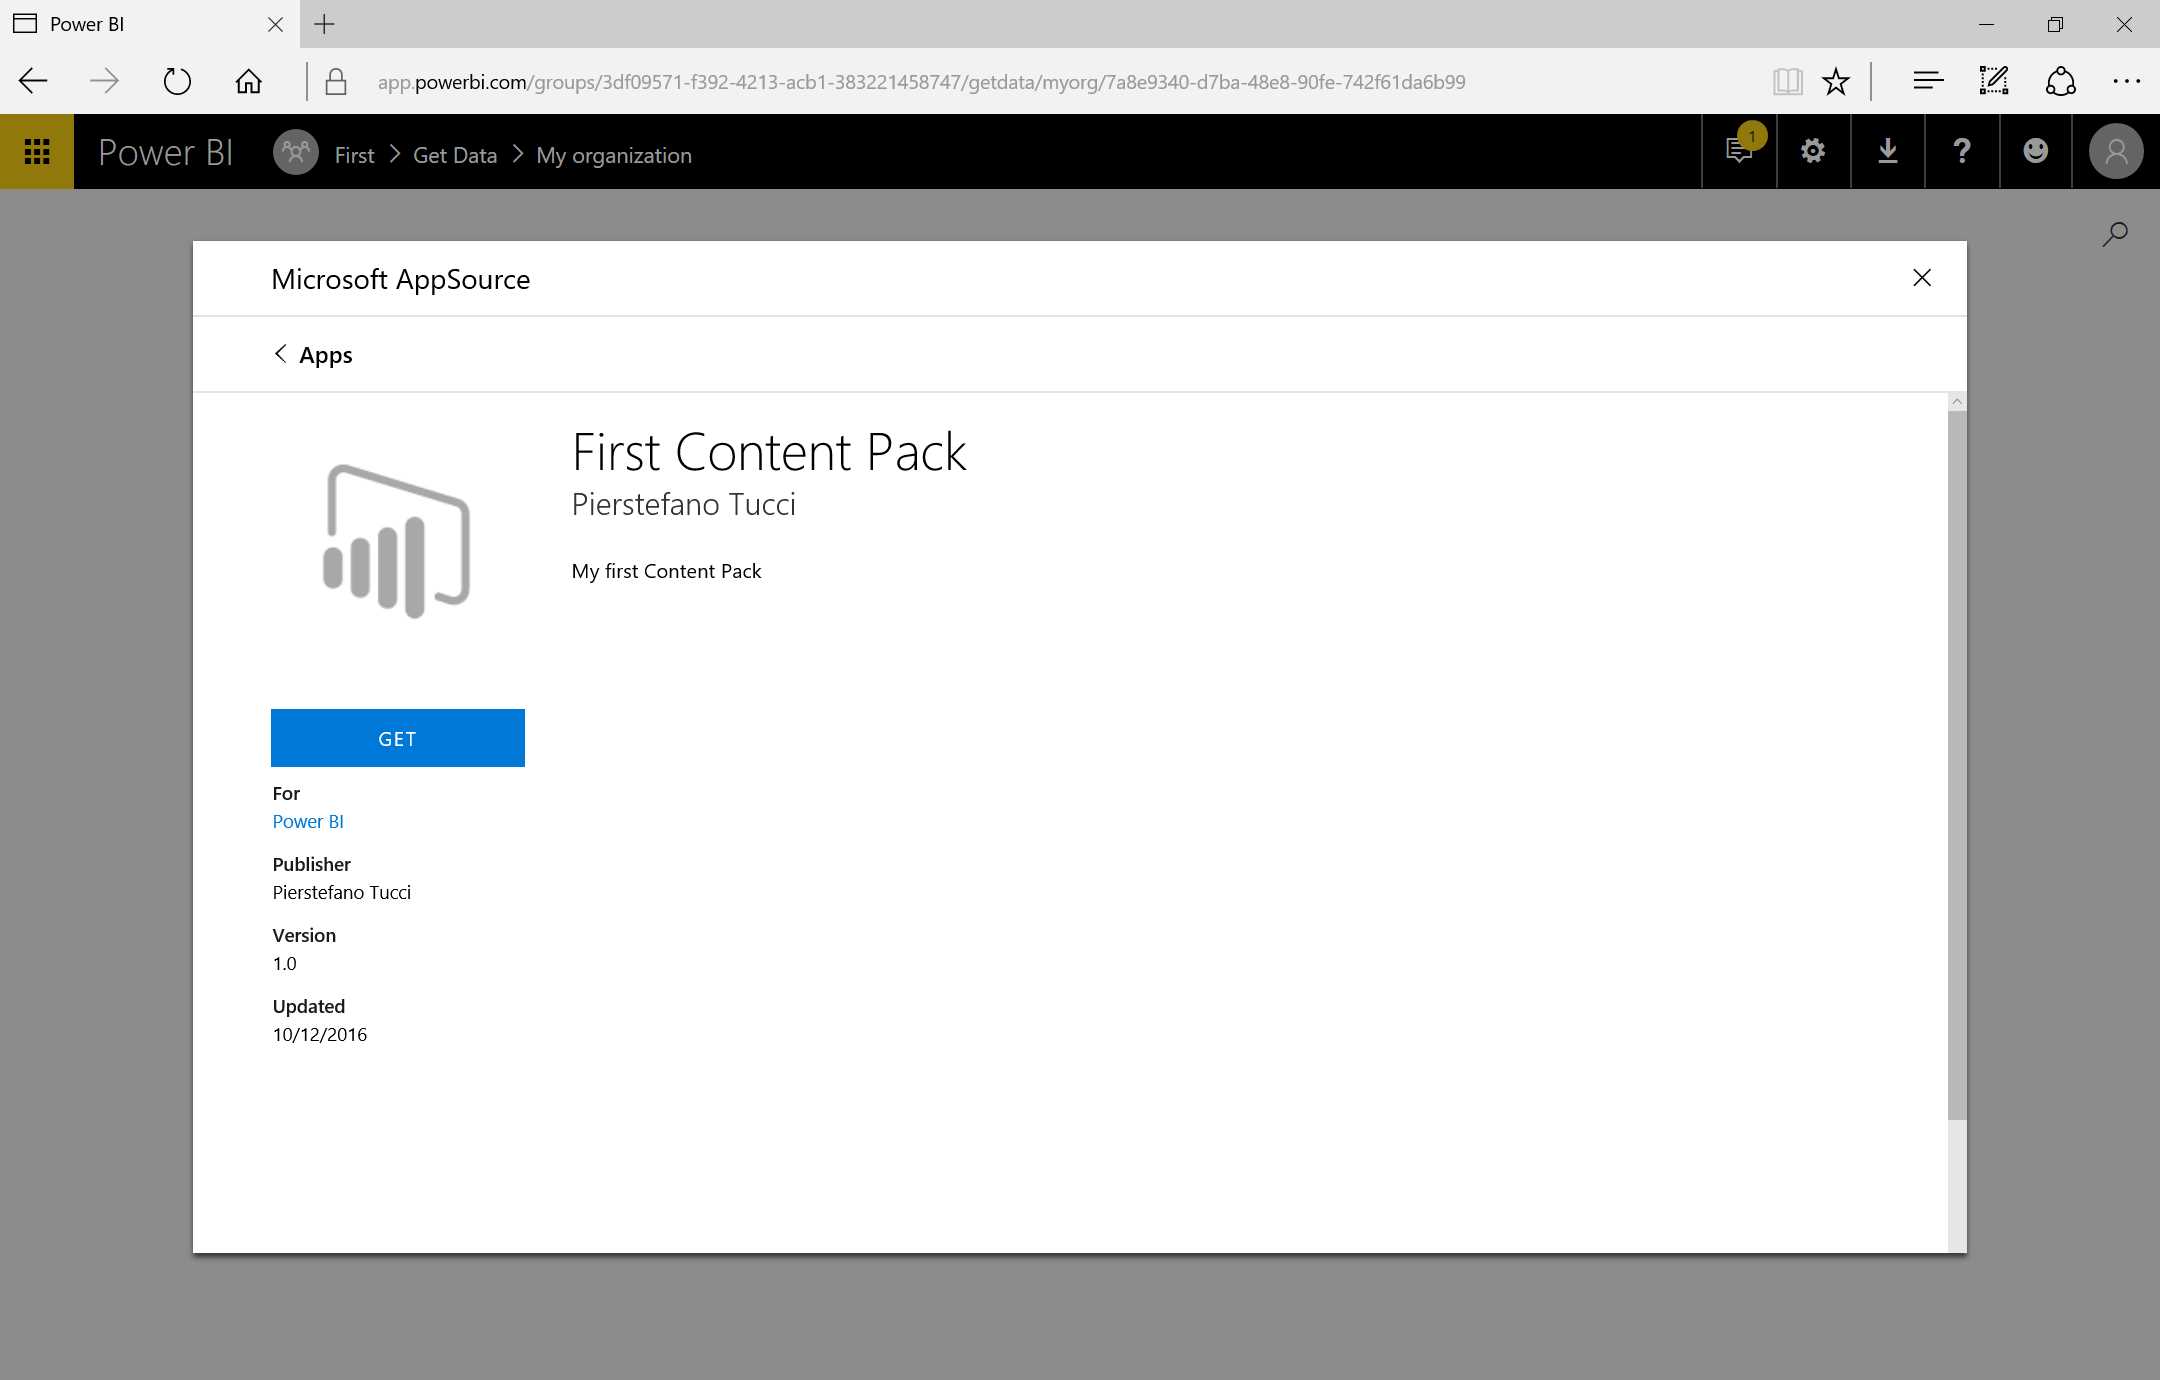
Figure 134: Microsoft AppSource—sequence
Next, we go to the top right, click the Settings icon, and select View content pack in order to delete a content pack. Next, we click the Delete entry corresponding to the content pack we want to delete.
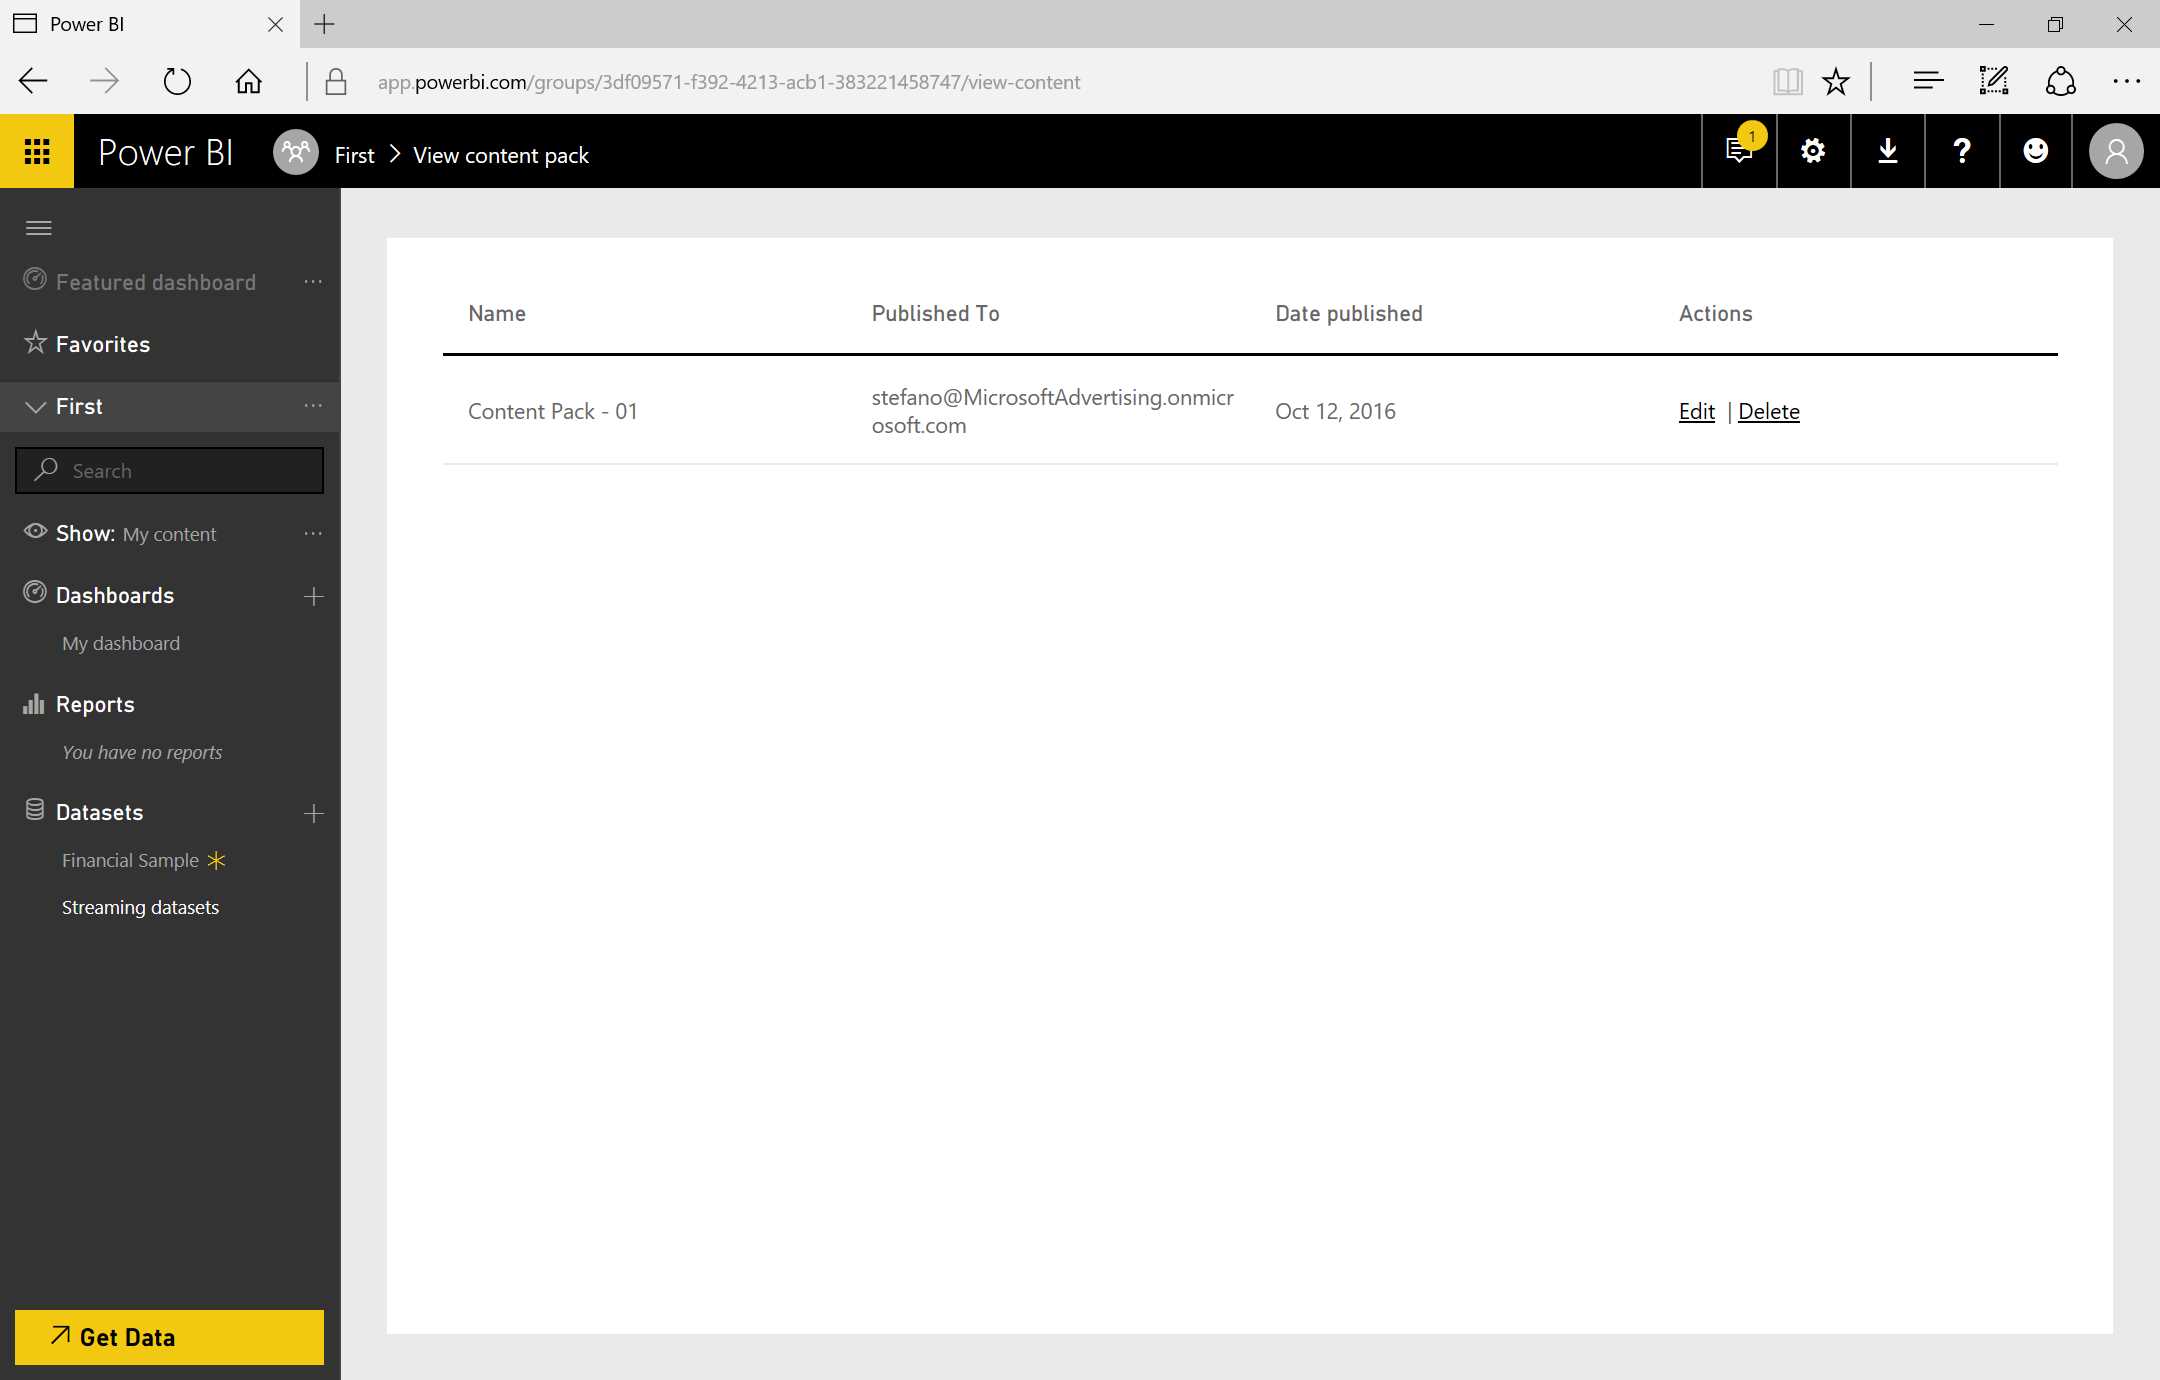
Figure 135: View Content Pack
Content pack
The content pack is one of the three sharing modes that allow us to gather together report and dataset dashboards as well as to share them within our organization.
The Software as a Services (SaaS) can be embedded by Power BI through content called connectors, which are made available directly on the Power BI portal and are simply content packs created specifically for this application. Once one of the connectors has been used and the connection data, such as the authentication account, has been provided, we can log onto source data like CRM Online, Google Analytics, and Salesforce. We can also use connectors to link to source data in the cloud, such as Azure SQL Database, Azure SQL Data Warehouse, and Spark on Azure HDInsight. (Note that Apache Spark is a generic engine for large-scale data storage with Azure HDInsight).
Notes on content packs:
- The connections require an existing subscription.
- Each content pack provides prebuilt dashboards and reports.
- They are updated nearly every month.
Database and data services are connectible, and a number of Azure (cloud-based) services offer the possibility of having a direct connection:
- Queries are sent to Azure, while the users export data and reports (the dashboard tiles are updated every 15 minutes).
- This functionality is for users who already have experience with databases and with the entities they connect to.
- It is available only with the Power BI Pro license.
Using Azure Online services such as Azure Stream Analytics, for example, leads us to interesting scenarios, like the possibility of creating RealTime dashboards with Azure Stream Analytics.
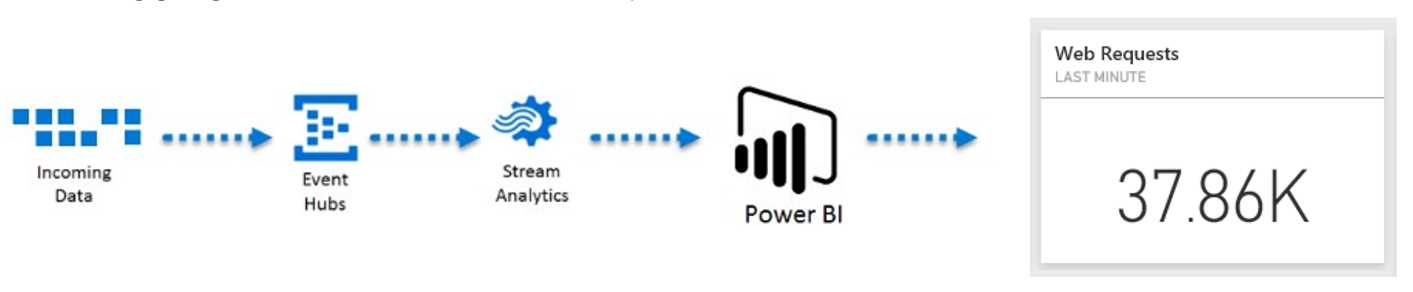
Figure 136: Stream Analytics Flow
In the Big Data world, we can collect a considerable quantity of data coming, for example, from sensors—in such a case, we have data flows that can be gathered through the Azure Event Hubs service. Afterward, we can carry out real-time analysis of the data by using the Azure Stream Analytics service. Finally, we can display the data by using Power BI and integrate it directly with a data source such as Azure Stream Analytics.
For example, we can imagine the data coming from a web application, perhaps an eCommerce website. In that case, we can collect data related to the web surfing of the user and we can analyze the temporal windows and display a summary of the analysis that can be the number of web requests received in the last minute. We can identify a temporal window because Azure Stream Analytics allows us to do real-time analysis. And because Power BI offers a visualization that is updated in real time, there is no refresh needed in this case.
We need to use connectors for the SaaS applications in order to connect Power BI to the online sources. So, we refer to the Get Data and we go to Services, where we can display the number of available connectors. We can use Microsoft Dynamics CRM Online and click Connect. We will be asked for the data services URL of Dynamics and also an authentication account. The result we receive will be very similar to the following reports because a report is created automatically.
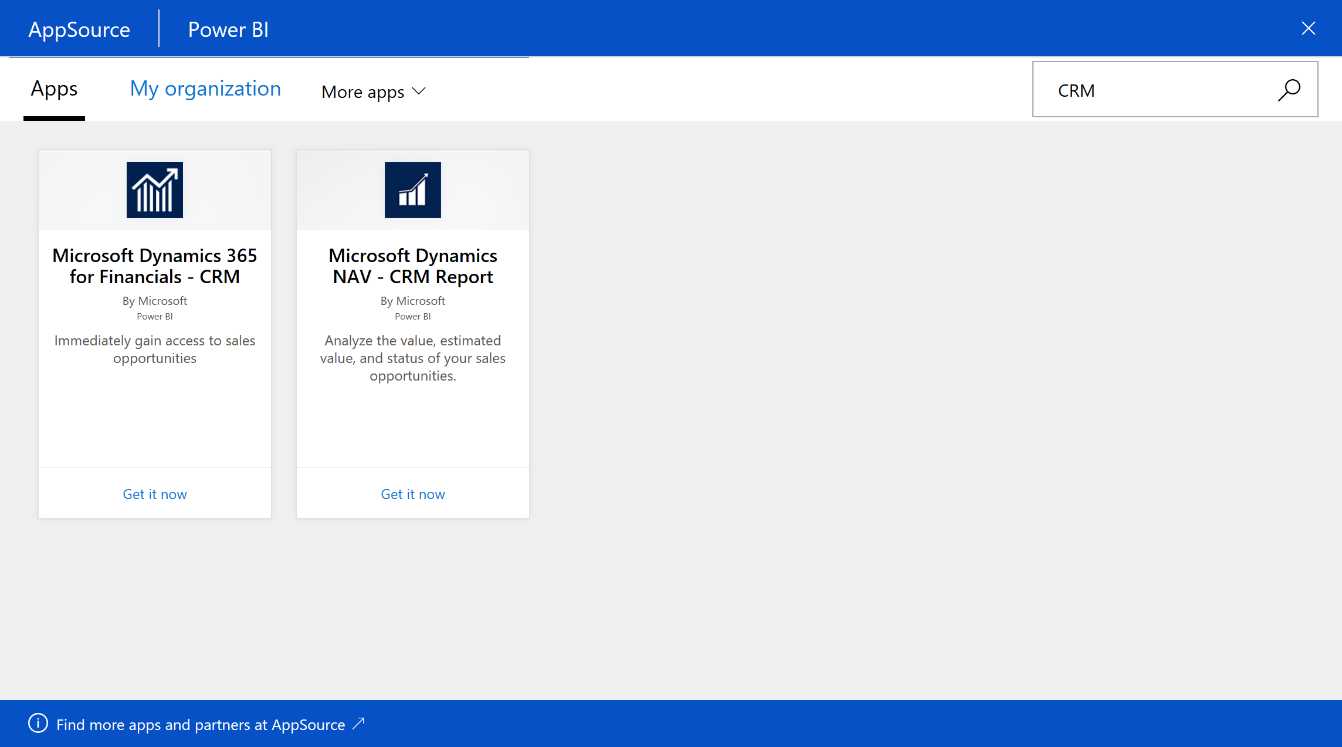
Figure 137: Microsoft AppSource
There are also several pages available for us in the report. The data comes from a CRM Online test. At the same time, we have a dataset available to implement a further report starting from our CRM Online.
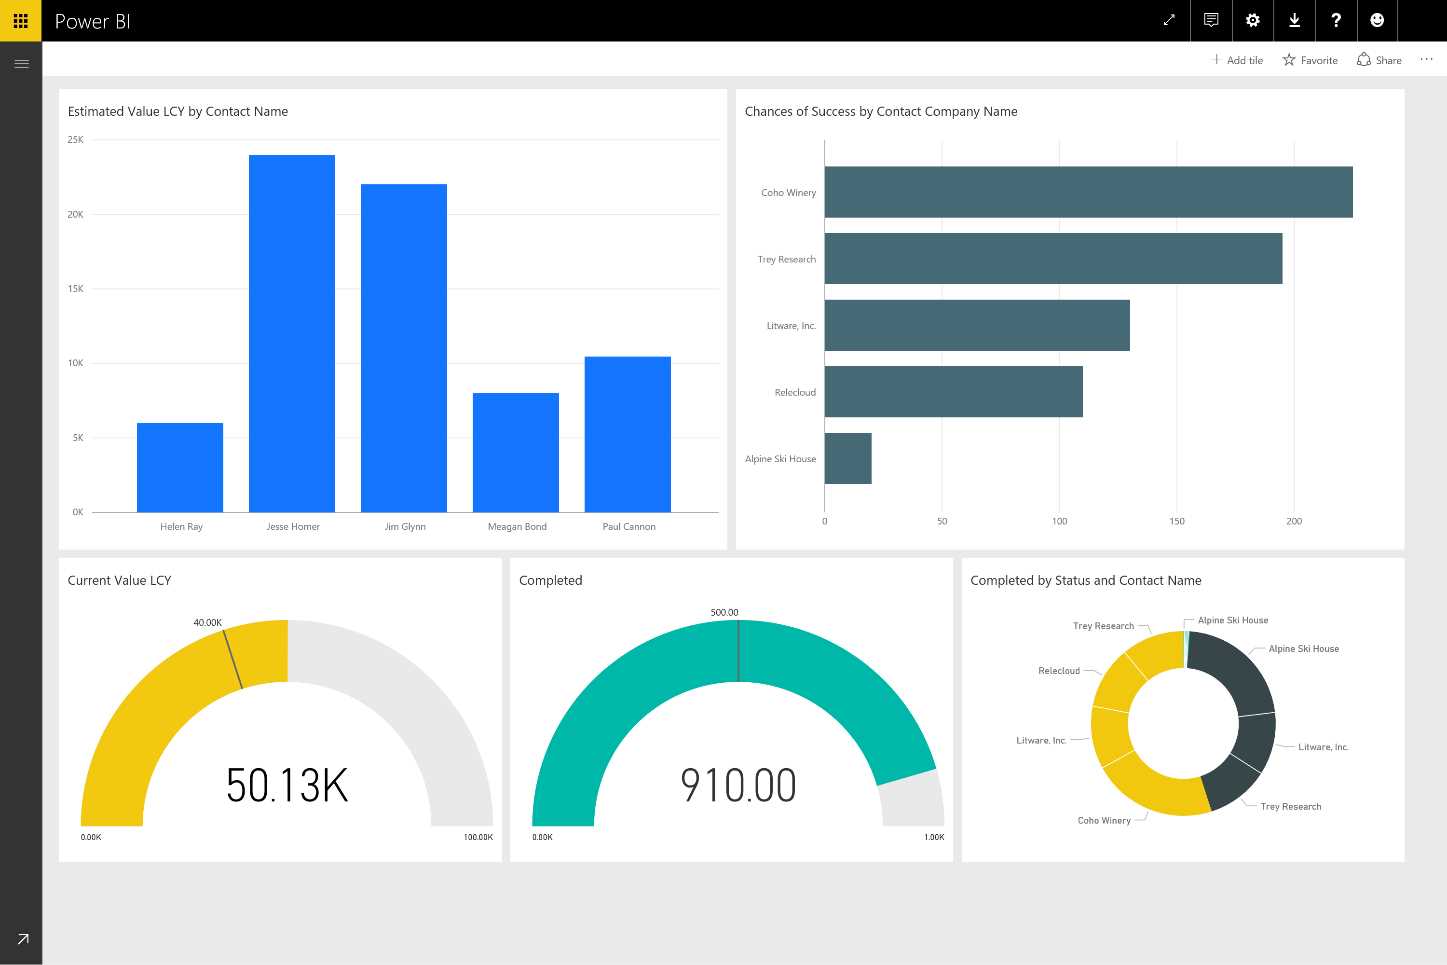
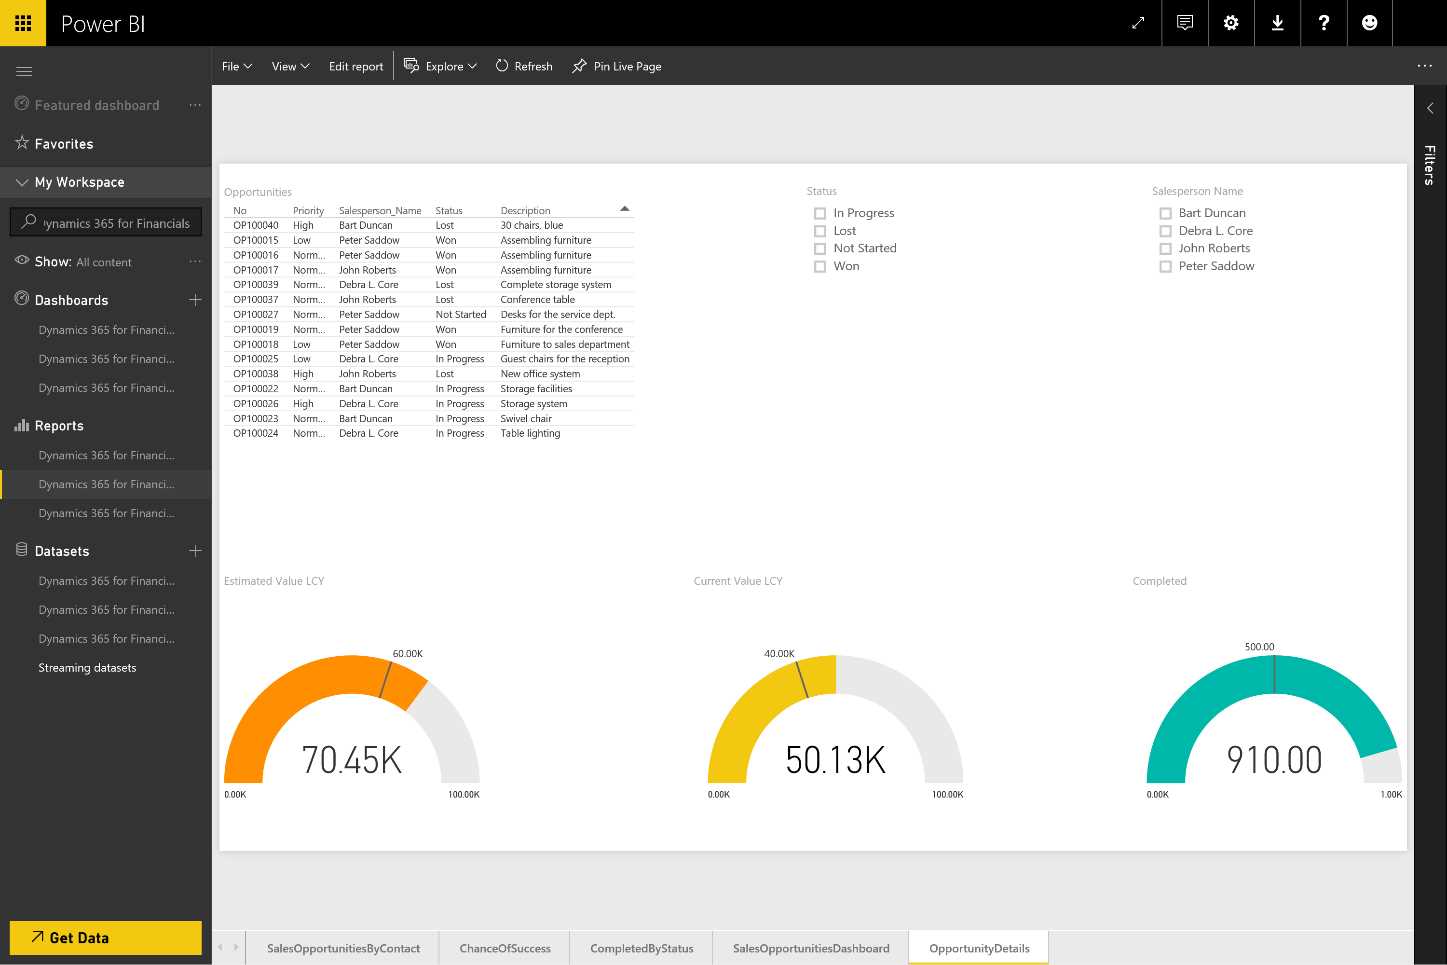
Figure 138: Dashboards—sequence
We can also use database online data sources—in particular, Azure SQL Database, Azure SQL Data Warehouse, SQL Server Analysis Services, and Spark on Azure HDInsight. In this case, we need only select Azure SQL Database, click Connect, then provide the server address, the name of the database, and information about the authentication. Automatically, we have a data model available that is updated about every 15 minutes.
Data refresh and schedule
There are data sources that need a refresh in order to keep the data updated in Power BI. For instance, an Excel workbook that connects to SQL Server needs to be updated through the refresh function. When the workbook is loaded on Power BI, we must carry out the refresh of the original data source, SQL Server, which is on-premises instead. We can also run the automatic refresh of the interval and decide then if we need to update our data sources in a scheduled or manual way. If we choose scheduled, we must decide if the update should occur on a daily or hourly basis.
Power BI allows the update of the online as well as on-premises data for the dataset loaded from:
- Power BI Desktop file
- Excel workbook (where Power Query or PowerPivot are used to connect to the data)
The data update can be on-demand or scheduled. If scheduled, the maximum frequency is:
- Power BI free license: daily
- Power BI Pro license: hourly
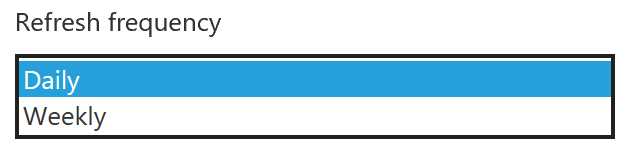
Figure 139: Refresh Frequency
We need to keep the credentials in order to keep the data updated in Power BI. Moreover, we must provide the access credentials for the data sources included in the dataset. The credentials are saved securely so that Power BI can connect on behalf of the user.
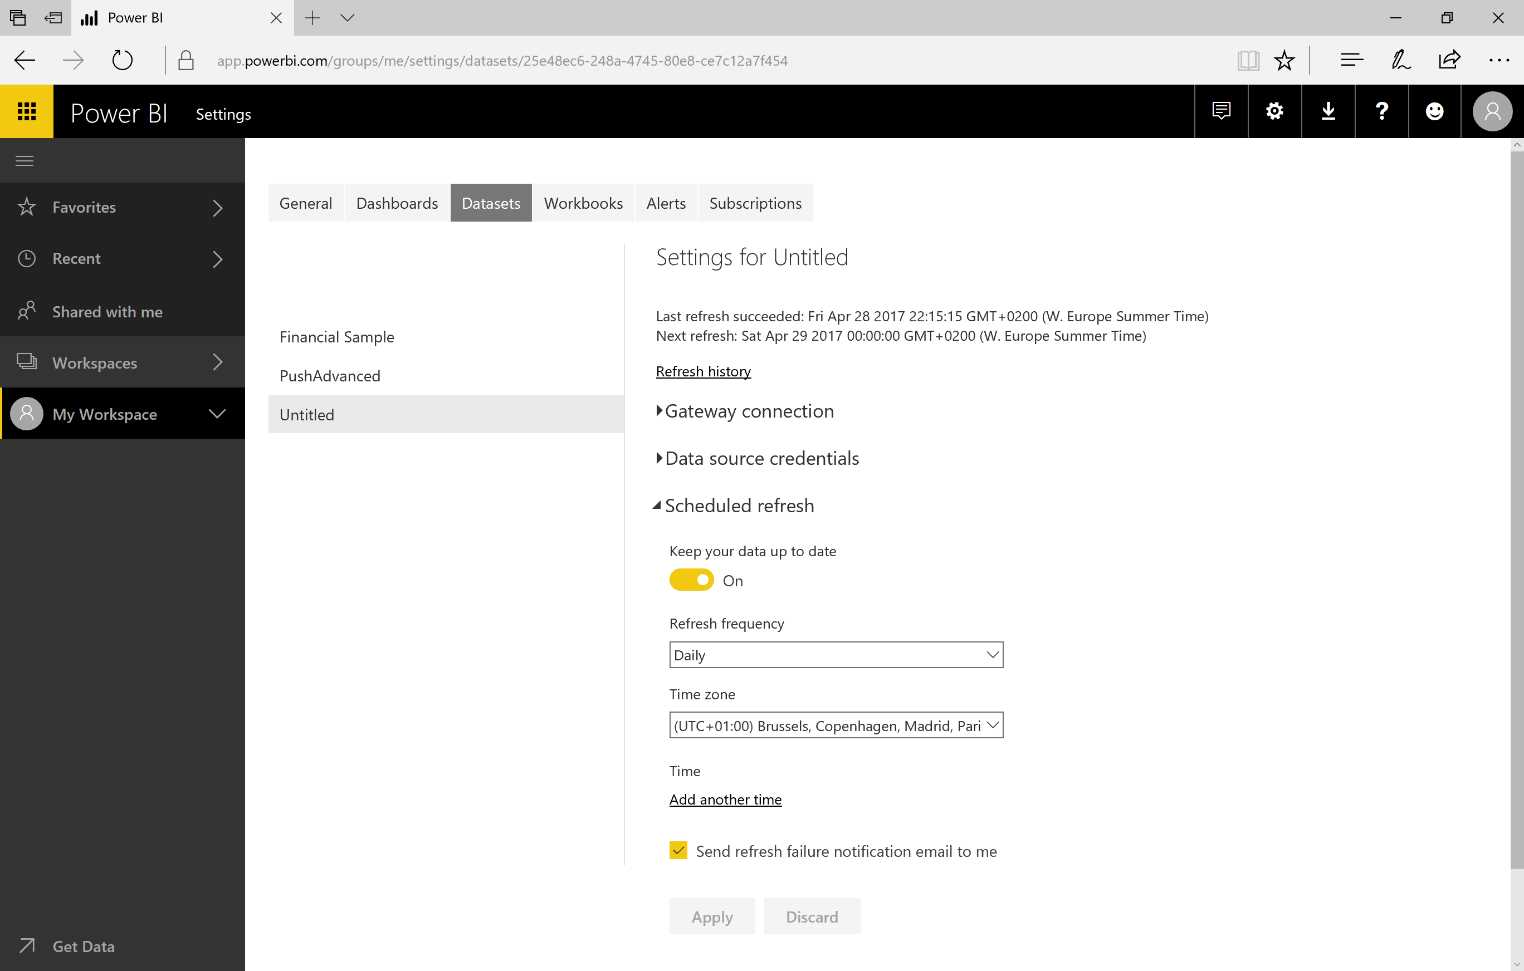
Figure 140: Datasets—Scheduled refresh
When we schedule the data refresh, Power BI should keep the credentials used to carry out the query of the data sources. We will be asked to provide the credentials, which will be kept securely in the cloud.
Now let’s look at an example of how to implement an automatic refresh for the Excel workbook.
Typically, when working on-premises we can update the data. If we use an Excel workbook with a data source on the SQL Server, the database is AdventureWorks, and if we modify some data, the modification should also be mentioned in the reports and in the dashboard of Power BI.
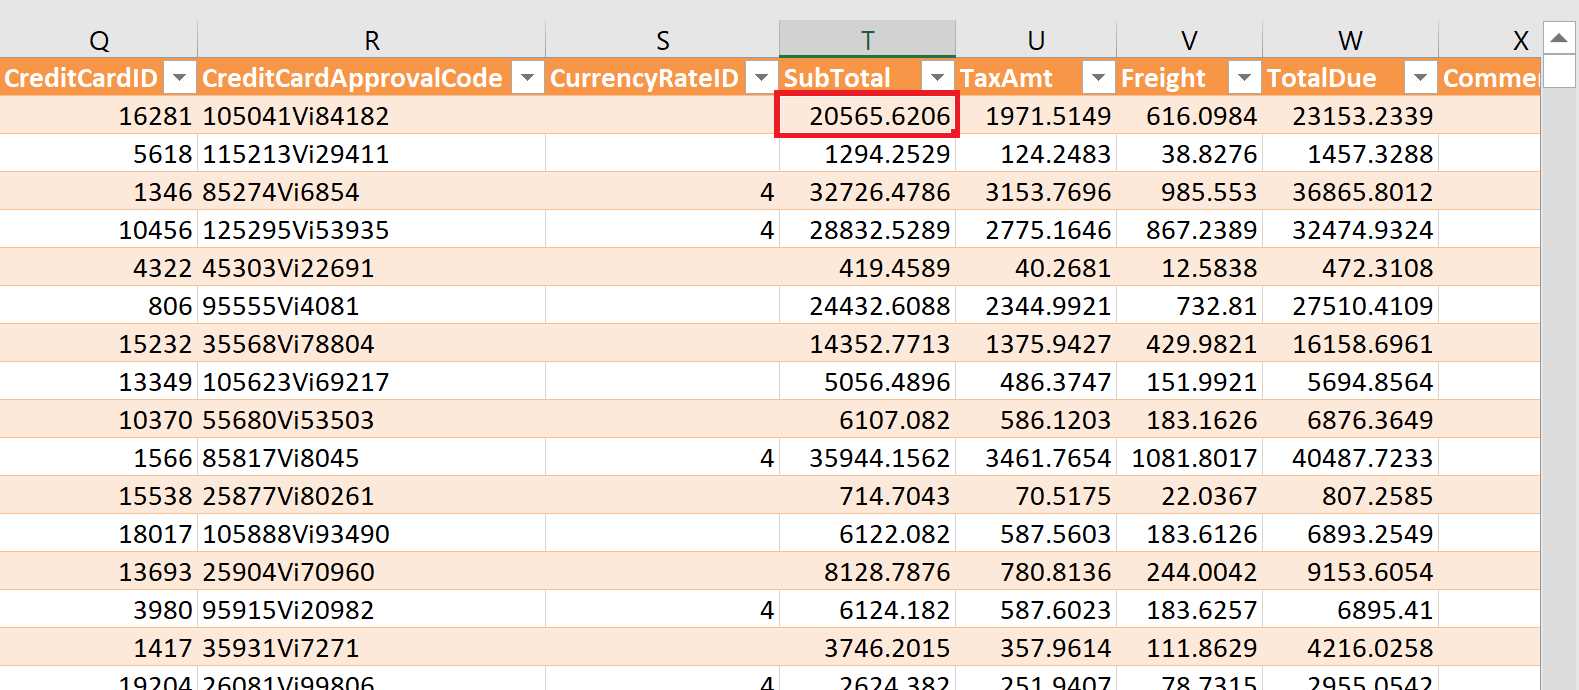
Figure 141: Excel Workbook
In Power BI Service, we add a new report page with a new visualization about the SubTotal column sum.
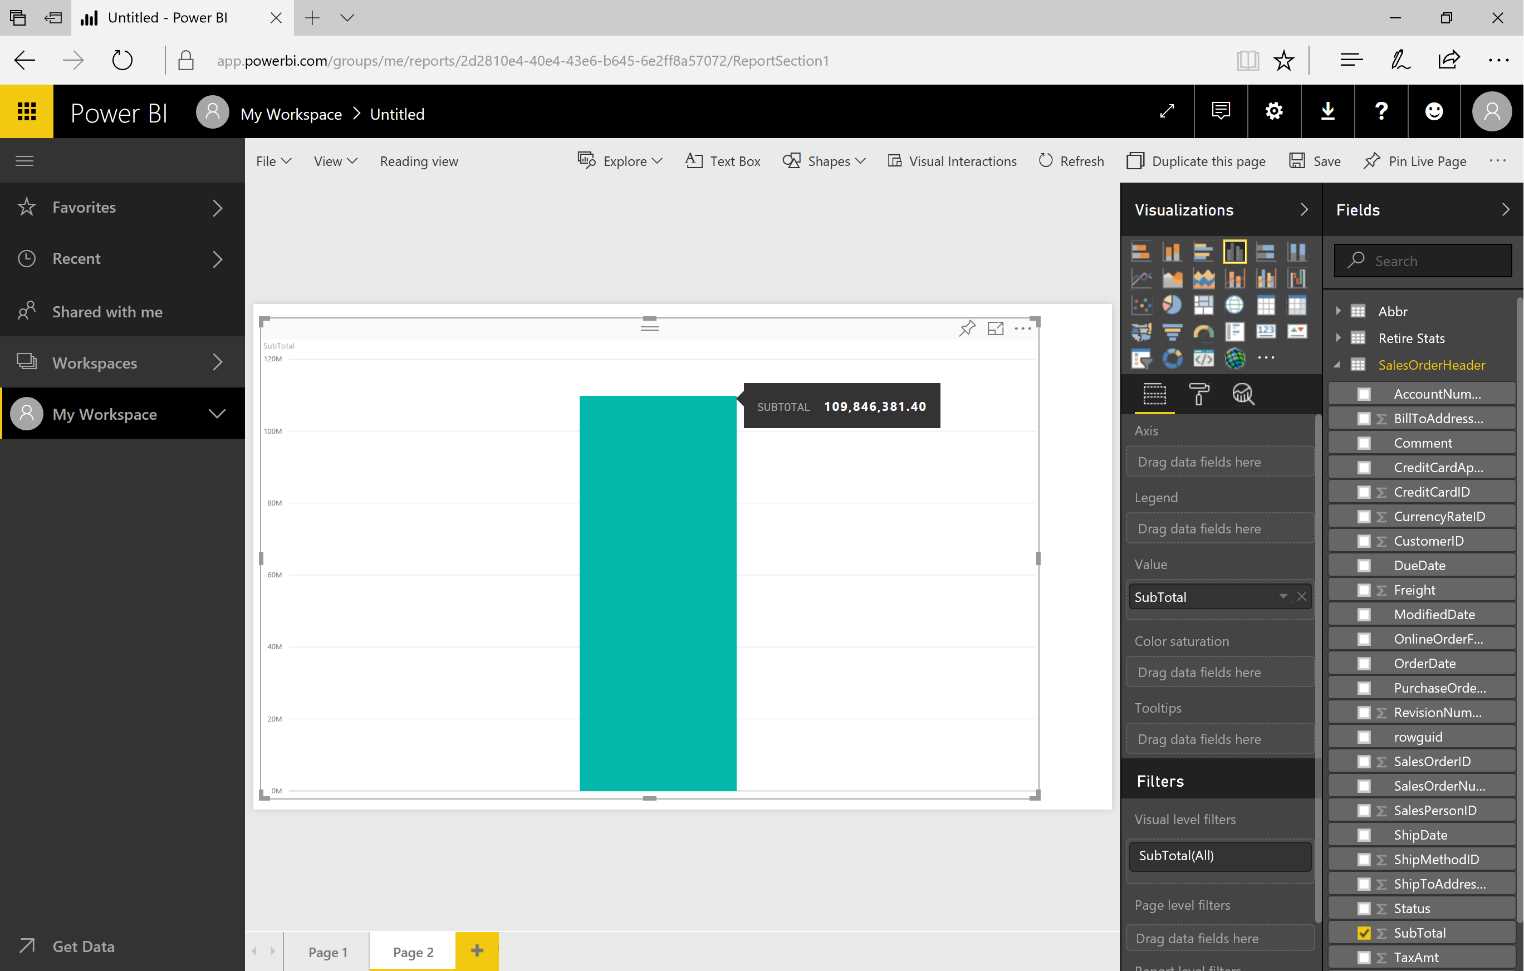
Figure 142: Power BI Service Report
Next, let’s make a modification that cannot go unnoticed in our report. We’ll update the SubTotal field from 20565.6206 to 205656.206. Now let’s open the Excel workbook and run a data refresh.
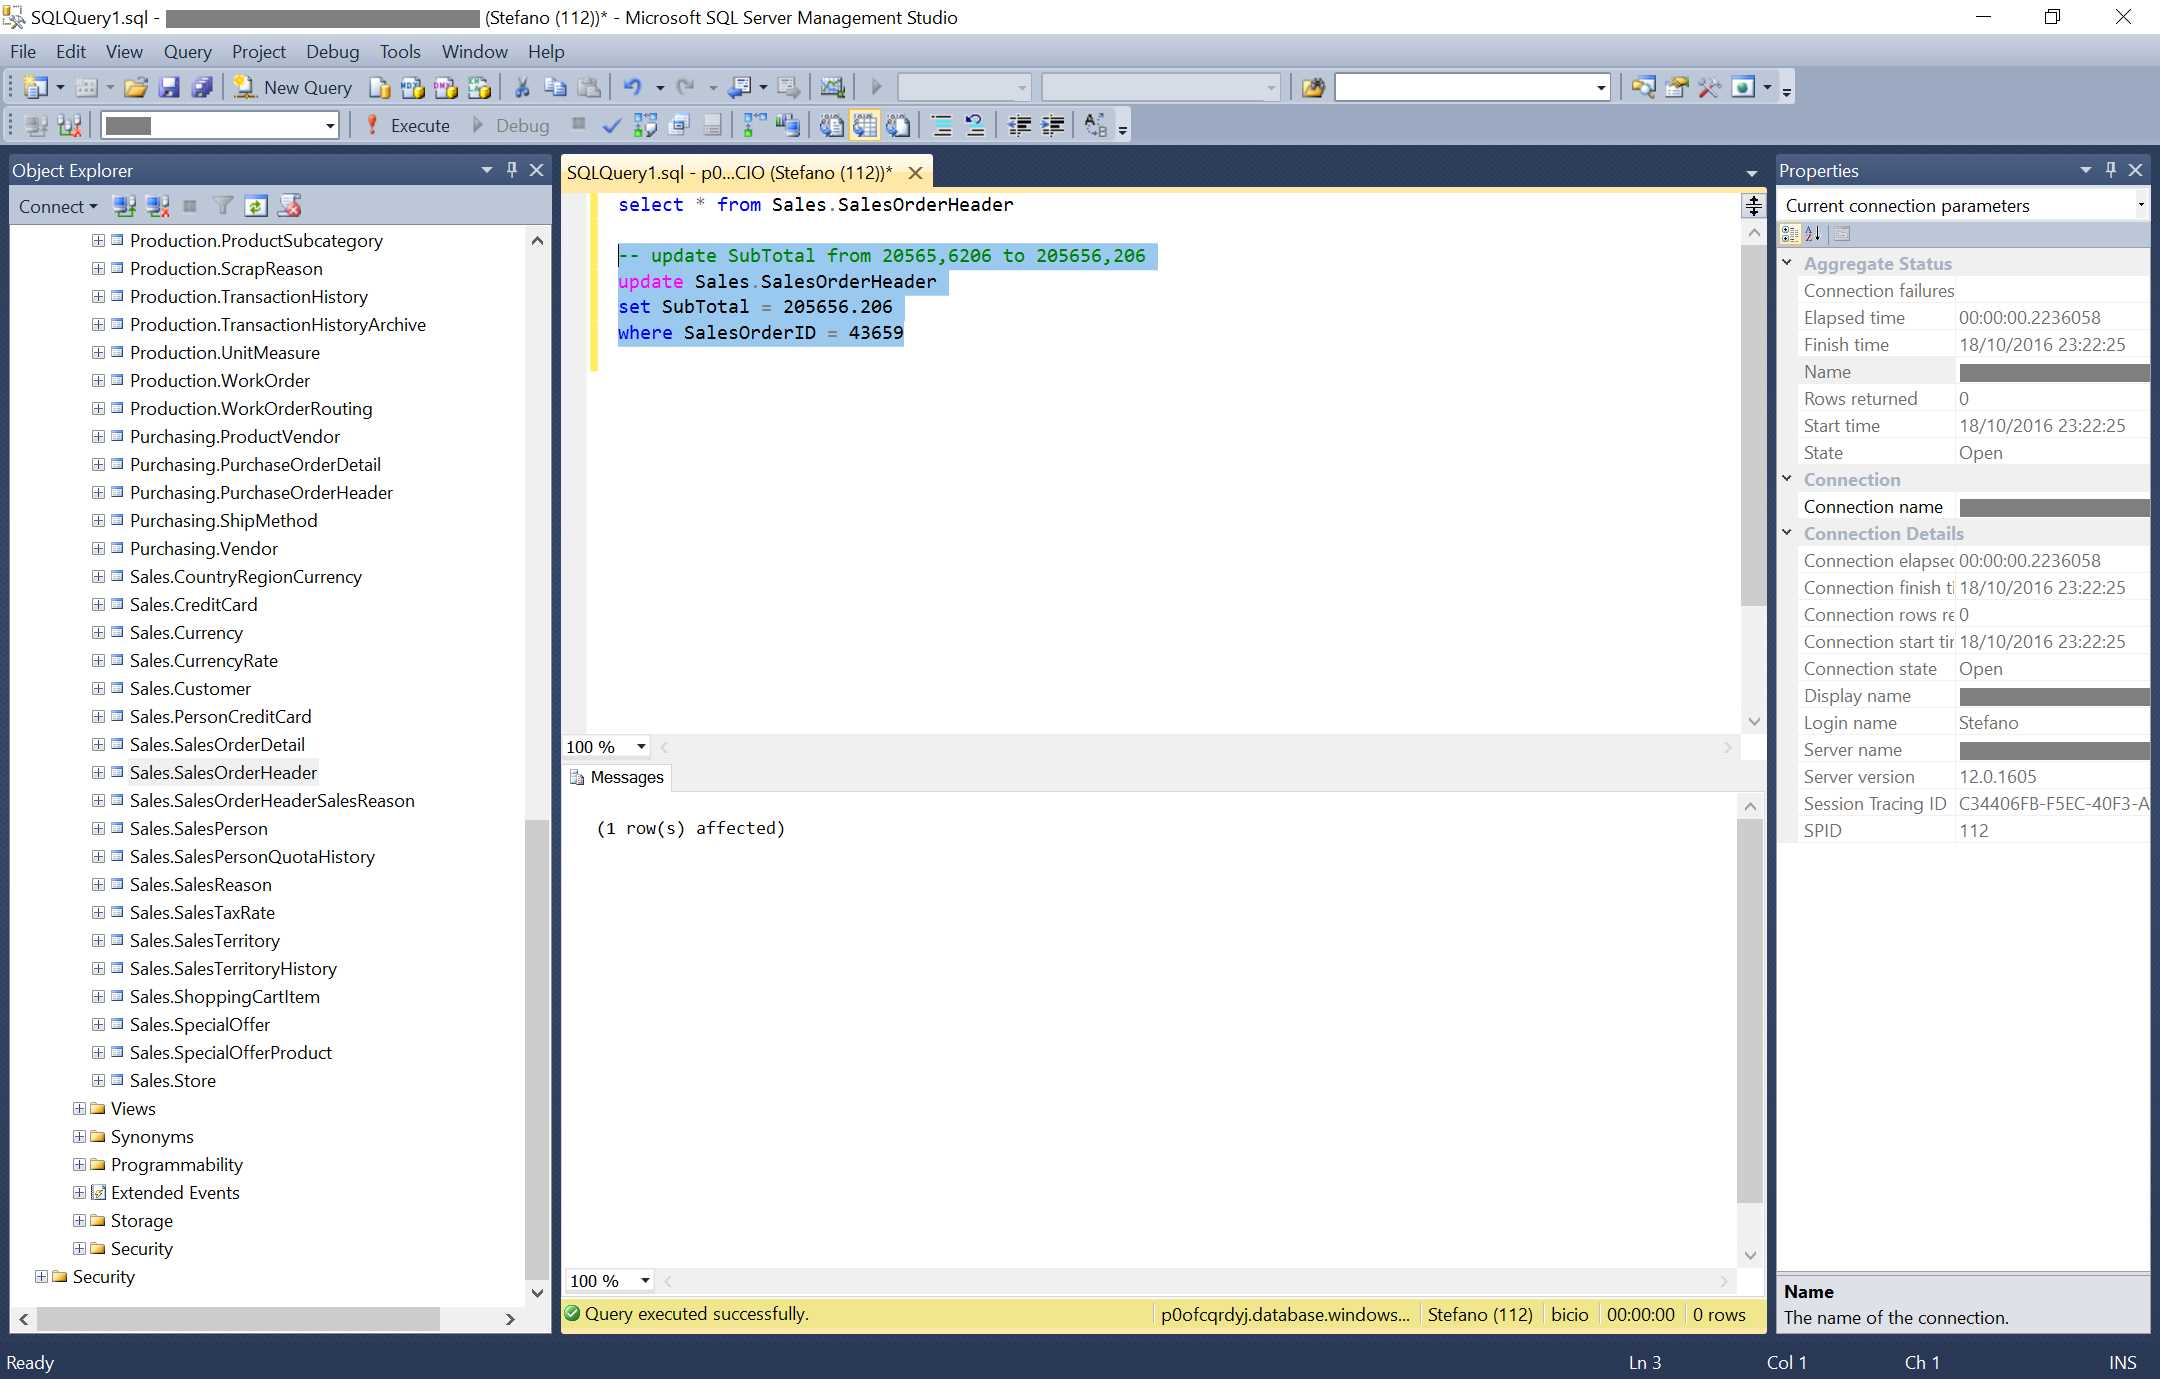
Figure 143: Update Query in Microsoft SQL Server Management Studio
After waiting, we should see that everything works correctly.
Figure 144 shows an update to the dataset of the Excel workbook, achieved by running the manual refresh.
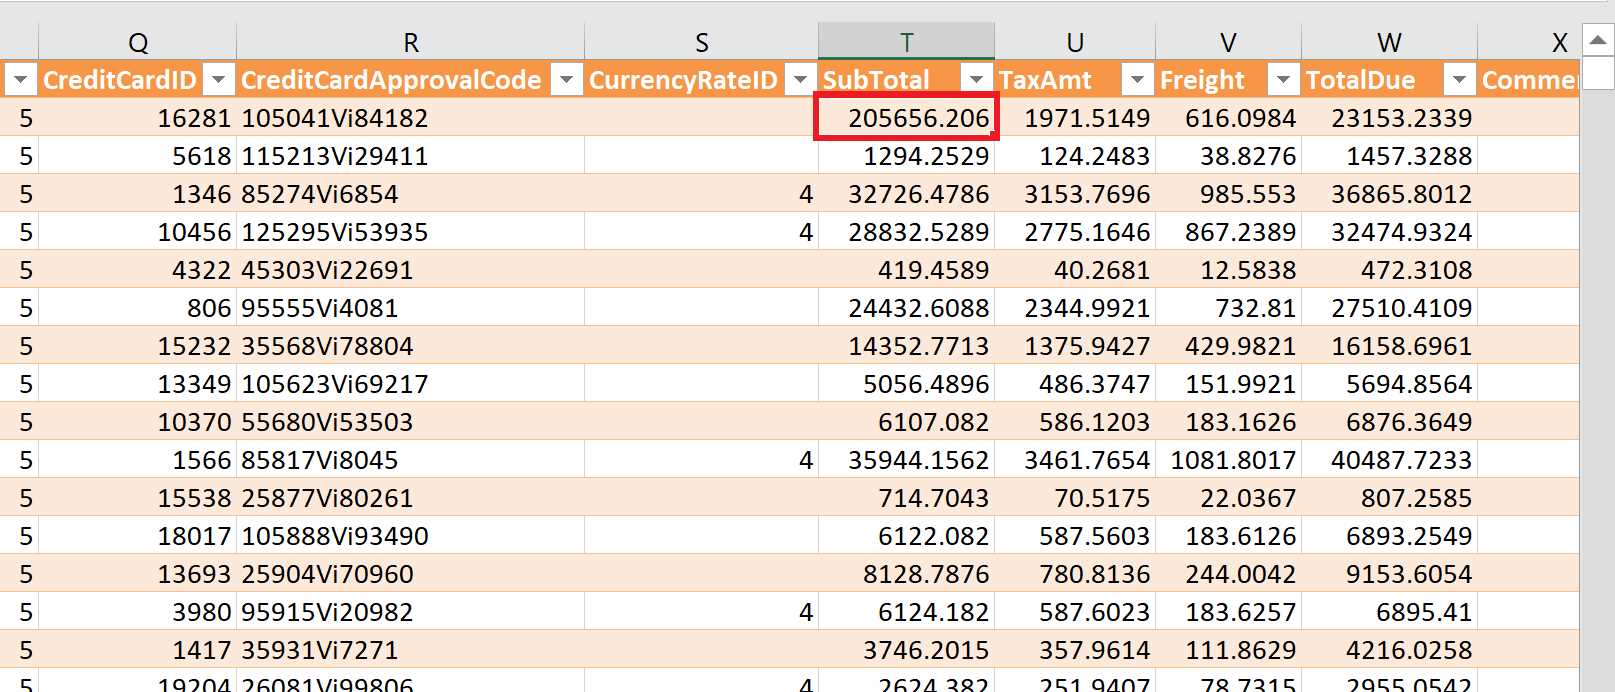
Figure 144: Excel Workbook
Power BI Gateway
After considering the previous example, we need to configure the Personal Gateway in order to refresh the Excel data. In the case of Excel workbooks, which have no connections to external sources, the error message will not appear and the data will be updated without any problems.
To install the Personal Gateway, we need to download the program by accessing the gateway pages at https://powerbi.microsoft.com/en-us/gateway and install it. Once the installation is finished, we can set up the Personal Gateway.
Figure 145 shows the steps for installing and configuring our Personal Gateway.
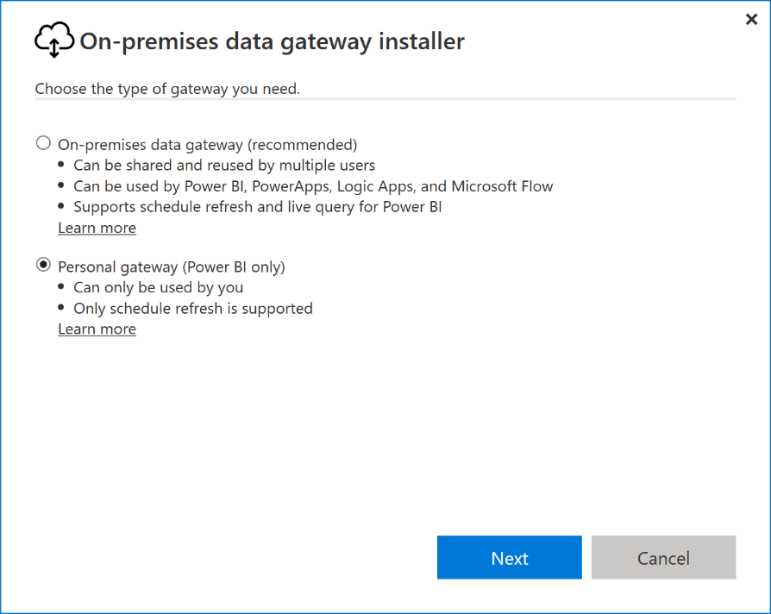
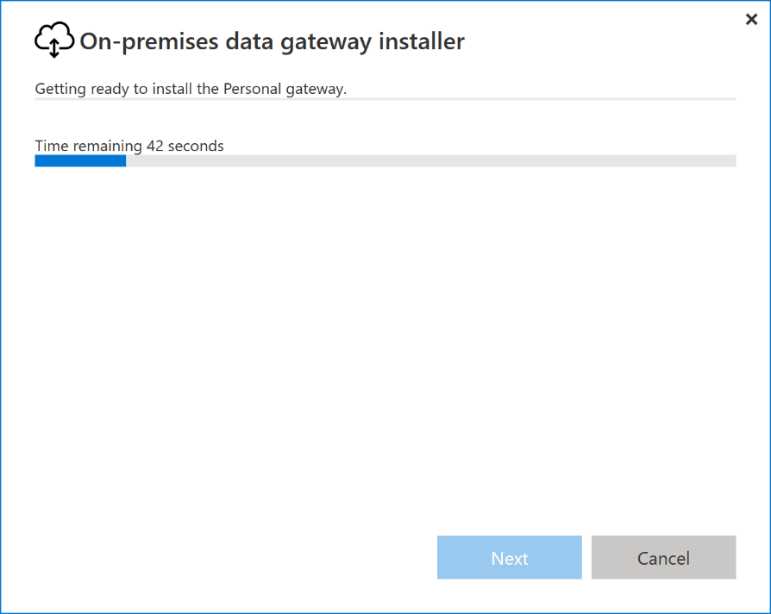
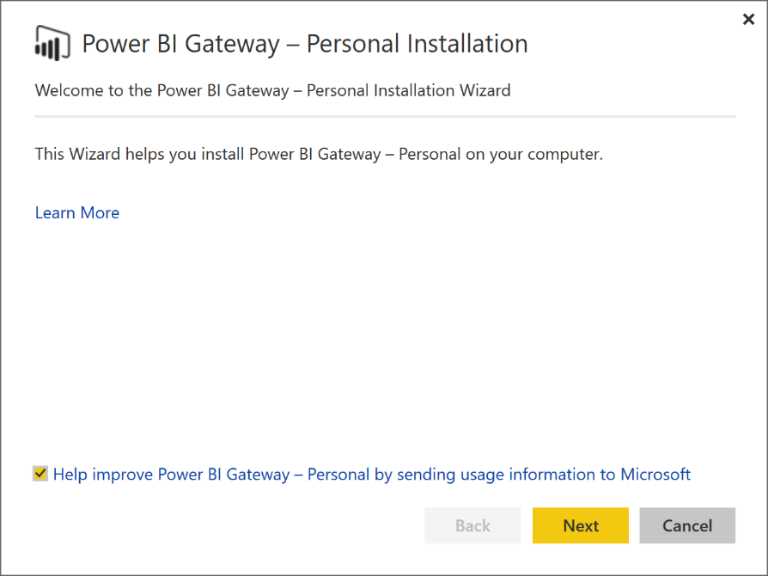
Figure 145: Personal Gateway Installation—sequence
We start with the Personal Installation Wizard. We’ll see some advertising, then we can click Next.
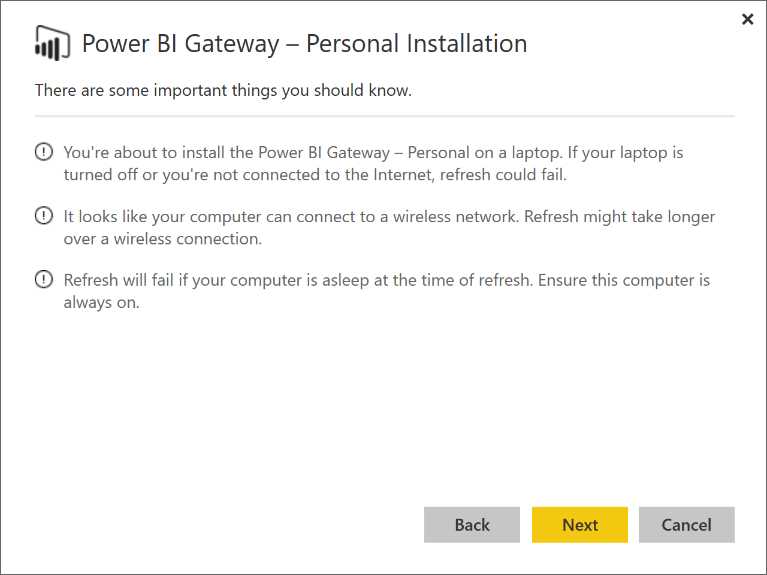
Figure 146: Personal Gateway Installation
As Figure 147 shows, you’ll be asked to accept the license agreement. Do so.
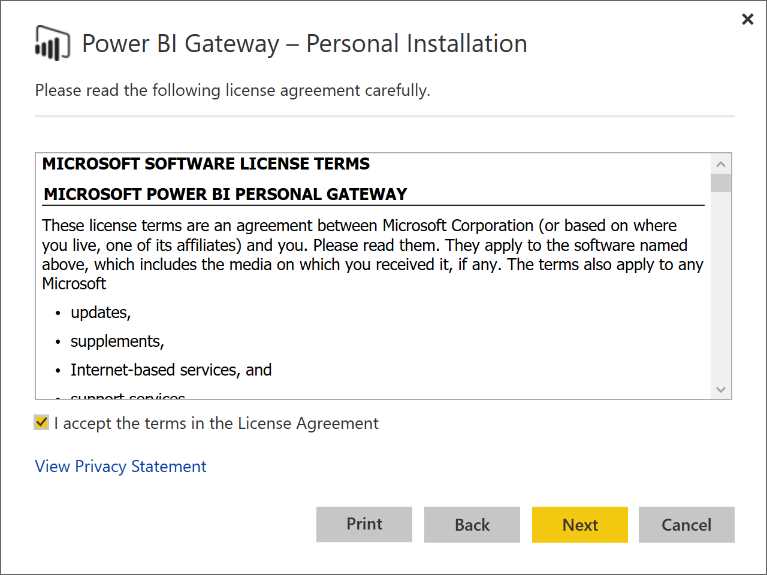
Figure 147: Personal Gateway Installation
Next, let’s select the Installation folder.
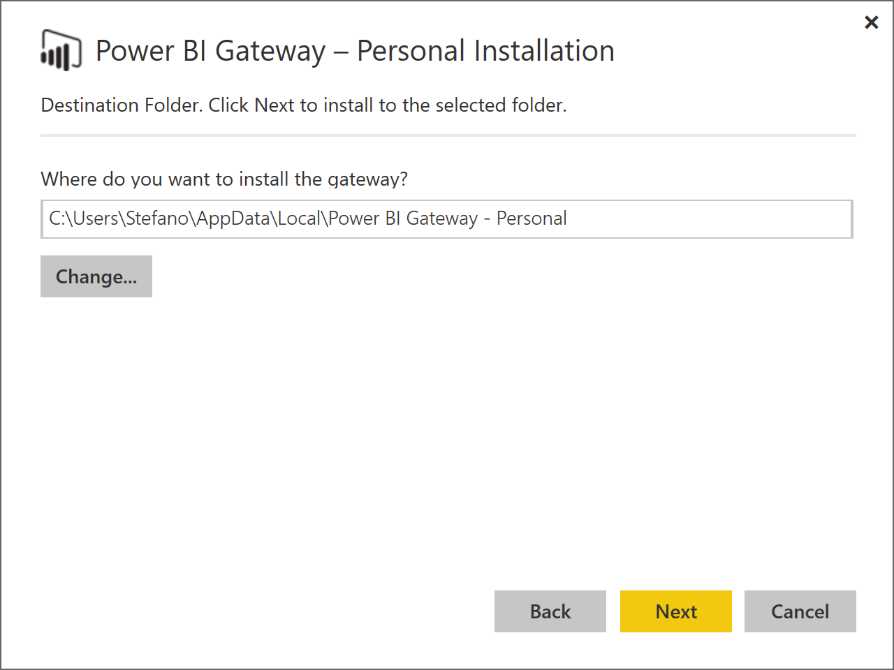
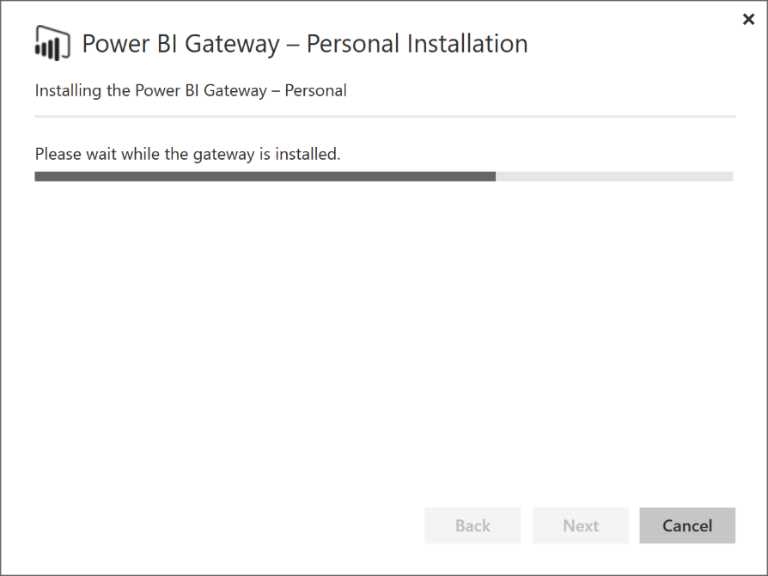
Figure 148: Personal Gateway Installation—sequence
Next, we sign in and provide our credentials.
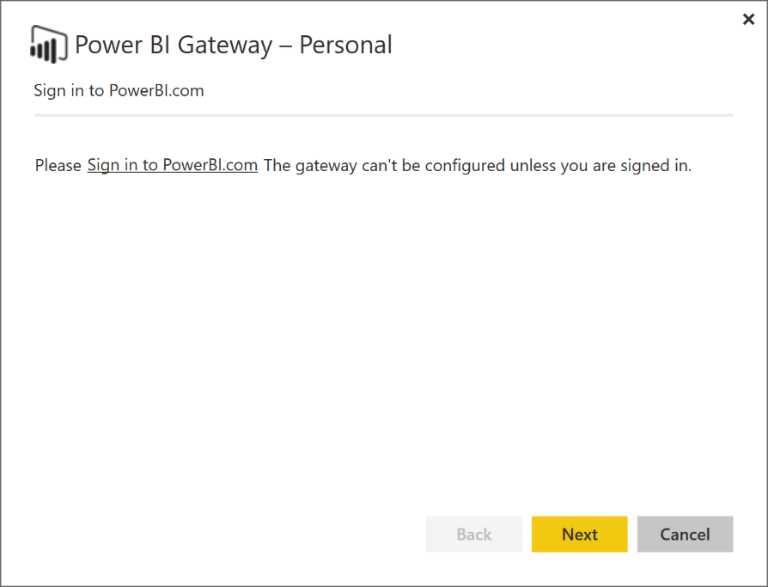
Figure 149: Personal Gateway - Sign in
Figure 150 shows the sign-in process.
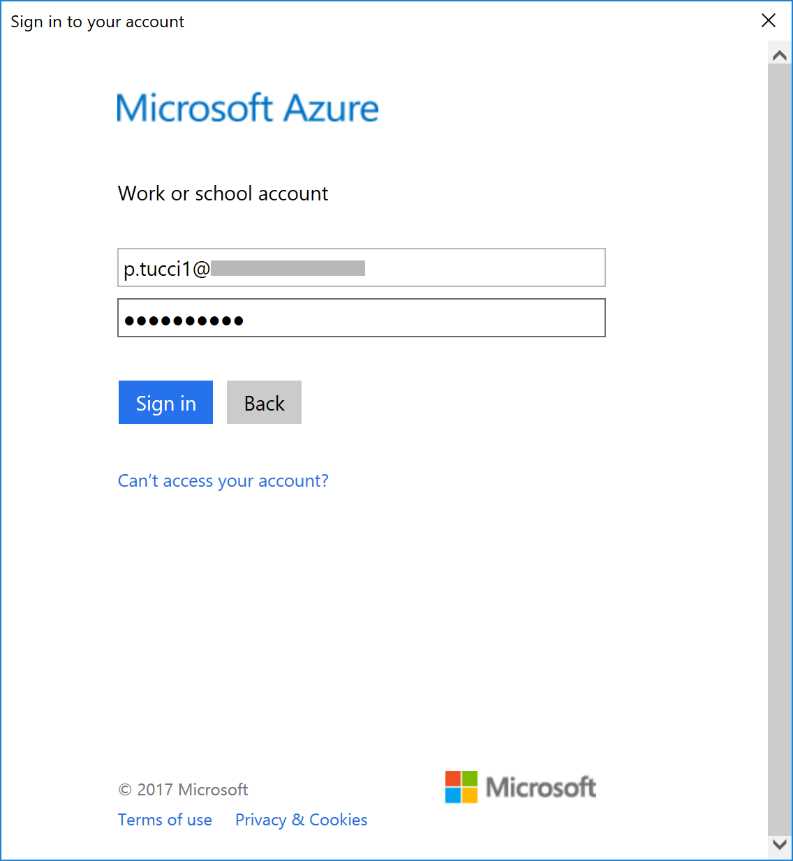
Figure 150: Sign In
This is how the Personal Gateway connects to the dedicated Azure Services Bus channel in order to establish communication with Power BI. When the authentication has occurred successfully, the Personal Gateway is online.
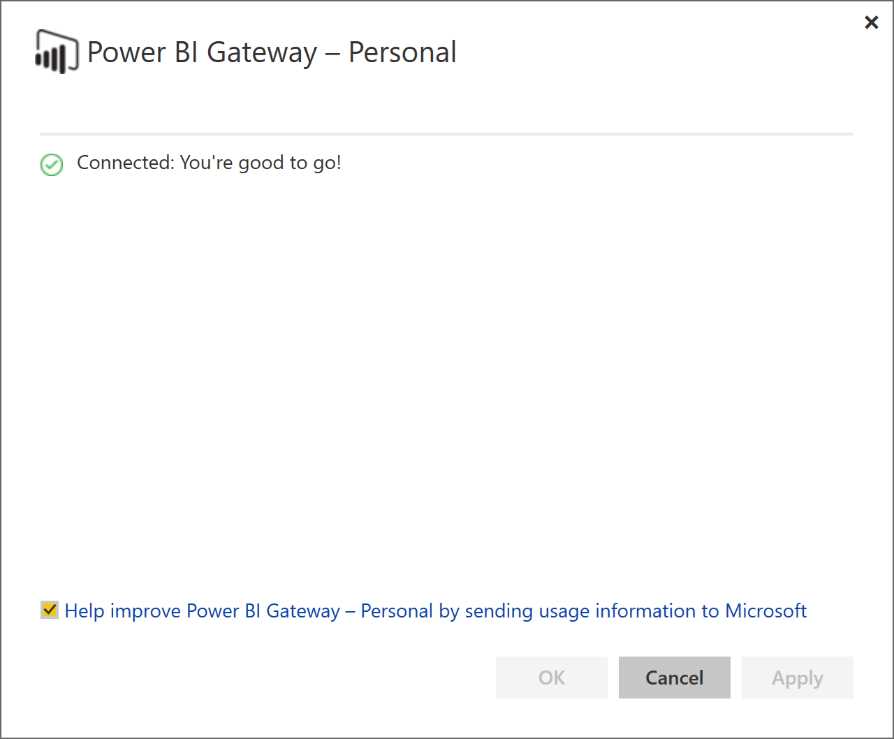
Figure 151: Personal Gateway—connected status
We also need to provide the credentials that will be used by Power BI to carry out the refresh. We can check the status on Power BI Service.
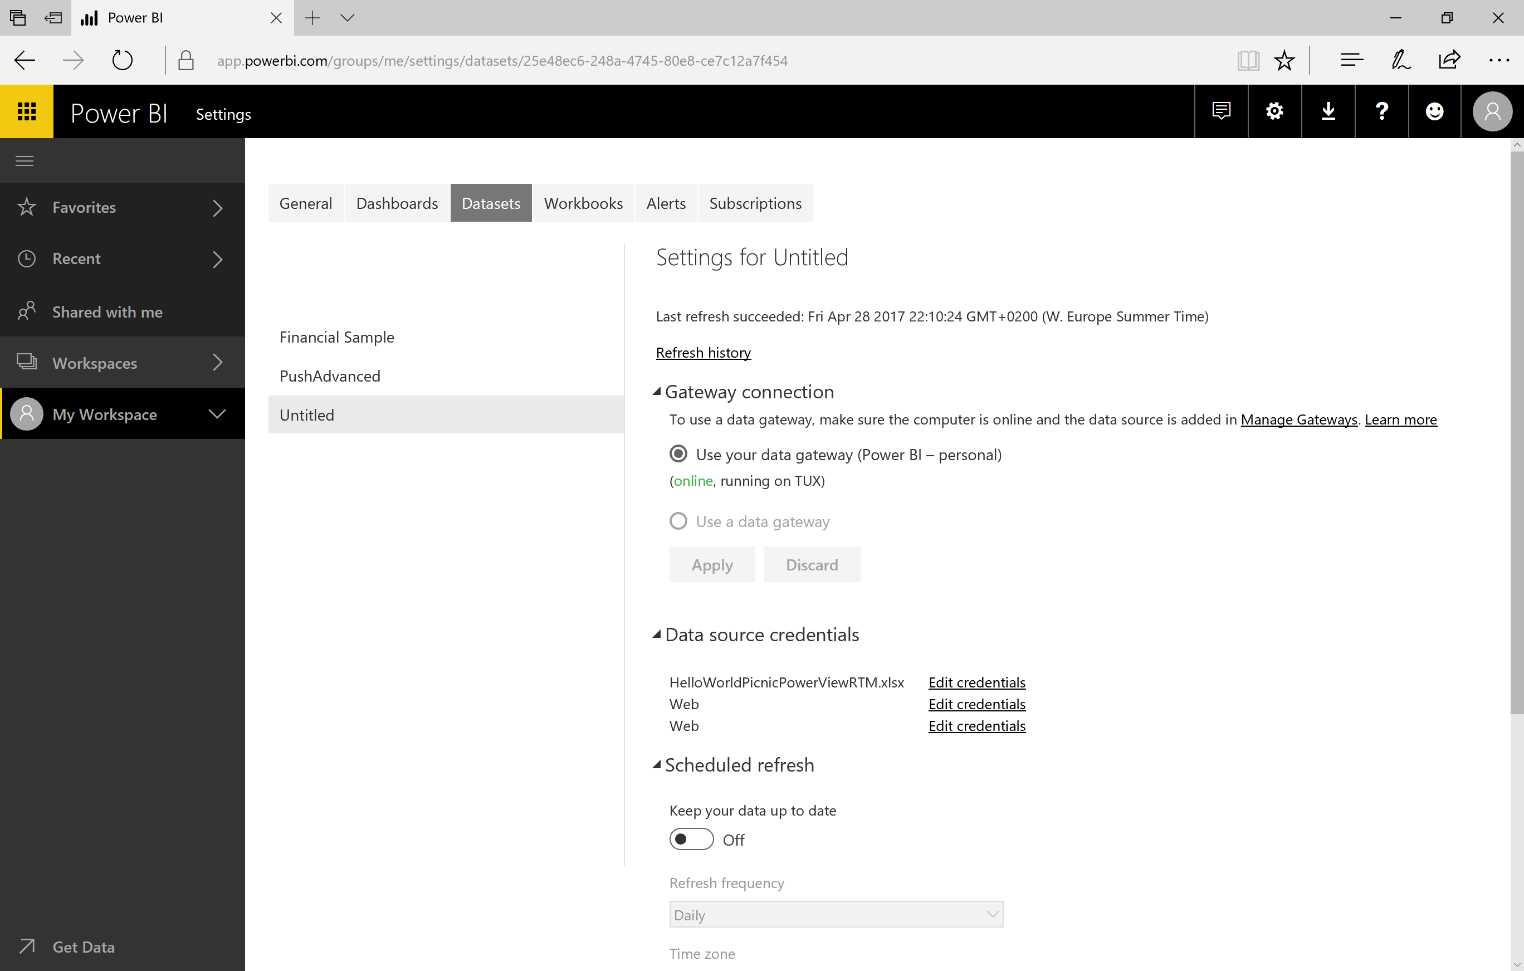
Figure 152: Gateway Connection Settings
In this case, we use the Windows Authentication, which means it is not necessary to provide the credentials because the Personal Gateway service credentials will be used. At this stage, the refresh is set up and it can be scheduled.
Note that we can add different timetables because we are using a Power BI Pro License; conversely, if we use a Power BI Free license, we can update only once per day.
We can go back to the dataset, click the data source, which contains the connection to the external SQL data, and run “Refresh now.”
Therefore, we can use the Personal Gateway to complete a data update even if the data sources are on-premises.
Next, after the dataset refresh, we can go to the report and see data updates. The SubTotal is displayed, as in Figure 153.
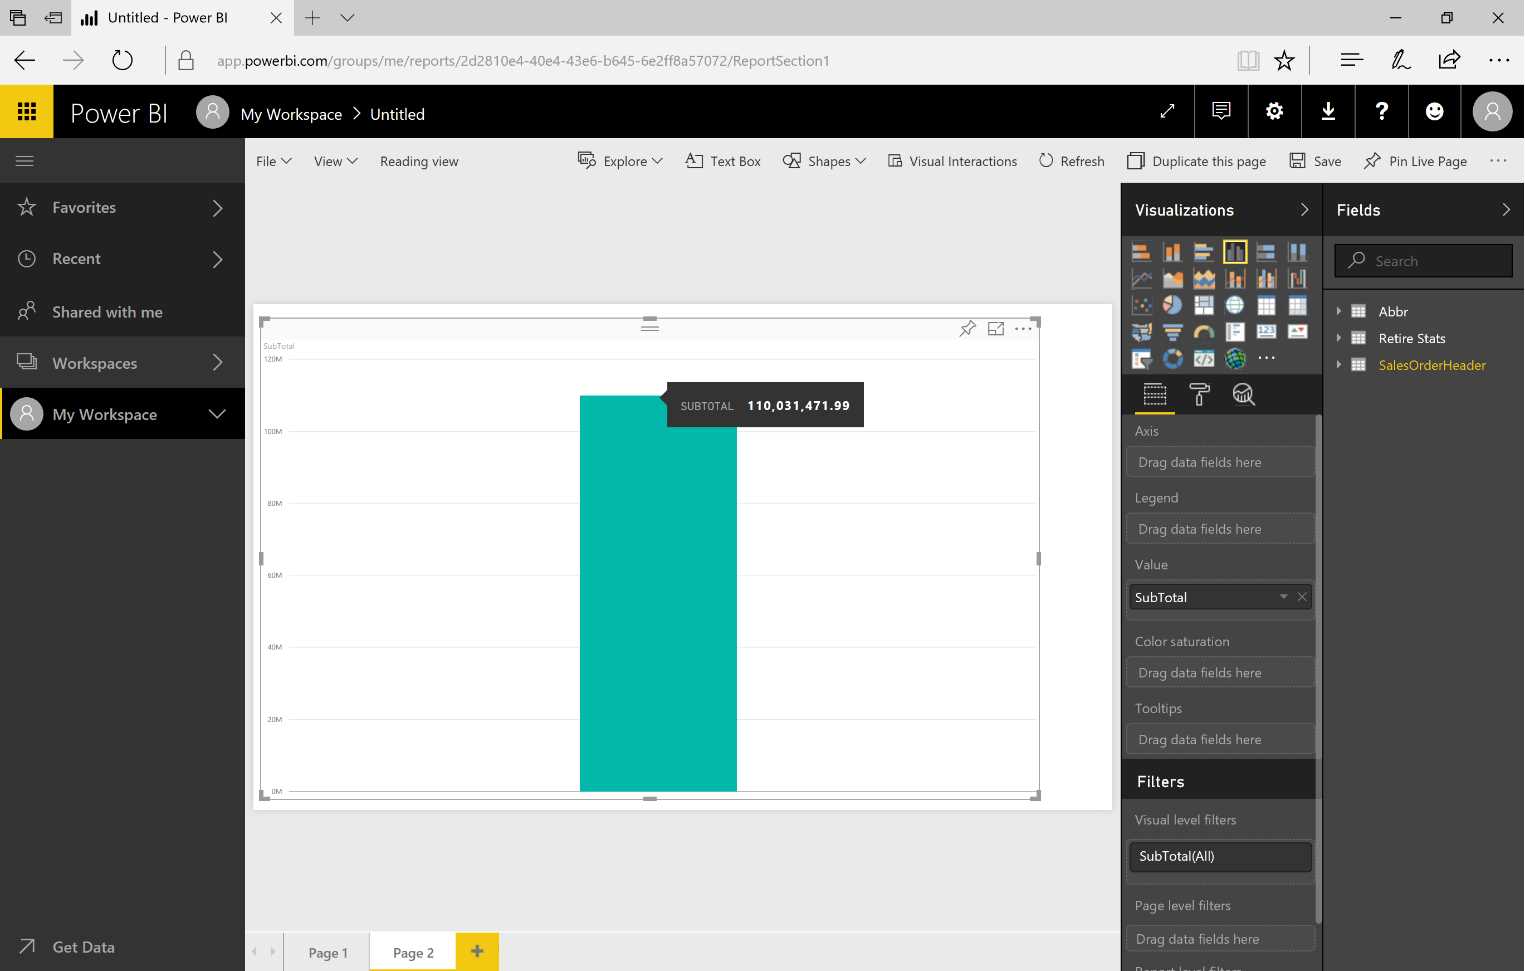
Figure 153: Power BI Service Report
- 1800+ high-performance UI components.
- Includes popular controls such as Grid, Chart, Scheduler, and more.
- 24x5 unlimited support by developers.