
Power BI Succinctly®

CHAPTER 7
Power BI Embedded
Power BI Tiles
Power BI can be embedded in the Office suite (for example, PowerPoint).
In PowerPoint, it is sufficient to insert an add-in from the ribbon via the Insert, Store within the Add-ins section. We must look for Power BI Tiles in the store and install it; if it is installed, we must recall it in the Add-ins section.
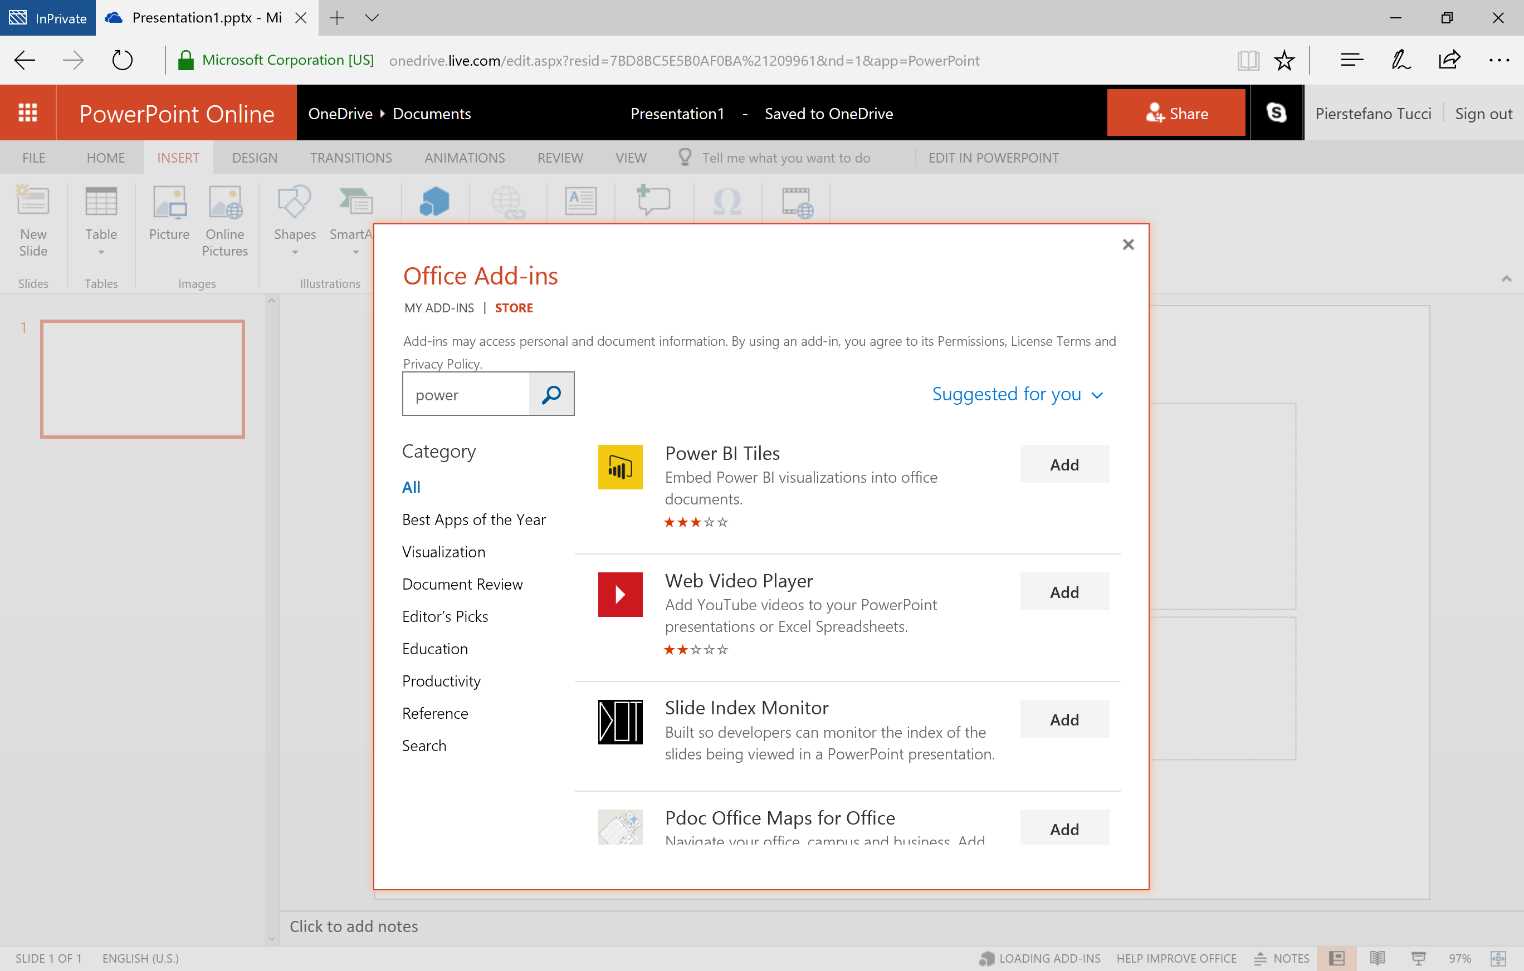
Figure 182: PowerPoint Online—Office Add-ins
Now we select the data using the From Power BI button.

Figure 183: PowerPoint Online—Power BI Add-in
We log on automatically to our Power BI in the Personal Workspace.
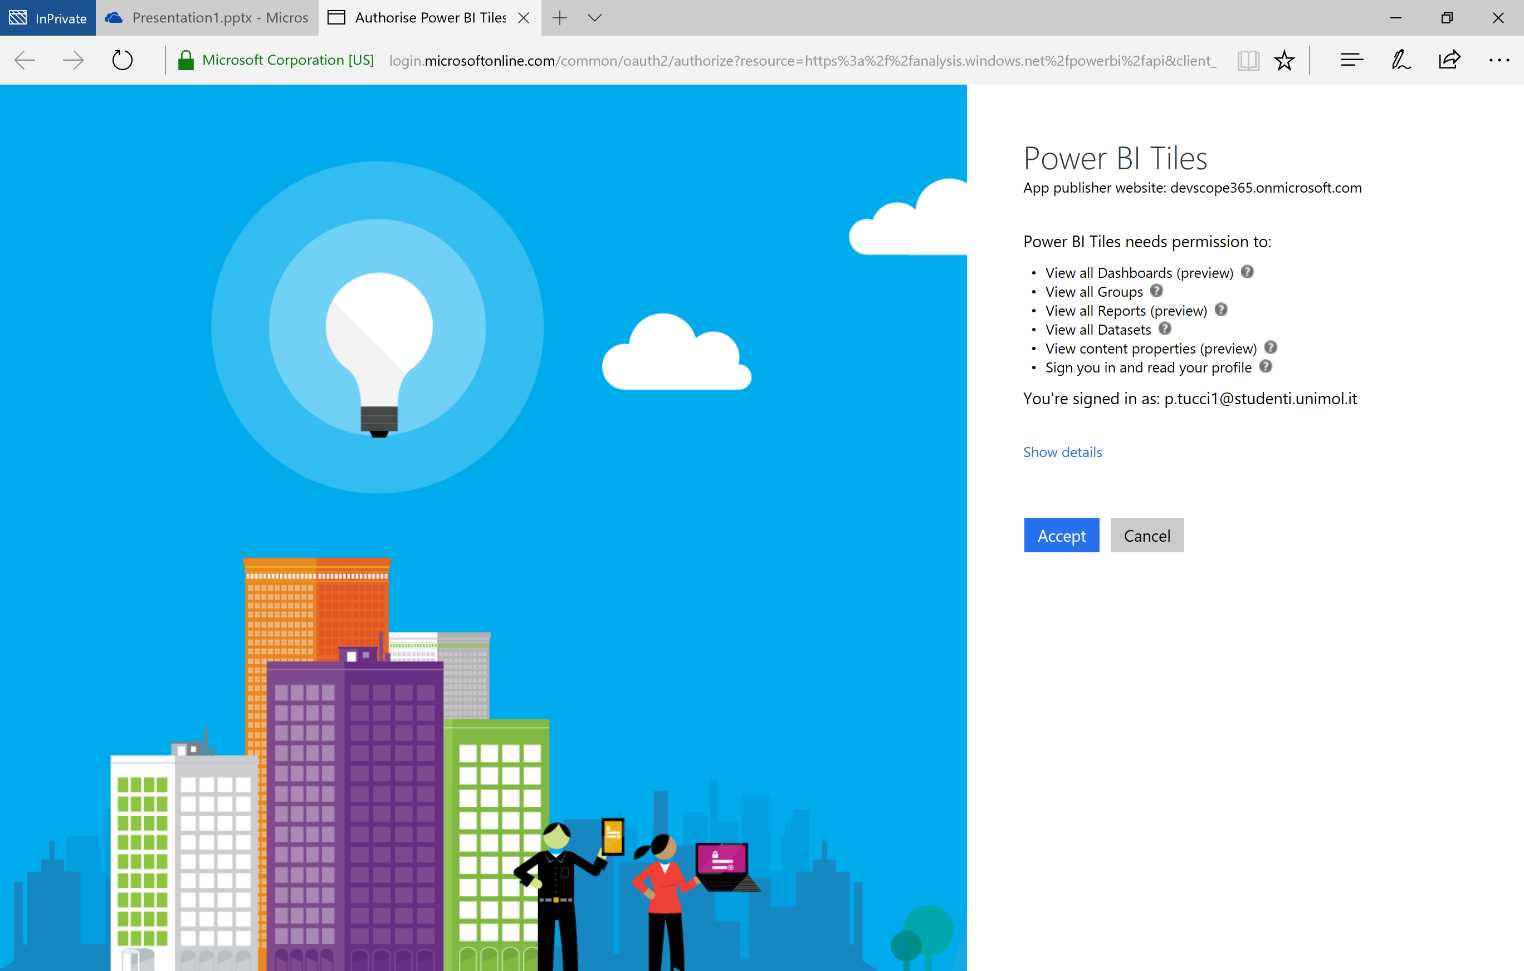
Figure 184: PowerPoint Online—Power BI Add-in, authentication
Next, we select a dashboard.
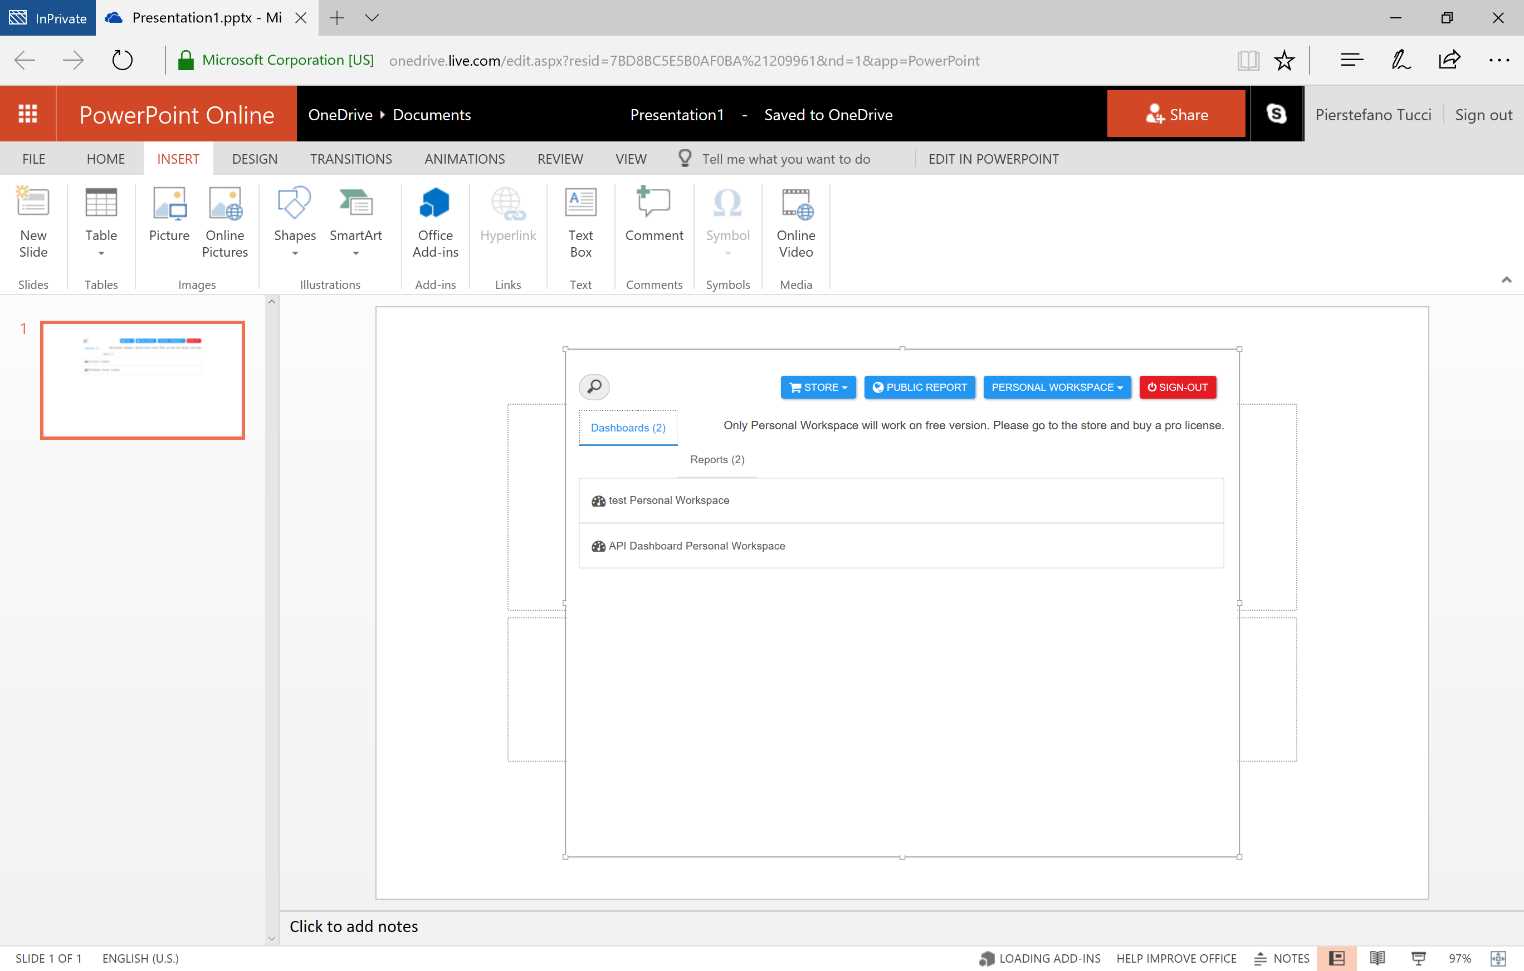
Figure 185: Power Point Online—Power BI Add-in
The selectable reports are displayed according to the selected dashboard.

Figure 186: PowerPoint Online—Power BI Add-in
We can also run a tile refresh. Power BI allows you to update data and information dynamically in a way that’s somewhat analogous to the way online speakers join and leave a group conversation.

Figure 187: PowerPoint Online presentation with Power BI Dashboard
Power BI Embedded
What is Power BI Embedded
With Power BI Embedded, we can integrate the Power BI report directly into our web or mobile apps.
Power BI Embedded is an Azure service that allows app developers to bring the Power BI experience and intelligence to their applications. The applications that integrate Power BI Embedded have users with distinct licensed functionalities. Those applications can also access data elements incorporated as graphs and reports, which can now be fed through Microsoft Power BI Embedded. The users do not need a Power BI account to use the app. They can continue accessing the application as before without authentication, as well as displaying and interacting with the Power BI reports without needing possible further licenses.
Licensing for Microsoft Power BI Embedded
In the usage model of Microsoft Power BI Embedded, the licensing for Power BI is not the responsibility of the end user. Instead, the sessions and the service are bought by the app developer who has been consuming the graphics as well as paying for the subscription equipped with those resources.
Conceptual model

Figure 188: Conceptual Model
As with any Azure service, the resources of Power BI Embedded are provided through the Azure Resource Manager API. In this case, the resource being provided is present in the Power BI Workspace Collection.
Workspace Collection
A Workspace Collection is an upper-level container of Azure that contains resources and the possibility of zero or more Workspaces. The Workspace Collections have all the standard Azure properties:
- Access keys—keys used when we safely call the API of Power BI.
- Users—Azure Active Directory (AAD) users, who have available administrator rights to manage the Power BI Workspace Collections through the Azure ARM API.
- Region—as part of a Workspace Collection supply, we are able to select a region to carry out the supply.
Workspace
A workspace is a content container of Power BI that can include datasets, reports, and dashboards. Remember that a workspace is empty when it is created. A Power BI Desktop can be used and published in its own workspace by using the Power BI REST APIs.
Use of Workspace Collections and workspaces
Workspace Collections and workspaces are content containers, and they are used to arrange and improve the design of the application being created. We can use many ways to arrange the content within them. We can choose to put the entire content inside a workspace and then, at a later time, use the Application Authentication Tokens (app tokens) to split the content further.
Cached datasets
The datasets saved in the caches can be previewed. However, it is not possible to update the saved data in the cache once it has been uploaded on Power BI Embedded.
Authentication and authorization through the app tokens
Power BI Embedded refers to the execution of the necessary user authentication as well as the authorization back to the application. Azure AD works differently—the application conveys the authorization to carry out the rendering of a Power BI report to Power BI Embedded by using app tokens. These app tokens are created when the application requires the rendering of a report.
The app tokens are used for authentication in Power BI Embedded. There are three types of app tokens:
- Provisioning Tokens—used during the supply of a new workspace inside a Workspace Collection.
- Development Tokens—used in case of calls carried out directly to the REST APIs of Power BI.
- Embedding Tokens—used in the case of calls carried out for the rendering of a report incorporated in the iframe.
These tokens are used for the various phases of the interaction with Power BI Embedded. The tokens are designed in order to delegate authorizations from our app to Power BI.
With Microsoft Power BI Embedded, we can integrate Power BI reports directly into our own web application or mobile applications.
Here are several official online examples:
- Sample dashboard web app
- Power BI Embedded API reference
- Power BI Embedded .NET SDK (available via NuGet)
Configure the example application
We need Visual Studio to display the examples. Even the 2015 or 2017 Communty Edition versions will work okay.
- Download and decompress: Power BI Embedded. Integrate a report into a web app sample on GitHub.
- Open PowerBI-embedded.sln in Visual Studio. You might need to carry out the commands to update the NuGET packets used in the solution.
- Build the solution.
- Run the console ProvisionSample application. In this example, the console application provisions a workspace, and it is possible to import a PBIX file.
- Provision a new workspace in a collection of existing workspaces.

Figure 189: Console Application
Next, we insert the name of the Workspace Collection and the Access Key. Figure 190 shows this procedure in the Azure portal.


Figure 190: Azure Portal—Power BI Embedded, Create a workspace collection—sequence
Copy and save the newly created Workspace ID. You will find this in the Azure portal.
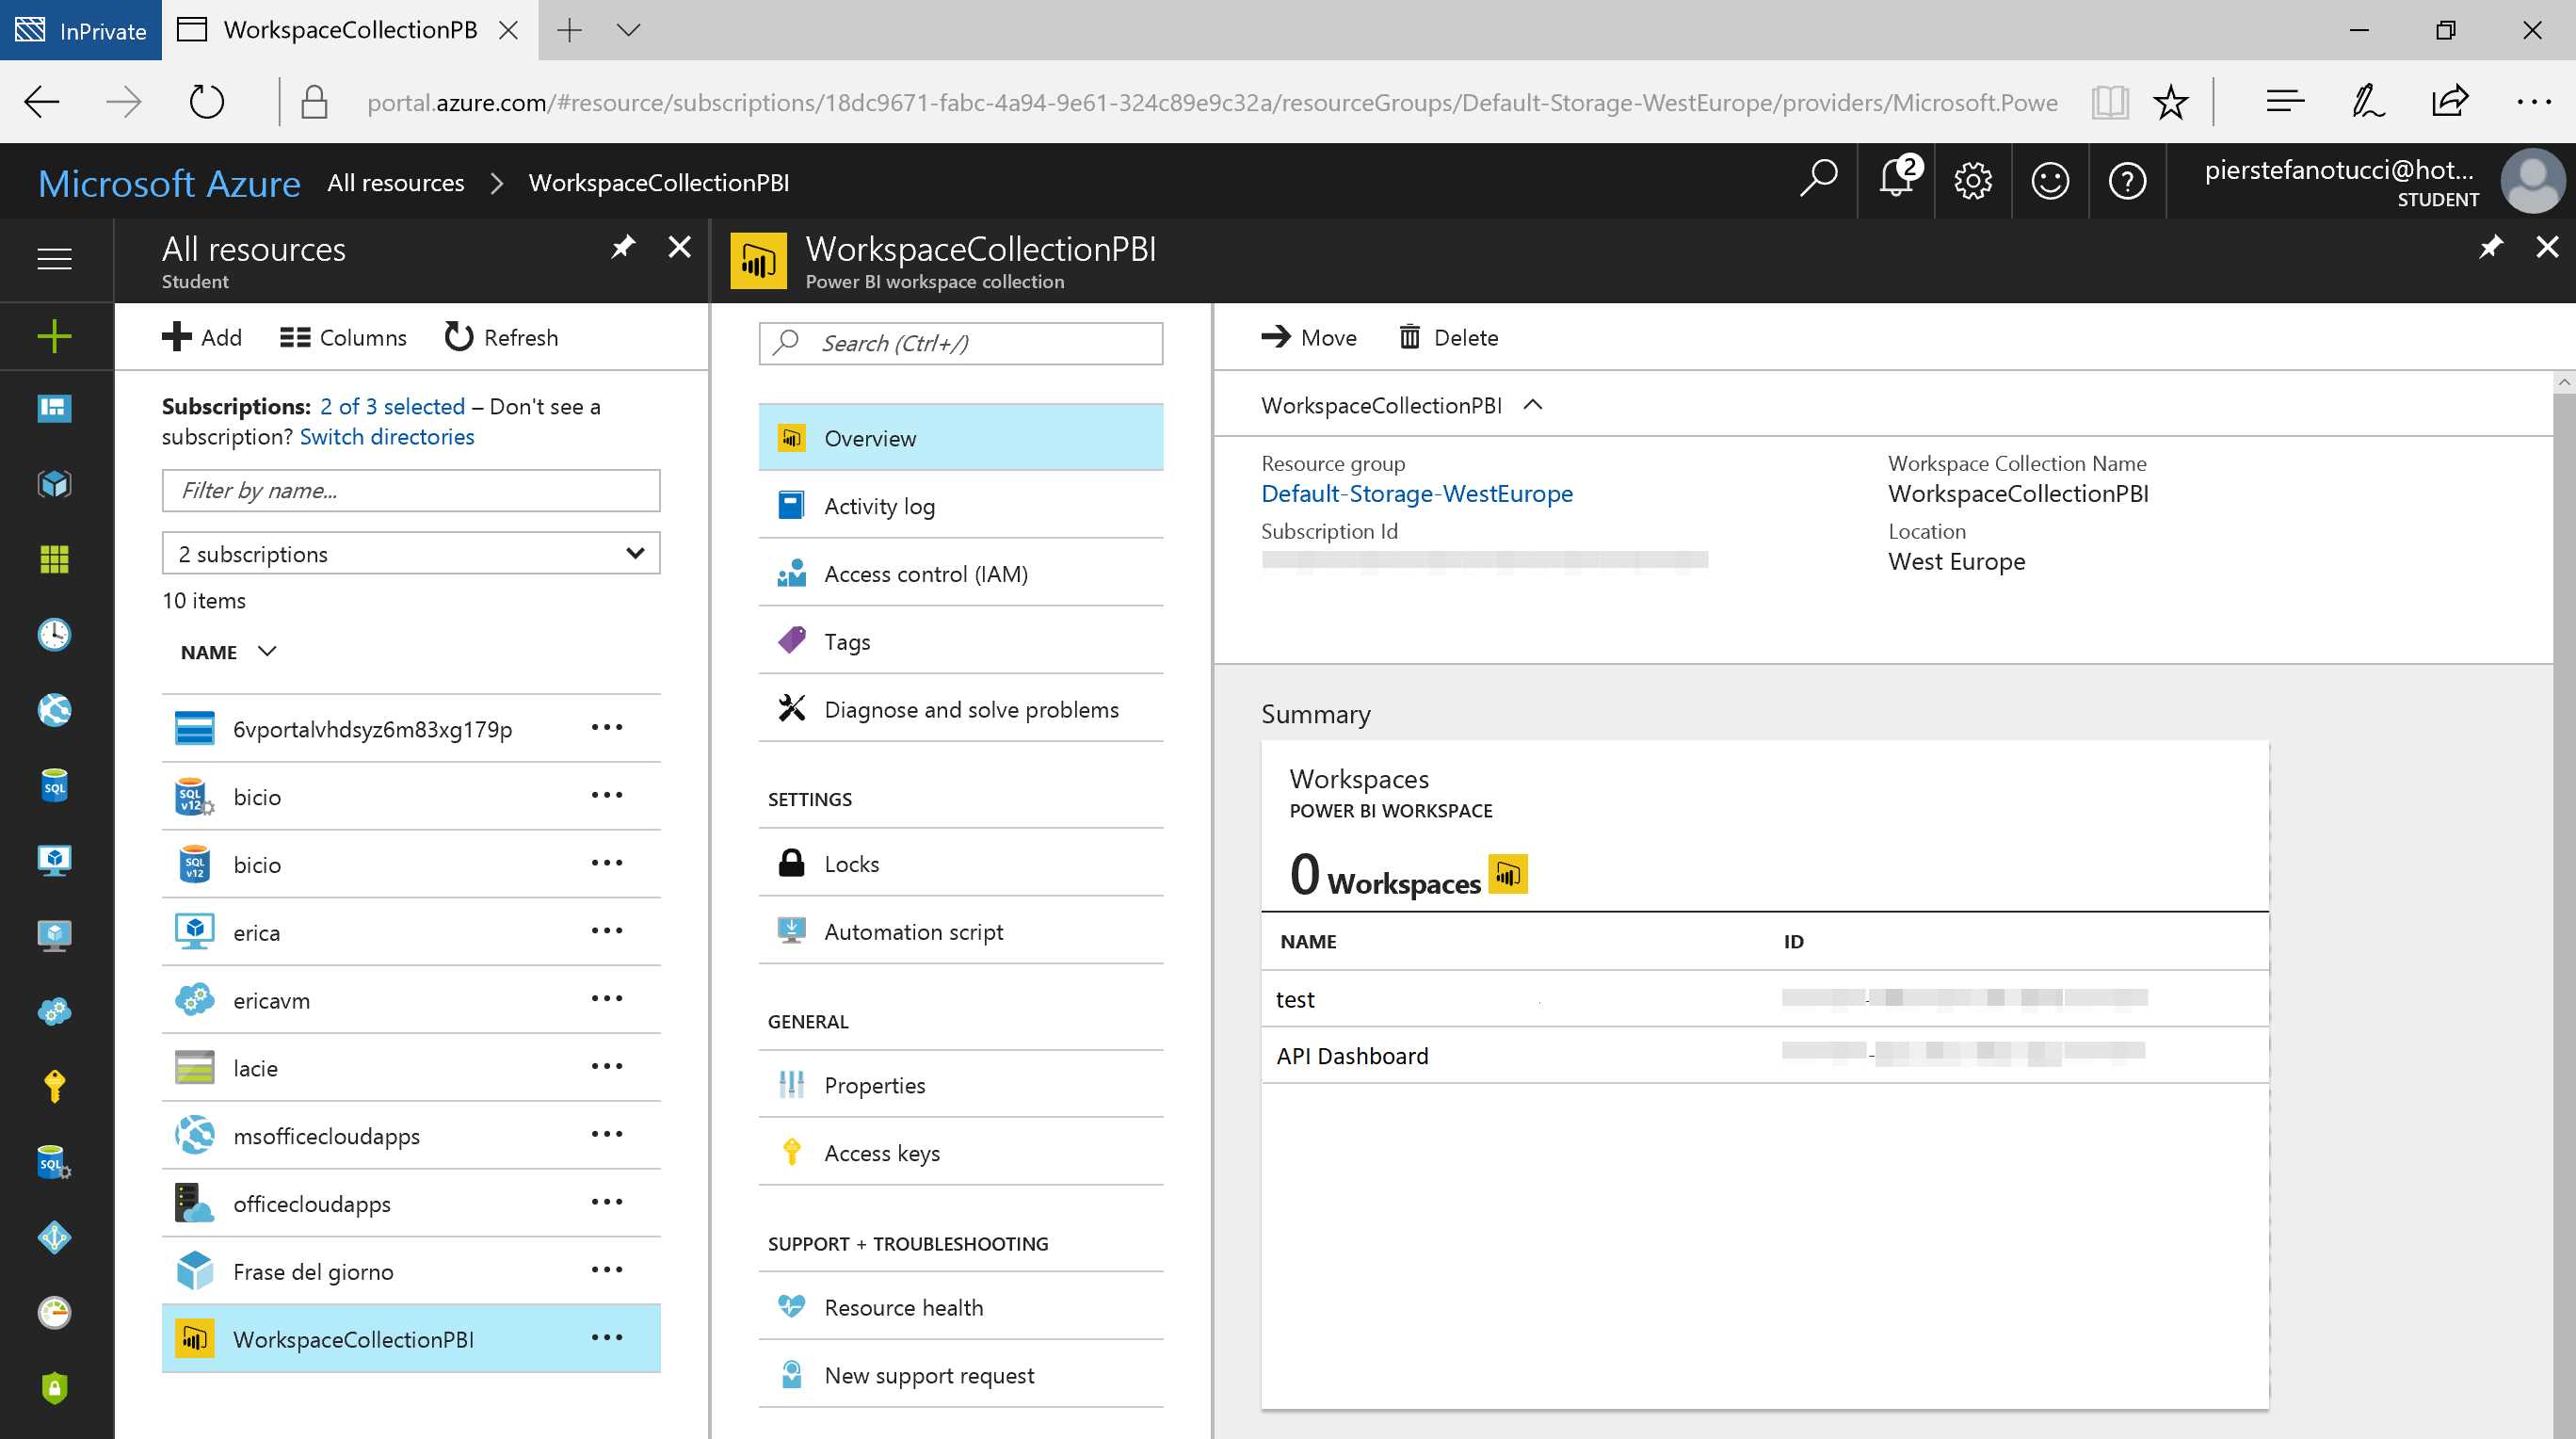
Figure 191: Azure Portal—Power BI Embedded, Workspace Collection
In order to import a PBIX (Power BI desktop file) into an Azure Workspace, you can use an existing workspace or create a new one. If you do not have a PBIX file, you can experiment with an example Retail Sales Analysis PBIX file from Microsoft.
Insert a descriptive name for the dataset content if one is requested.
At this point, the Power BI PBIX file has been imported into its own workspace.
Run the sample web app
The web application example is an example dashboard that carries out the rendering of the reports imported in the workspace.
Here are the steps for setting up the sample web app:
- In the Power BI Embedded Visual Studio solution, select the web application EmbedSample, followed by Set as StartUp project.
- Open the web.config file associated with the EmbedSample web application, then edit the appSettings section to supply values for the AccessKey, WorkspaceCollection, and WorkspaceId keys.
Code Listing 7 web.config
<appSettings> <add key="powerbi:AccessKey" value="" /> <add key="powerbi:ApiUrl" value="https://api.powerbi.com" /> <add key="powerbi:WorkspaceCollection" value="" /> <add key="powerbi:WorkspaceId" value="" /> </appSettings> |
- Run the web application Embed Sample.
- When the Embed Sample web application has been run, the navigation panel on the left displays the reports. Extend the reports to display the imported reports and select Reports. If you imported the sample “Retail Analysis Sample PBIX,” you will have something like the following image from Figure 192.

Figure 192: Power BI Embedded Sample Web Application
After selecting a report, the web application Embed Sample will look like Figure 193.

Figure 193: Power BI Embedded Sample Web Application
Explore the sample code
The sample Microsoft Power BI Embedded is an example of a dashboard web app that displays how to integrate the Power BI reports into an application. It uses a Model-View-Control (MVC) design pattern.
The sample code is separated into sections that include the filename of the PowerBI-embedded.sln solution so that the code can be easily found in the sample.
Model
The sample is composed of ReportsViewModel and ReportViewModel.
ReportsViewModel.cs in Code Listing 8 represents the Power BI reports.
Code Listing 8 ReportsViewModel.cs
public class ReportsViewModel { public List<Report> Reports { get; set; } } |
ReportViewModel.cs in Code Listing 9 represents a single Power BI report.
Code Listing 9 classReportViewModel.cs
public class classReportViewModel { public IReport Report { get; set; } public string AccessToken { get; set; } } |
Connection string
The connection string must be composed as shown in Code Listing 10.
Code Listing 10 Connection String
Data Source=tcp:MyServer.database.windows.net,1433;Initial Catalog=MyDatabase |
Using the common server and database attributes will bring a negative result. For instance, see Code Listing 11.
Code Listing 11 Connection String
Server=tcp:MyServer.database.windows.net,1433;Database=MyDatabase |
View
The view displays and manages both reports and report.
Reports.cshtml interacts with Model.Reports to create an ActionLink. The ActionLink is composed of:
Title (the name of the report) and the QueryString (a link to the Report ID).
Code Listing 12 Reports.cshtml
<div id="reports-nav" class="panel-collapse collapse"> <div class="panel-body"> <ul class="nav navbar-nav"> @foreach (var report in Model.Reports) { var reportClass = Request.QueryString["reportId"] == report.Id ? "active" : ""; <li class="@reportClass"> @Html.ActionLink(report.Name, "Report", new { reportId = report.Id }) </li> } </ul> </div> </div> |
The Report.cshtml sets up the Model.AccessToken and the Lambda expression for the PowerBIReportFor.
Code Listing 13 Reports.cshtml
@model ReportViewModel … <div class="side-body padding-top"> @Html.PowerBIAccessToken(Model.AccessToken) @Html.PowerBIReportFor(m => m.Report, new { style = "height:85vh" }) </div> |
Controller
DashboardController.cs creates a PowerBIClient and passes to it the app token. A JSON Web Token (JWT) is generated from the Signing Key of the credentials. The credentials are used to create an application request for PowerBIClient. Once the PowerBIClient has been instantiated, GetReports() and GetReportsAsync() can be called.
Code Listing 14 DashboardController.cs
CreatePowerBIClient() private IPowerBIClient CreatePowerBIClient() { var credentials = new TokenCredentials(accessKey, "AppKey"); var client = new PowerBIClient(credentials) { BaseUri = new Uri(apiUrl) }; return client; } ActionResult Reports() public ActionResult Reports() { using (var client = this.CreatePowerBIClient()) { var reportsResponse = client.Reports.GetReports(this.workspaceCollection, this.workspaceId); var viewModel = new ReportsViewModel { Reports = reportsResponse.Value.ToList() }; return PartialView(viewModel); } } Task Report(string reportId) public async Task<ActionResult> Report(string reportId) { using (var client = this.CreatePowerBIClient()) { var reportsResponse = await client.Reports.GetReportsAsync(this.workspaceCollection, this.workspaceId); var report = reportsResponse.Value.FirstOrDefault(r => r.Id == reportId); var embedToken = PowerBIToken.CreateReportEmbedToken(this.workspaceCollection, this.workspaceId, report.Id); var viewModel = new ReportViewModel { Report = report, AccessToken = embedToken.Generate(this.accessKey) }; return View(viewModel); } } |
Integrate a report into your app
When you have a report available, you can use an iframe to encapsulate the Power BI Report.
Figure 194 shows a snippet of powerbi.js present in the example of Power BI Embedded.

Figure 194: Power BI Embedded—init function
Filter reports embedded in your application
We can filter encapsulated reports by using the URL syntax.
In order to do so, we have to add a $filter to the interrogation parameters with a URL-escaped eq operator for the iframe src url with the specific filter. Code Listing 15 shows a query syntax.
Code Listing 15 Query Syntax URL
https://app.powerbi.com/reportEmbed?reportId=d2a0ea38-...-9673-ee9655d54a4a&$filter=tableName/fieldName}%20eq%20'{fieldValue}' |
- 1800+ high-performance UI components.
- Includes popular controls such as Grid, Chart, Scheduler, and more.
- 24x5 unlimited support by developers.