
Power BI Succinctly®

CHAPTER 6
Developer
Power BI is not a closed environment—we can customize it as well as embed it in applications.
Developers can use two modes to extend and personalize Power BI:
- Power BI REST API
- Custom visual, which allows us to develop visuals, and in the visual gallery we can see all the visuals developed by other people. We can also develop a new one of our own and decide whether or not to share it with other users (by publishing it to the gallery).
It is possible to embed Power BI in other applications/documents by using Power BI Tile in Office documents.
Power BI REST API
We can connect through the API Power BI to push the Power BI data via direct programming. The reference site for Power BI developers is dev.powerbi.com, where you can find examples and documentation about the continuously updated APIs. You can start by clicking the entry Try the API and working through the interactive operating system.
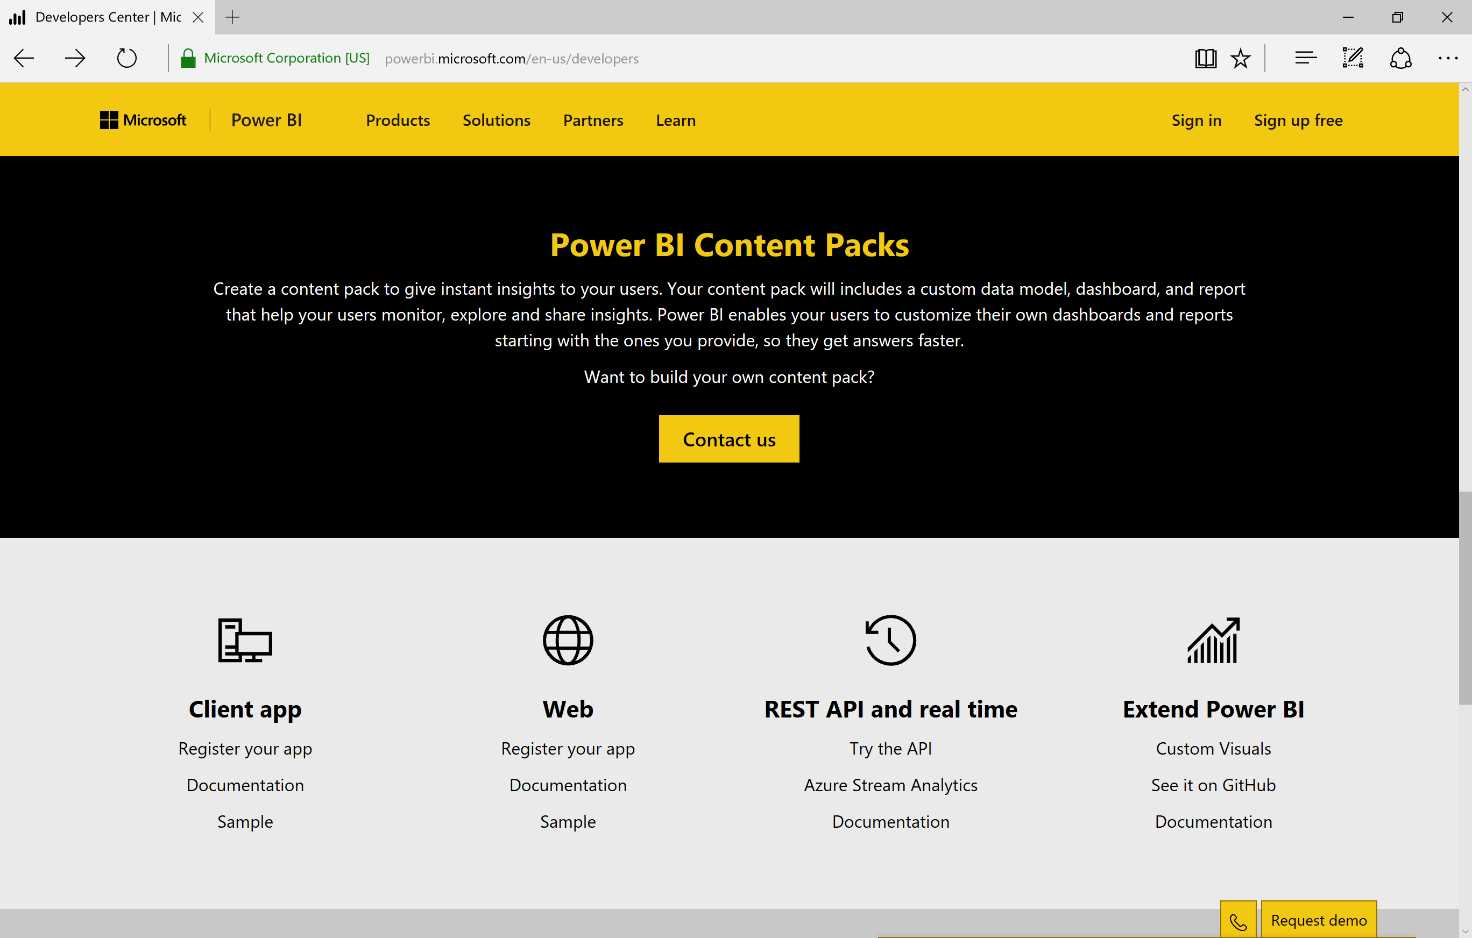
Figure 154: Power BI Developer Site
Try it by going to the console, carrying out calls to the services, and looking at what happens.
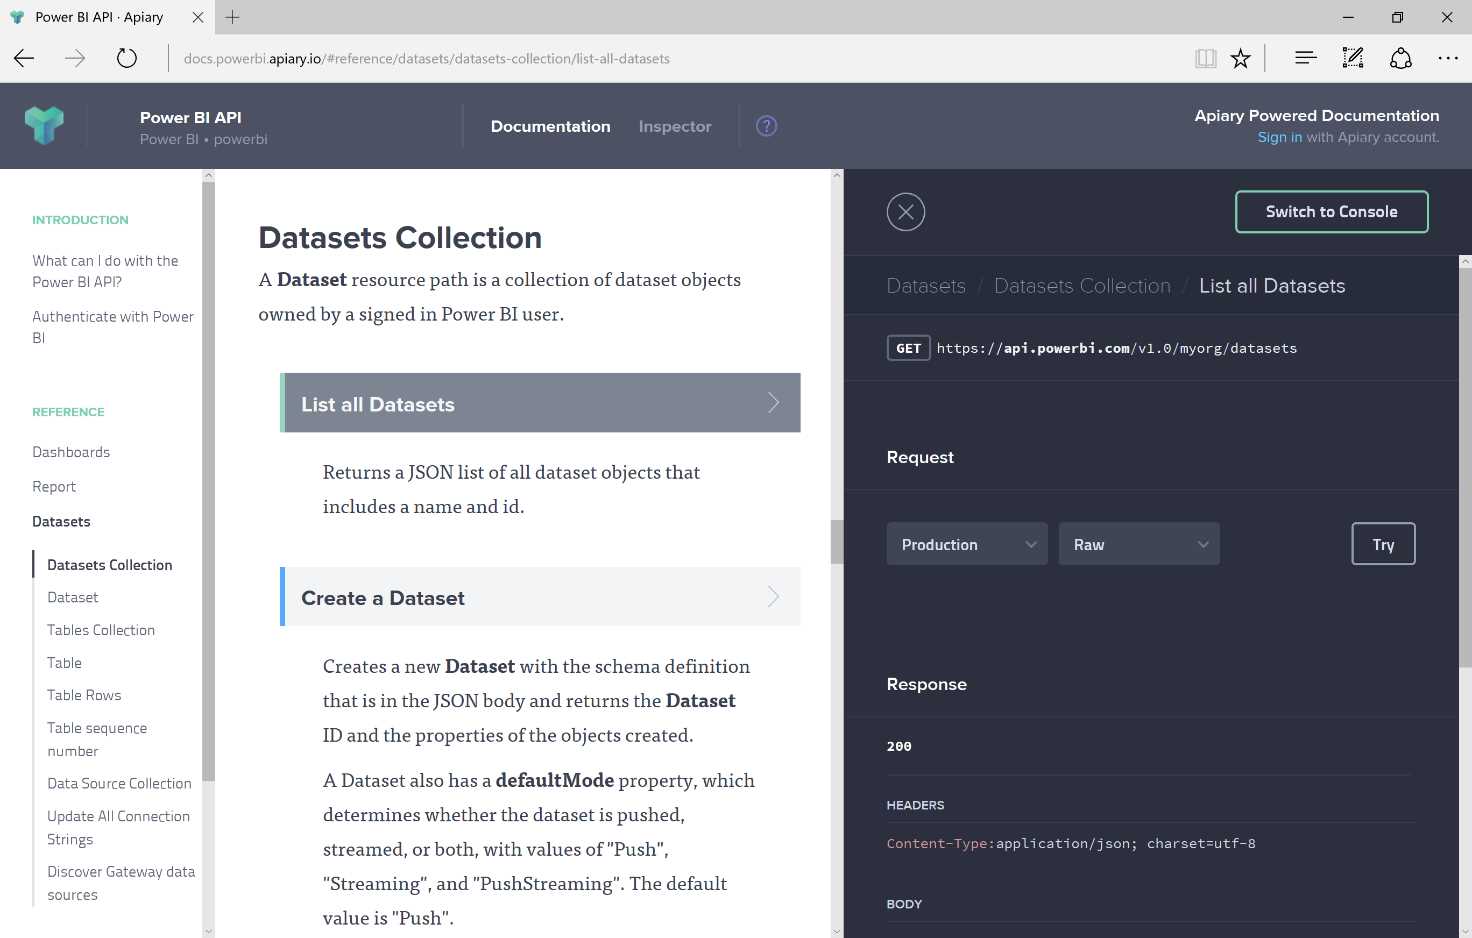
Figure 155: Power BI Console Portal
On the left side of the screen, you’ll find references to the connections to the various APIs, and under the datasets you will find the calls to the APIs that can be evoked.
Our first action is to use our API to query a dataset currently saved in Power BI. By selecting Datasets and Datasets Collection, we’ll find several APIs that can be called. Next, we’ll obtain a list of all the datasets. On the right side of the screen, you’ll see the web service that can be evoked, the URL you want to call, the details of the request type (necessary for the request transmission), and the format you will obtain from the call return. By clicking Try, the request gets carried out, but remember that you must authenticate and authorize Power BI.

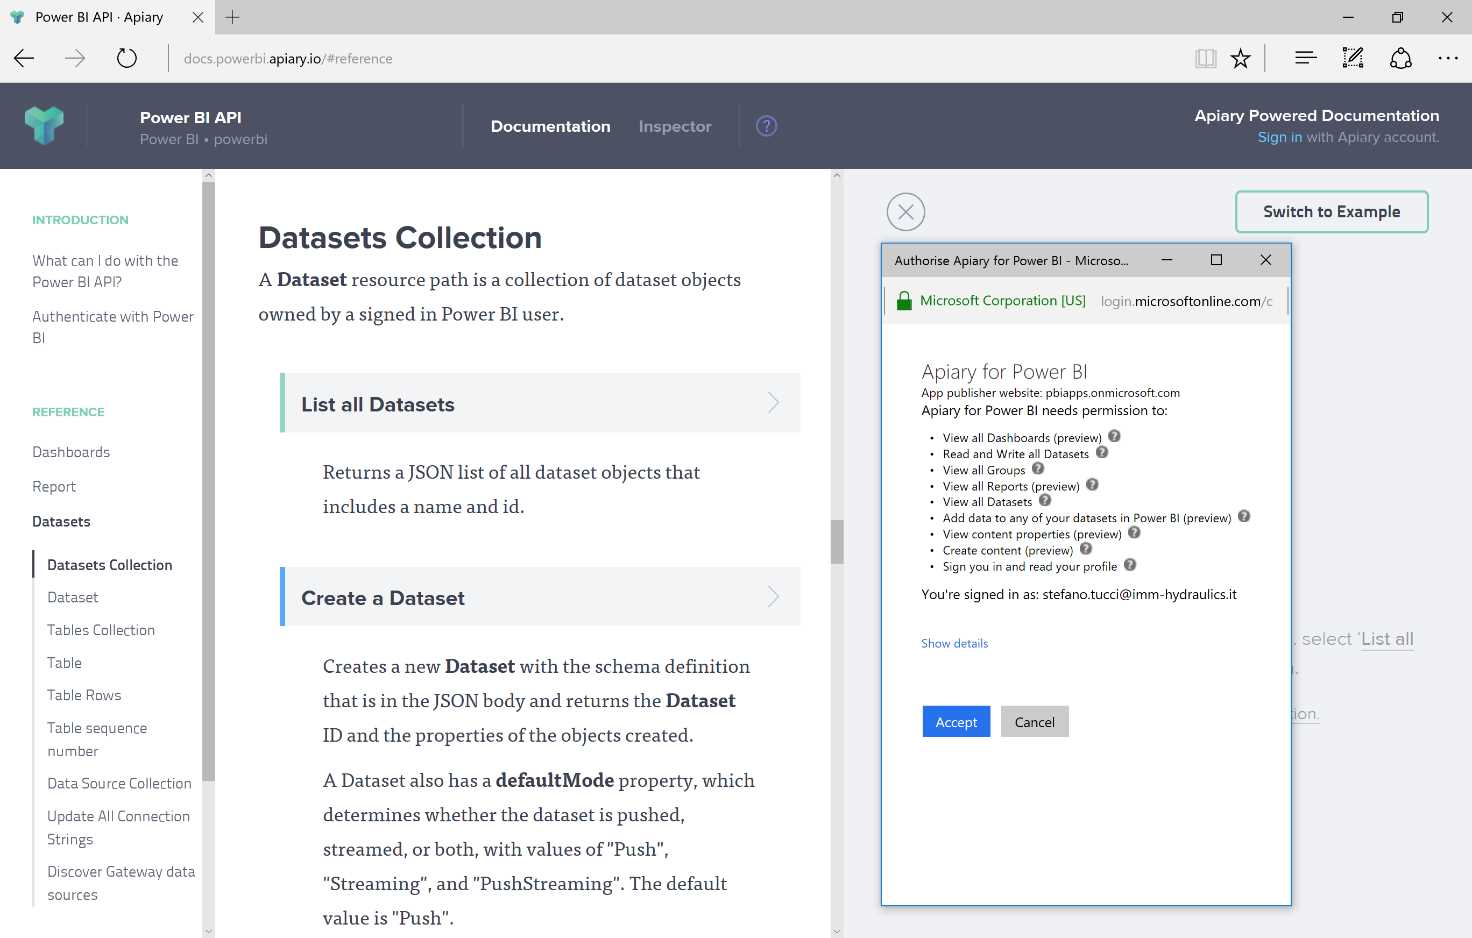
Figure 156: Power BI Console Portal, Authentication—sequence
At this point, choose your account and accept the conditions.
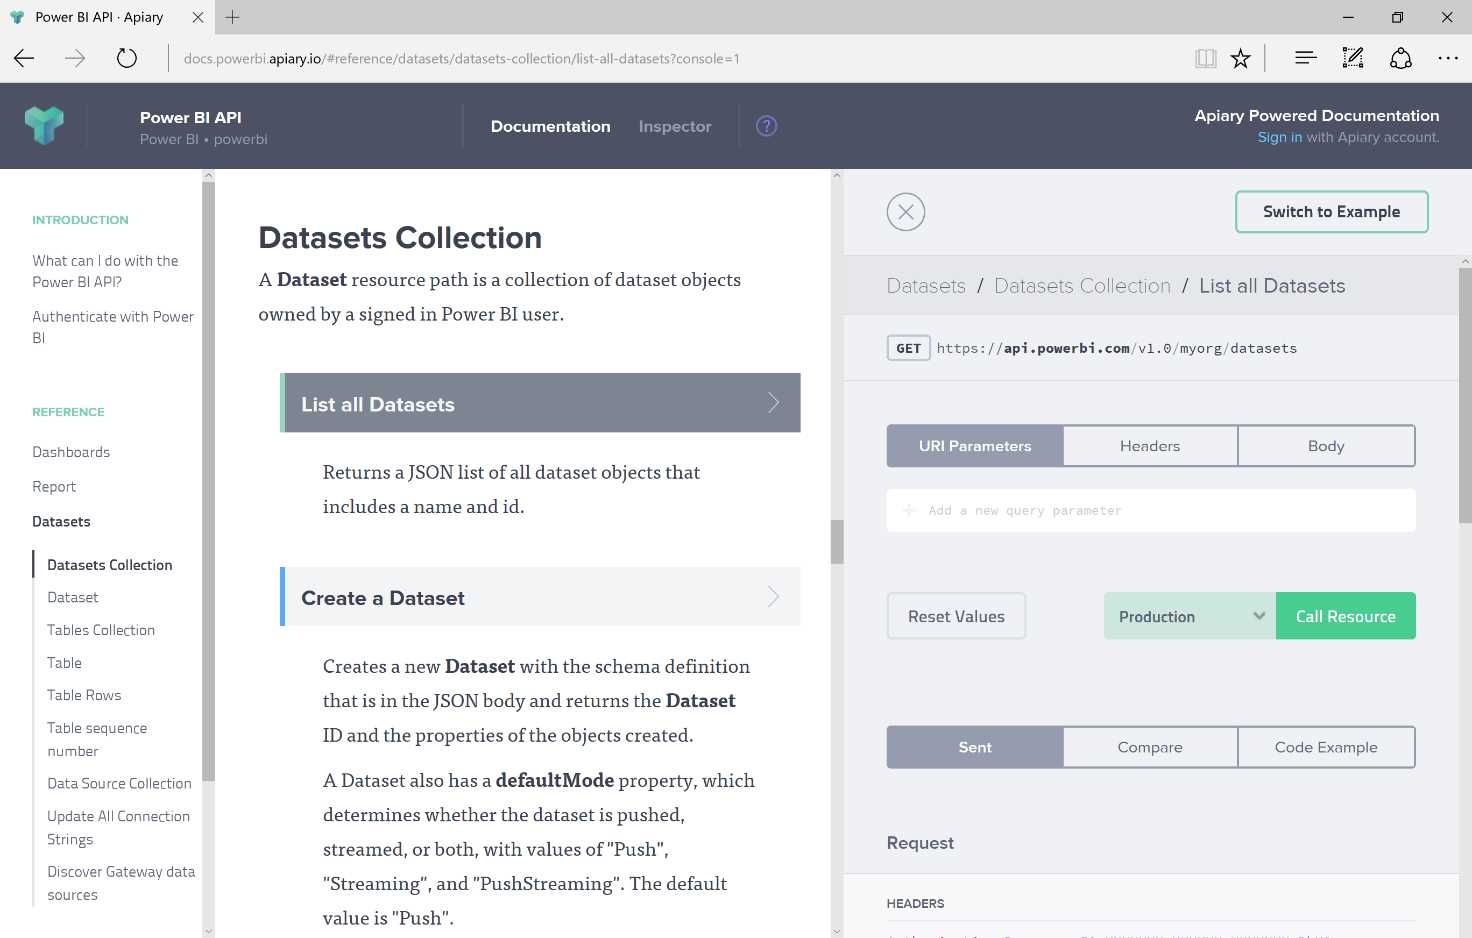
Figure 157: Power BI Console Portal—datasets collection
By clicking on the entry Call Resource, we allow the API to call the desired resource. So this first call simply lists the data sets available.

Figure 158: Power BI Console Portal—datasets collection
The result of the call will be displayed in the underlying section. On the left side of the screen, you’ll see the possible calls you can carry out, while on the right side you’ll see the interactive console used to evoke the calls. The answer to the call is quick, typically returned in less than one second.
Next, we go back to the data collection to create a dataset through the dedicated API. From the left side, we click on the entry Create a Dataset. The console changes the information. We can compose a new dataset from the Body section.
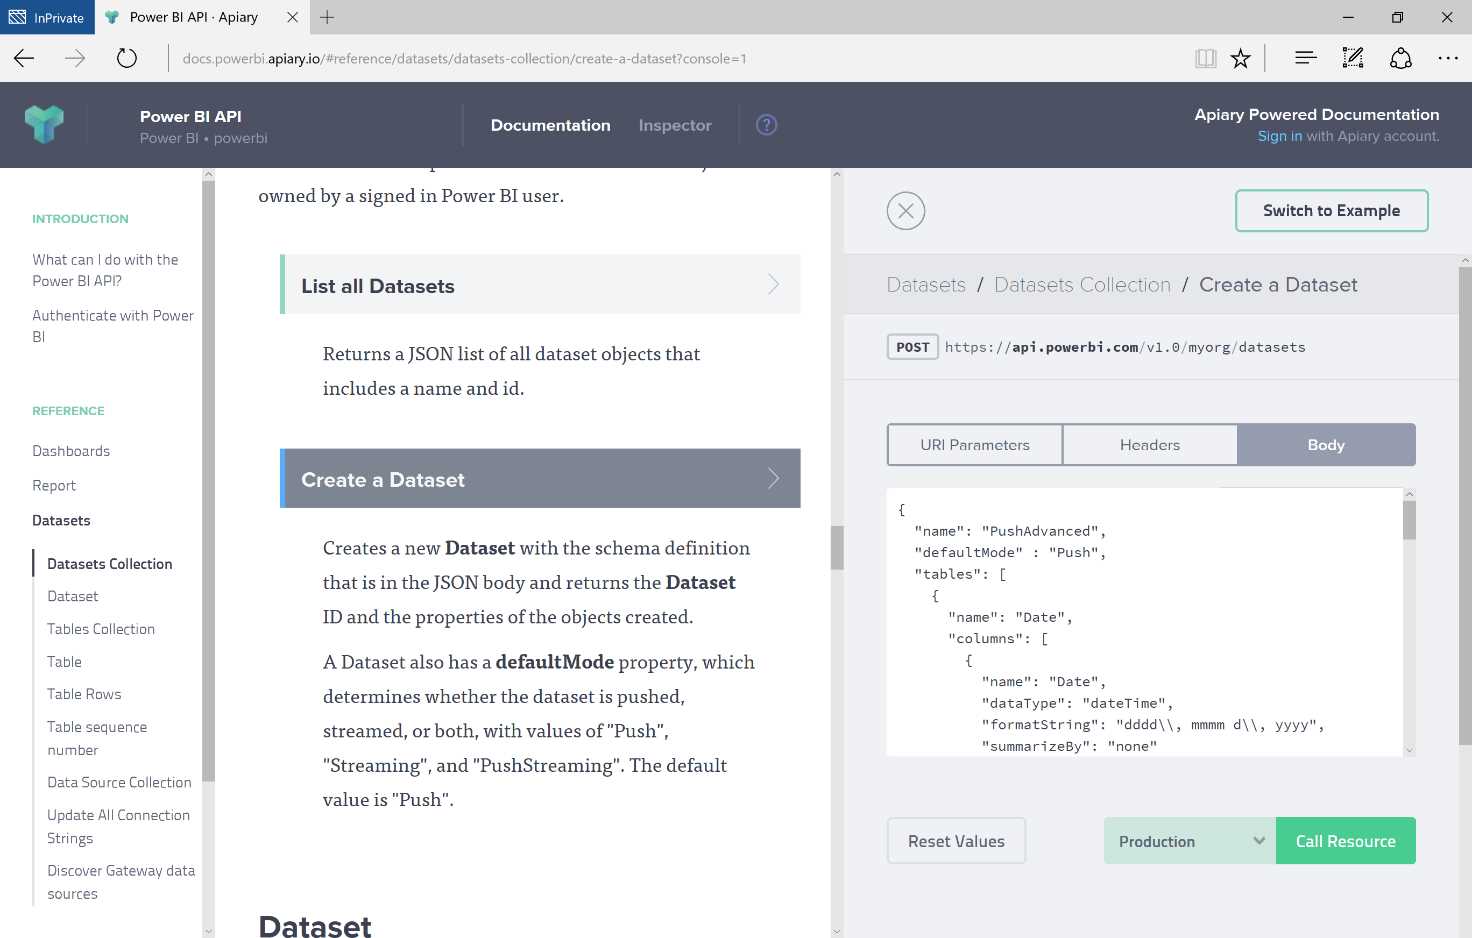
Figure 159: Power BI Console Portal—Create a Dataset
The entry Call Resource will carry out the request. Go back to Power BI and you will see the newly created dataset.
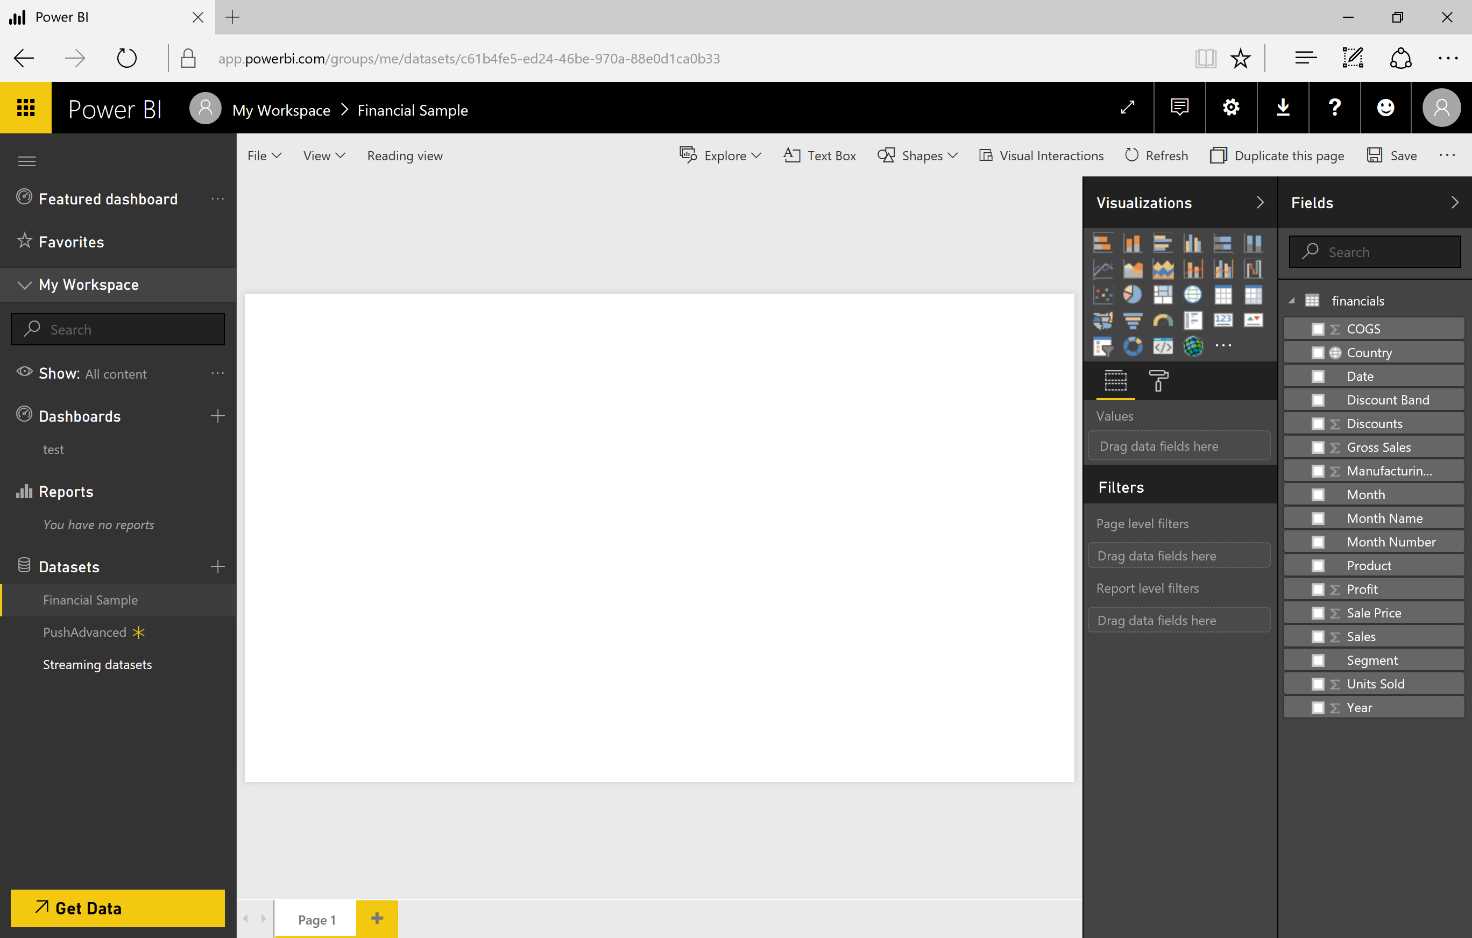
Figure 160: Power BI Service—datasets update
Now you’ll notice the presence of the new dataset and you can start using it, but note the data is not present. Only the structure of the data has been defined.

Figure 161: Power BI Service Report
Before populating the data, we should save the report and the dashboard.

Figure 162: Power BI Service Report
Go back to the console to insert data and select the entry Add Rows to a Table in a Dataset. In the parameters, in the section “URI Parameter,” specify the ID of the dataset and the name of the table to be populated (in our case, “sales”).
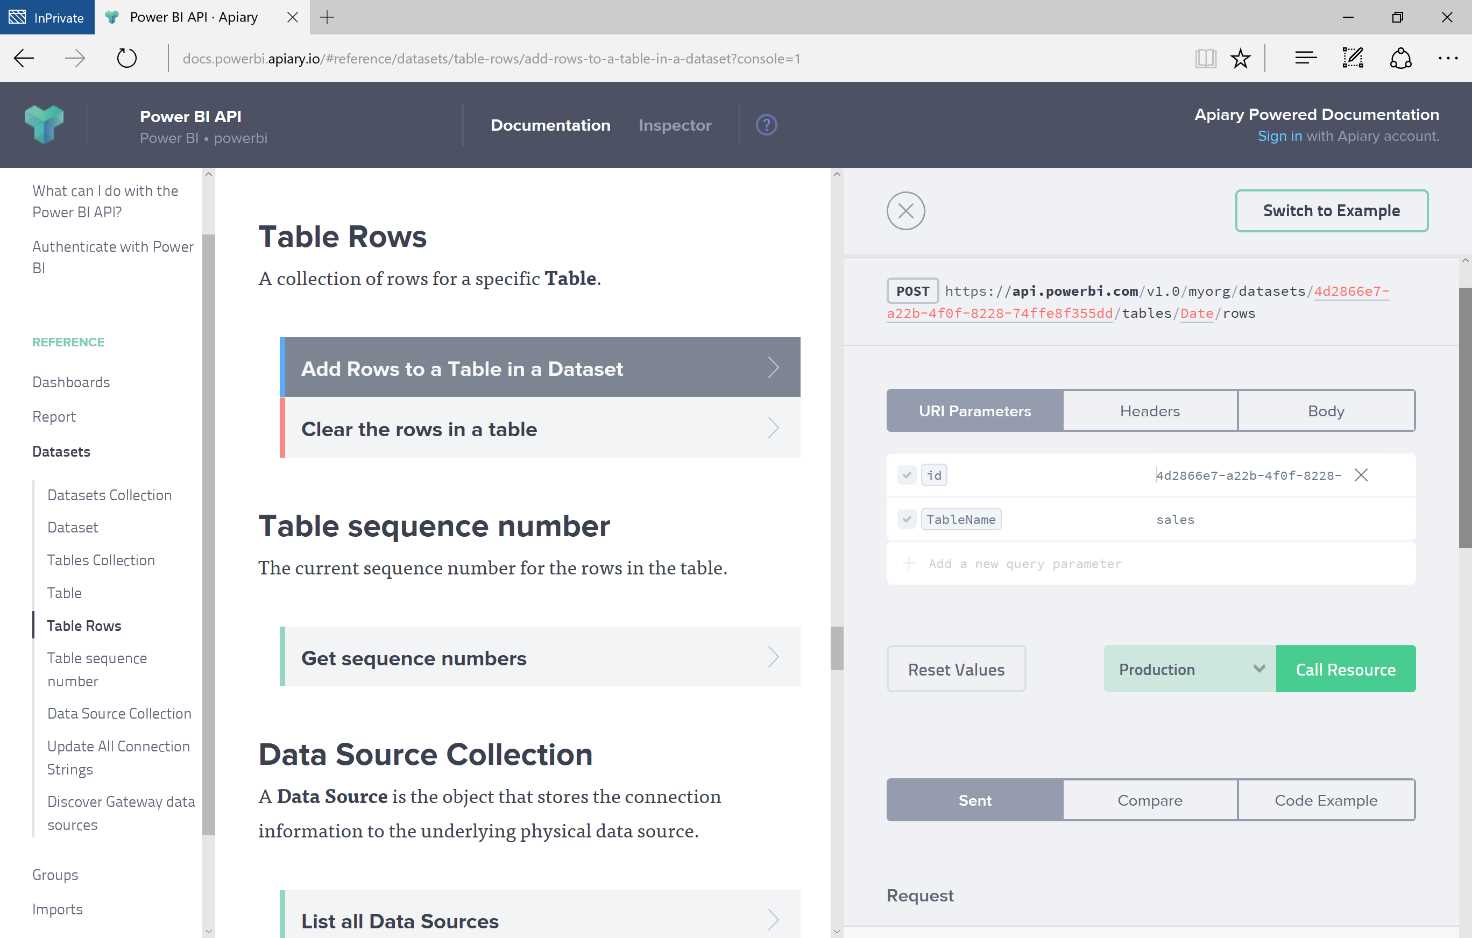
Figure 163: Power BI Console Portal—Table Rows, Add Rows
In the Body section, specify the data you want to insert, as shown in the example in Figure 164, and click Call Resource:

Figure 164: Power BI Console Portal—Table Rows, Add Rows
From this moment forward, the data will be persistent in our dashboard. You can keep that as is, or you can change the content. If so, you will notice the changes in the dashboard.
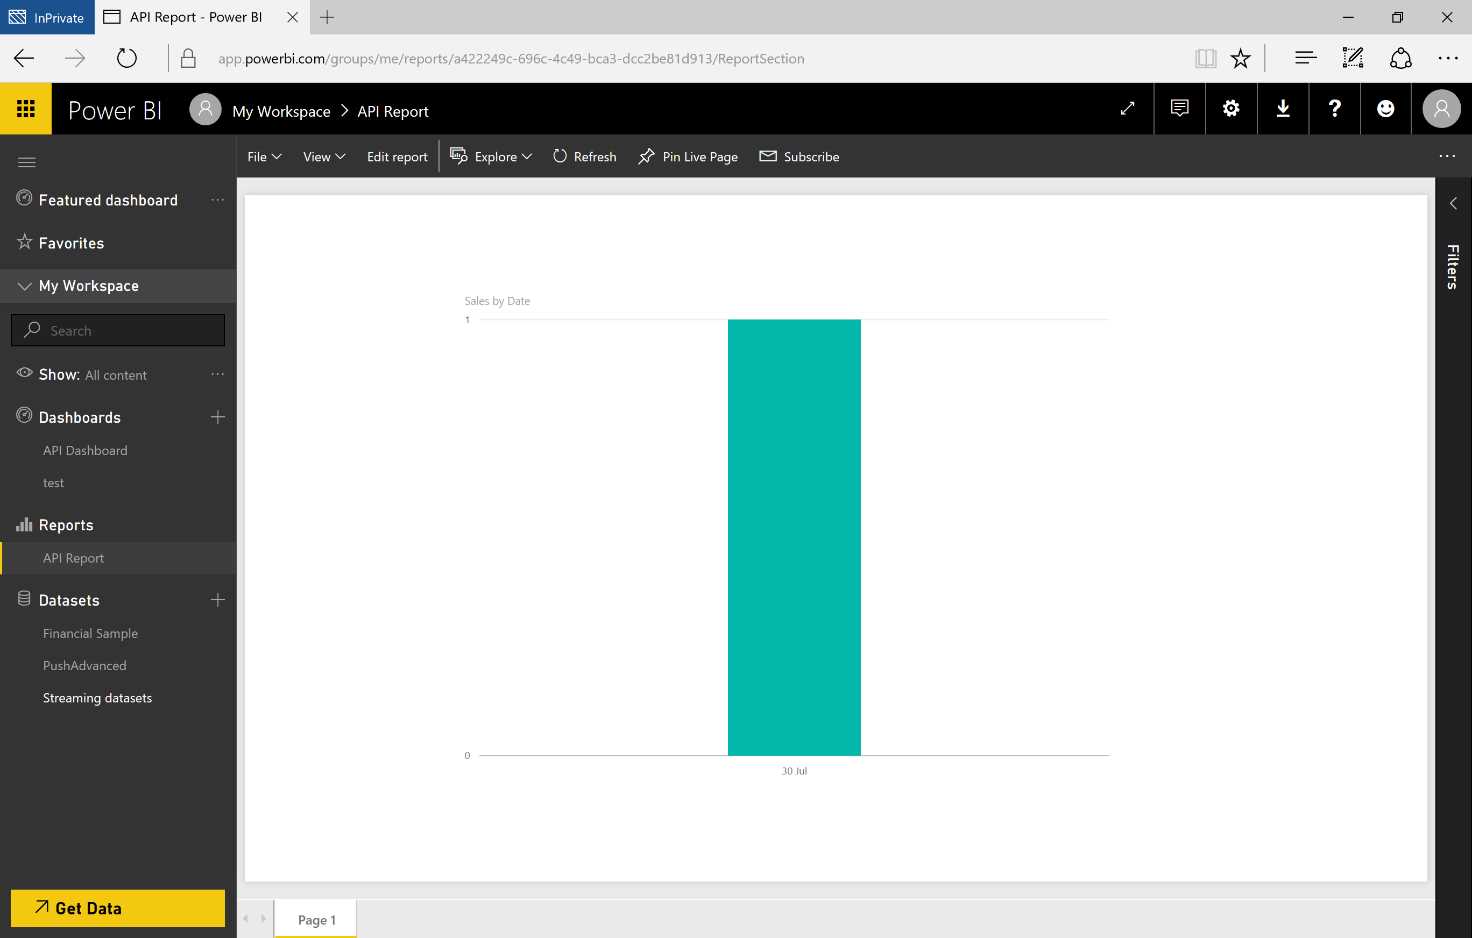
Figure 165: Power BI Service—report update
The same API functions can be invoked from our applications to create a dashboard that displays data in real time.
Power BI custom visual
Developers can easily create customized visual elements in Power BI for use in their own dashboards and reports. For starters, a code for all the graphic effects on GitHub is available. There are points of reference for visualization along with a test suite and tools for helping create high-quality, customized visual elements for Power BI. All this is available as an open-source project on GitHub at https://github.com/Microsoft/PowerBI-Visuals.
To create a visual object, you first need to set up the development environment. Then you need to install the NodeJS 4.0+ Required (5.0 recommended). Next, use the code in Code Listing 1.
Code Listing 1: NodeJS Command
npm install -g powerbi-visuals-tools |
To confirm that the installation is the successful, you can execute the command in Code Listing 2.
Code Listing 2: NodeJS Command
pbiviz |
You will obtain the following result, shown in Figure 166.
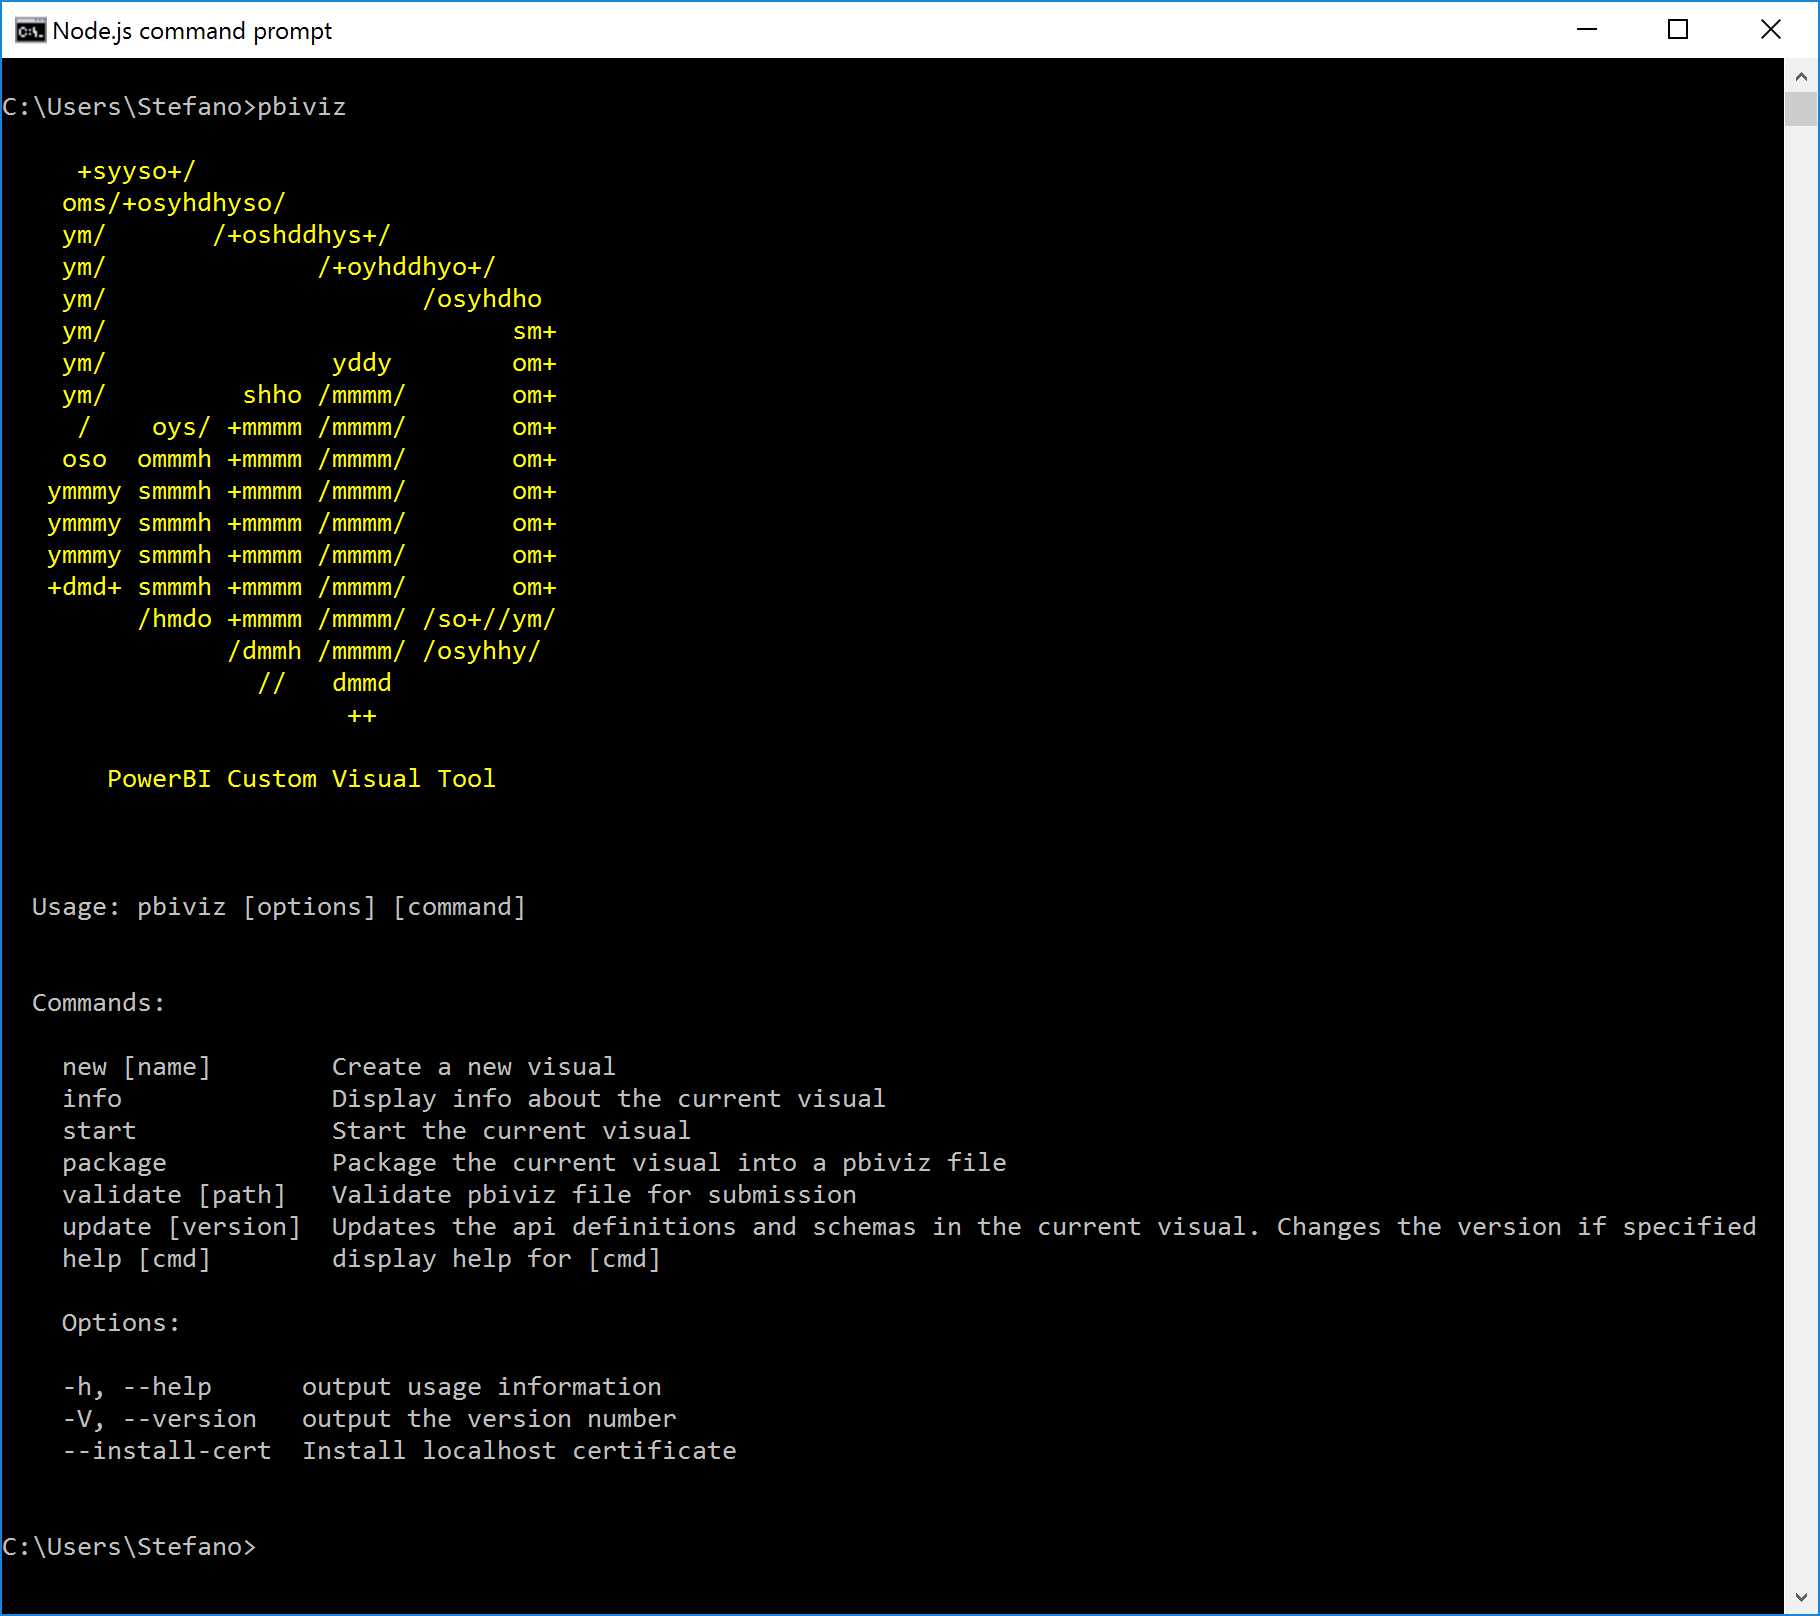
Figure 166: Pbiviz Command Execution
In order to enable the live preview of the visual objects, we must install an SSL certificate used in HTTPS. This will allow the display and the uploading of objects via the browser, and it will work for users of Windows or OSX.
Code Listing 3: NodeJS Command
pbiviz --install-cert |
In the procedure for Windows users, the following window, as in Figure 167, will appear:
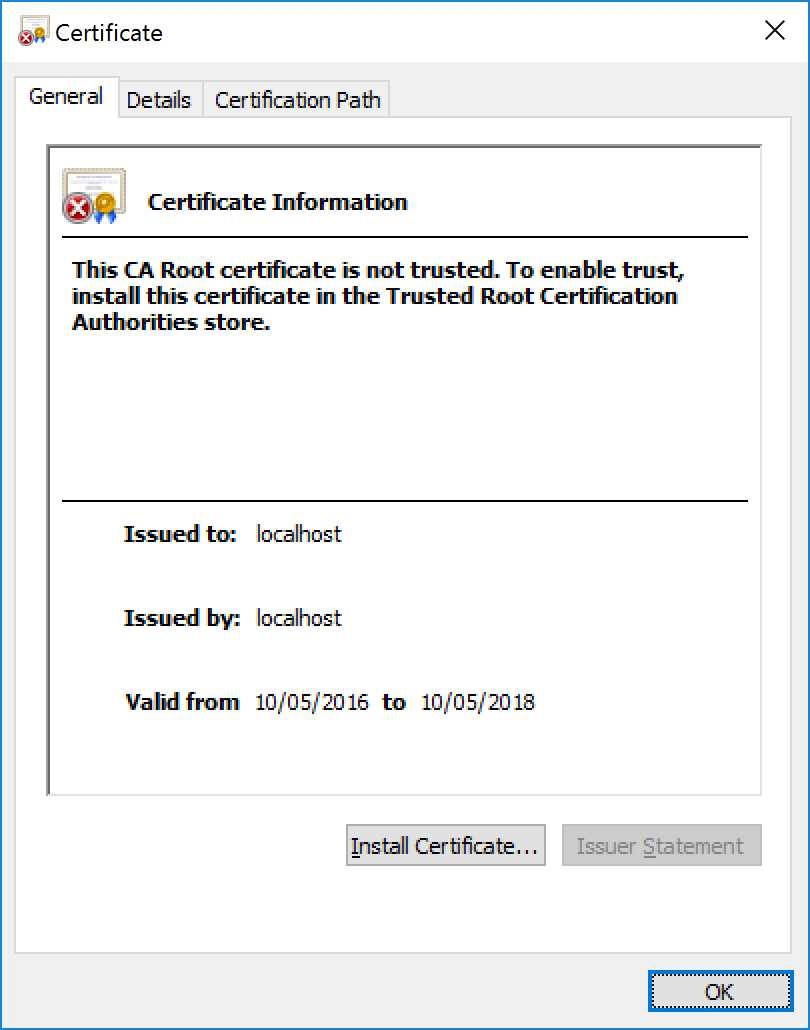
Figure 167: Certificate Information
Next, click Install Certificate, also as shown in Figure 167.
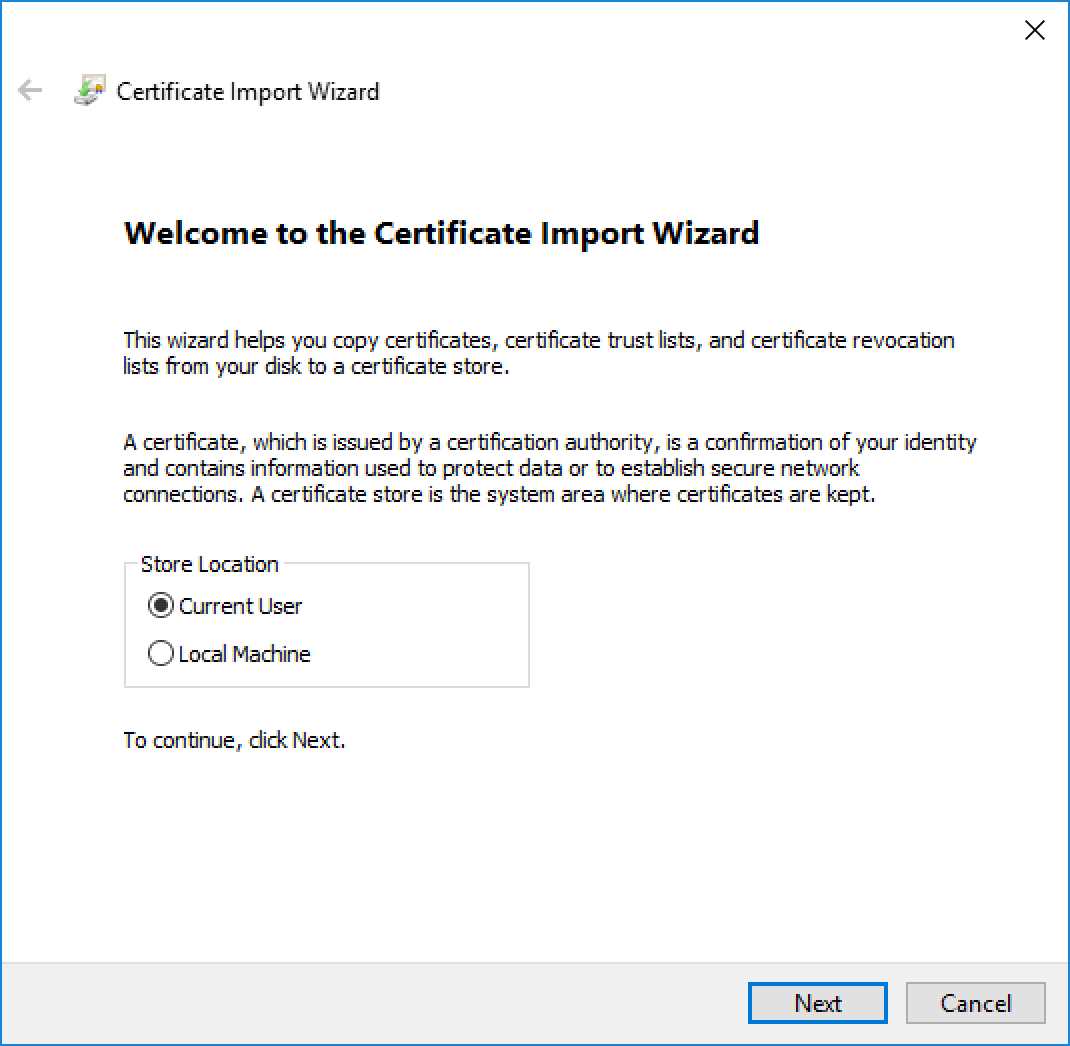
Figure 168: Certificate Import Wizard
Now we select Current User and click Next.

Figure 169: Certificate Import Wizard
Next, we select Place all certificates in the following store and click Browse... next to that line.

Figure 170: Certificate Import Wizard
Figure 170 shows the next steps—we select Trusted Root Certification Authorities and click OK. Then we go back to the previous screen, where we select Next.

Figure 171: Certificate Import Wizard
We complete the installation by clicking Finish.
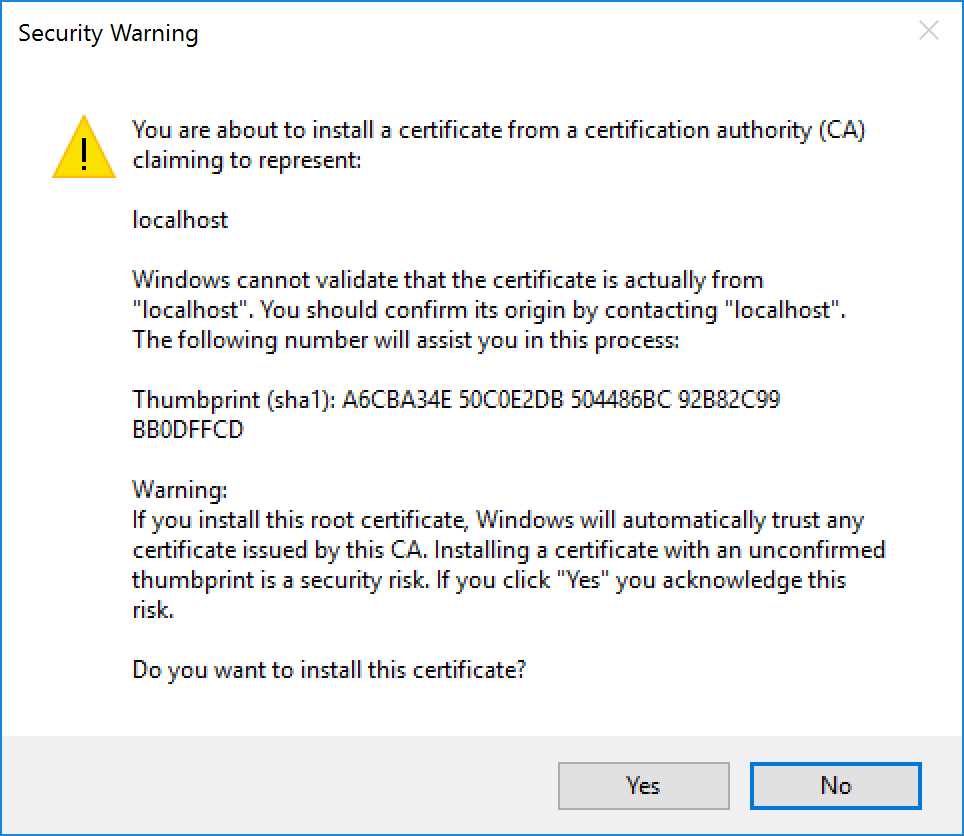
Figure 172: Security Warning
And now we verify the installation by selecting Yes.
In the procedure for Mac OS X users, the window in Figure 173 will appear.
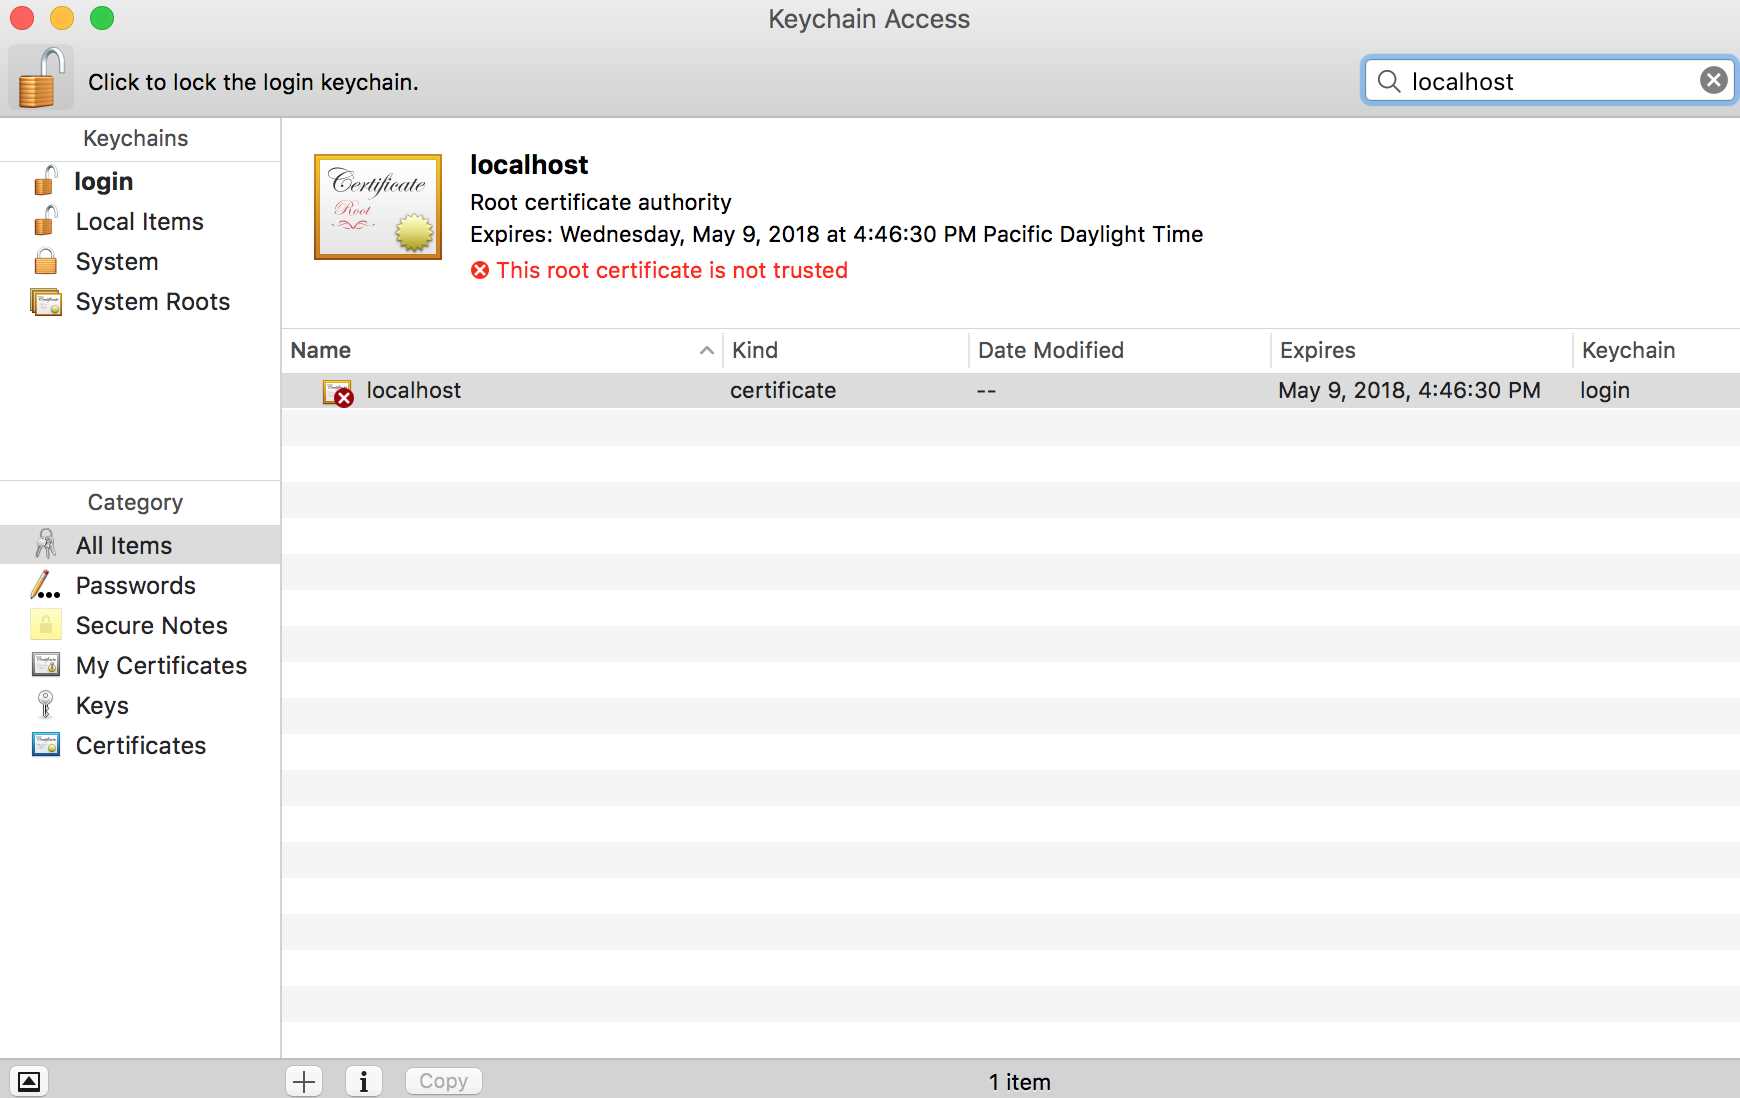
Figure 173: MAC Keychain Access
If the lock on the screen is indeed locked, click it to unlock.
Next, enter "localhost" in the search box.
Now select the new certificate.
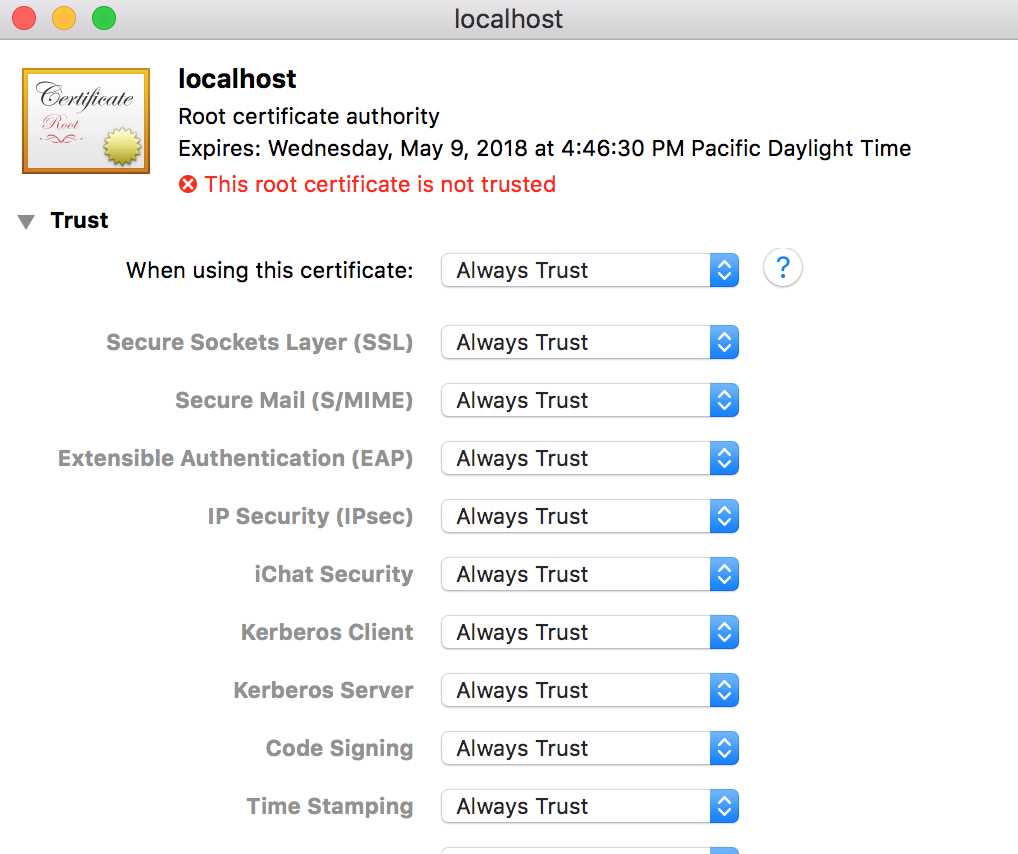
Figure 174: MAC Root Certificate Authority
Note that here we must select Always Trust.
Next, we close the window.
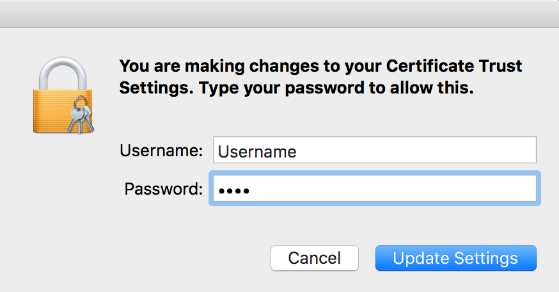
Figure 175: Credential Request
Figure 175 shows the next interface, in which we enter our username and password, then click Update Settings.
At this point, we have completed the installation.
When creating our first visual, we follow the prompt of the Node.js controls, as in Code Listing 4.
Code Listing 4: NodeJS Command
pbiviz new Name of visual |
Rename “Name of visual” with a name that suits your needs. When the visual has been generated, you can change the name in the file pbiviz.json.
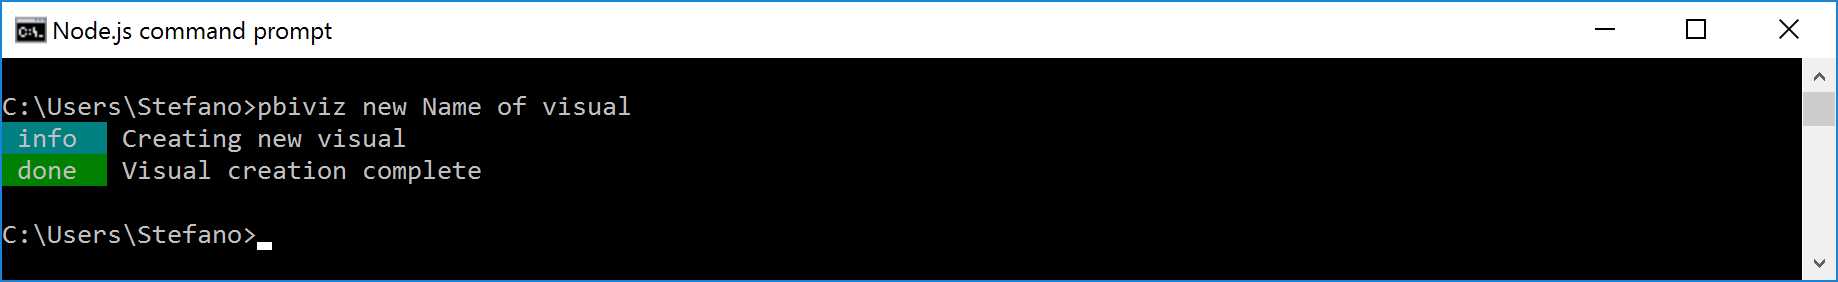
Figure 176: Pbiviz Create New Visual
Next, enter the newly created folder and execute the command in Code Listing 5.
Code Listing 5: NodeJS Command
pbiviz start |
You will obtain the following result, as shown in Figure 177.
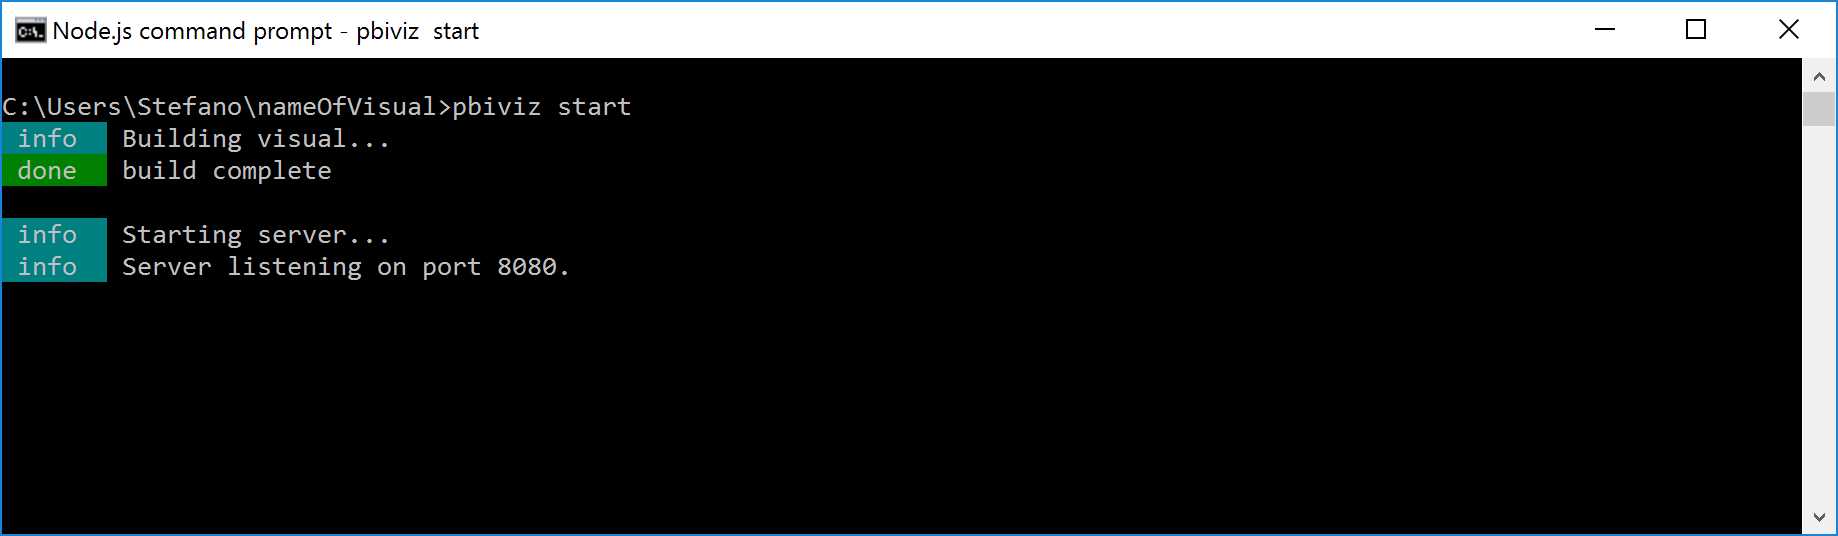
Figure 177: Pbiviz Execution
The following step enables the mode developer visual for testing—from the PowerBI service, we go to Settings.
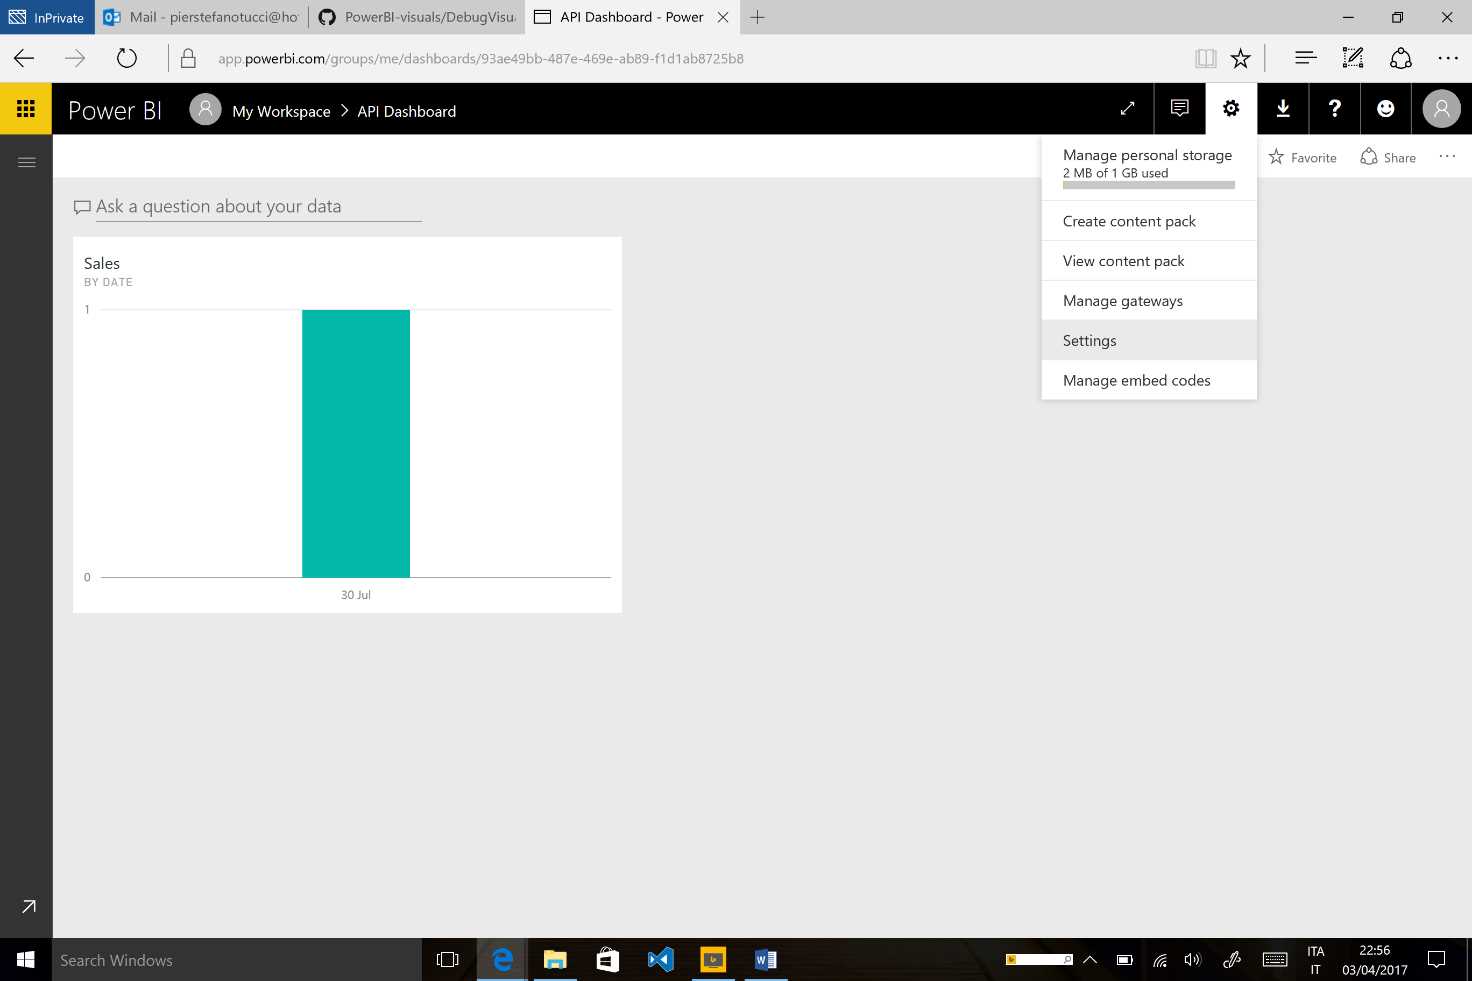
Figure 178: Power BI Service Settings
Next, click the entry Developer.
Now we select Enable developer visual for testing.

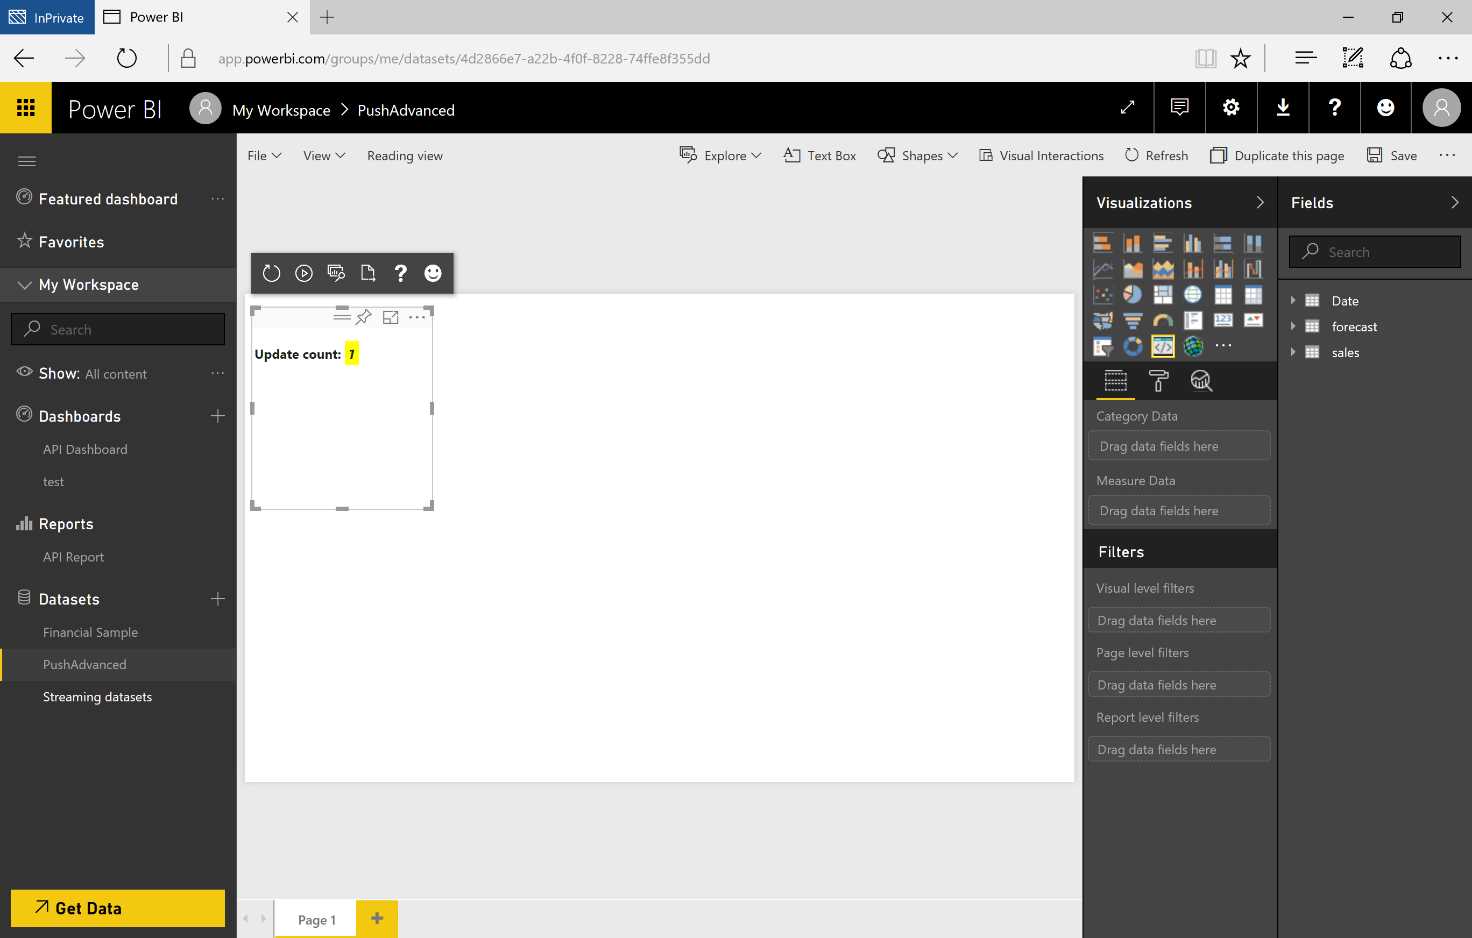
Figure 179: Power BI Service—report and new visual—sequence
From left to right, you’ll see the following Toolbar icons:
- Refresh Visual—you can manually select the visual if the autoreload is off.
- Toggle Autoreload—when the visual is on, it will be updated automatically every time the file is saved.
- Show Dataviews—shows the visual’s underlying dataview for debugging.
- Get Help—links to the documentation.
- Send Feedback—for sharing experiences.
In order to create the distribution packet, follow the Node.js prompt to the folder containing the visual and execute the command in Code Listing 6.
Code Listing 6: NodeJS Command
pbiviz package |
You will obtain the result shown in Figure 180.
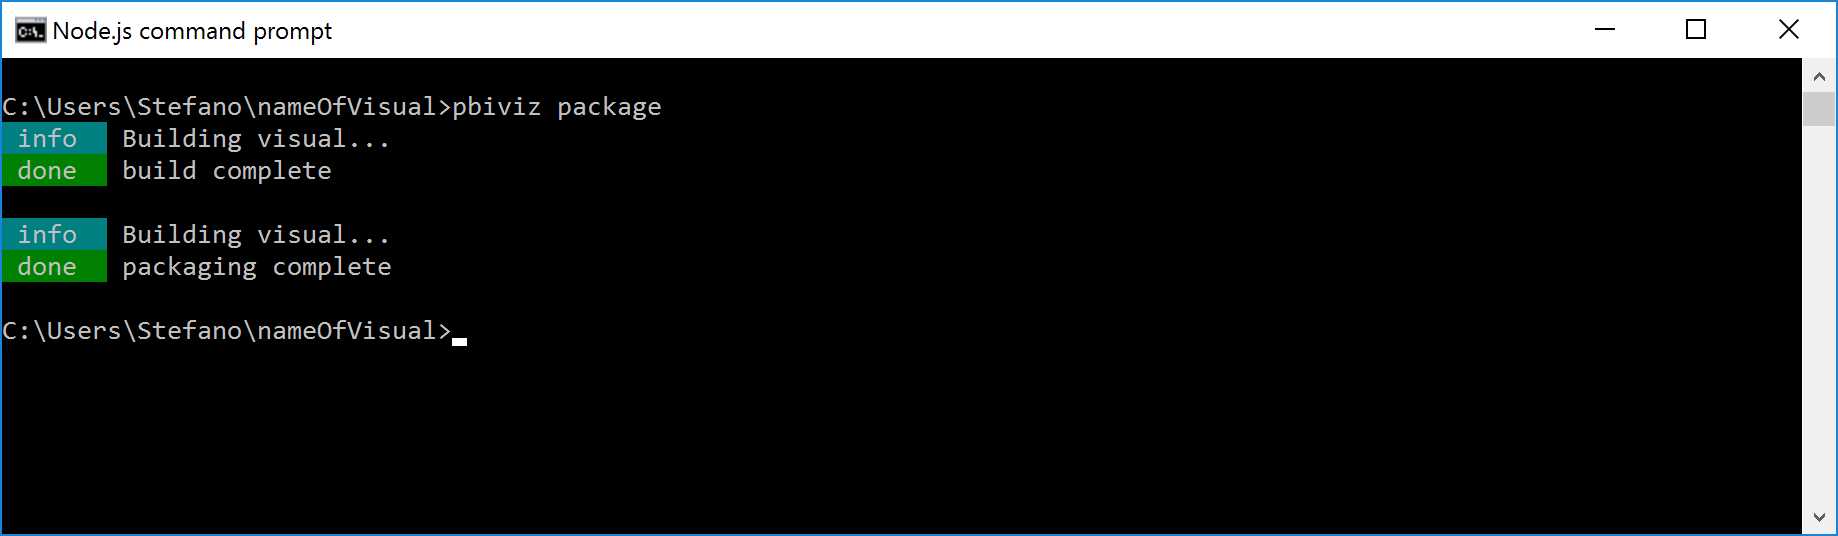
Figure 180: Pbiviz Create New Package
By navigating to the subfolder “dist,” you will notice the .pbiviz file, useful for importing as a custom visual within the visualization objects.
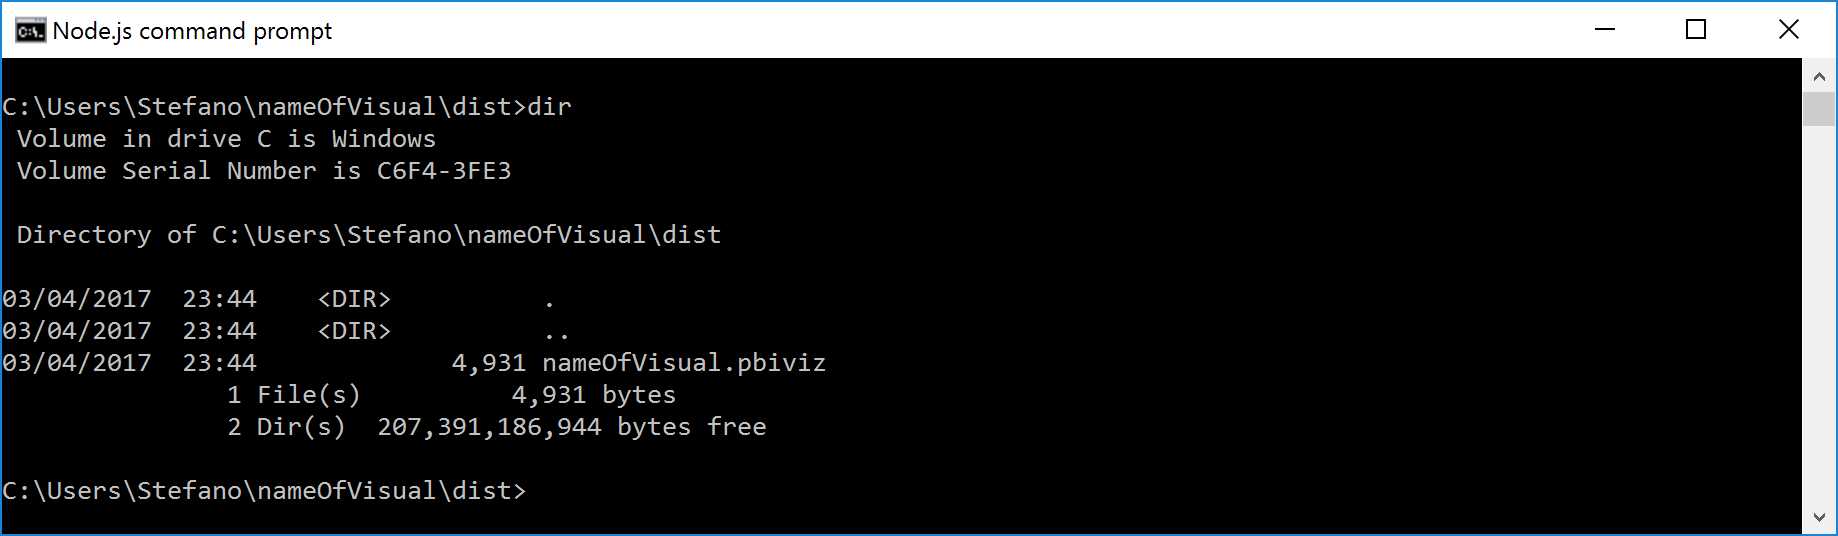
Figure 181: Package Path
- 1800+ high-performance UI components.
- Includes popular controls such as Grid, Chart, Scheduler, and more.
- 24x5 unlimited support by developers.