
Leaflet.js Succinctly®

CHAPTER 2
Working with Base Layers
Leaflet.js distinguishes between two basic types of map layers: base layers and overlays. The tile layer we added to our map in the previous chapter is an example of a base layer.
Base layers are maps, typically sourced from external providers like OpenStreetMap or MapBox, that often contain rich and complex cartography and serve to set the geographical context for the other data you add to the map. That “other data” is usually an overlay. There is only ever one base map layer visible at any one time, but you can have multiple overlays “draped” over the base layer.
To understand the difference between the two types of layers, you need to think about the ways in which a computer deals with graphics. The two basic data structures for storing and manipulating graphical data on a computer are rasters and vectors. So far we have seen how to create a map control and add a single tile layer to use as a base map layer. A tile layer is an example of a raster layer. Rasters are comprised of individual pixels and are what we typically refer to as an “image.”
Overlays are typically vectors. Vectors are made up of information that describes points and lines that are geometrically and mathematically related to one another. They don’t really become images until something draws them.
We’ll talk about vectors when we cover overlays in Chapter 3. For now, let’s have a look at some of the different types of base layers, starting with the L.TileLayer we saw in the previous chapter.
Basic tile layers (TileLayer)
These layers consist of image tiles that are requested by your application when a user focuses on a particular extent of the map. At large scales (user zoomed in to a small geographic area), there are a large number of tiles, because there is more detail to display per square mile. At smaller scales (user zoomed out to a wide geographic area), there are fewer tiles, because there is less detail to display per square mile. Leaflet.js and the tile layer provider calculate which tiles need to be shown for a particular extent based on the URL you specify in the TileLayer constructor, which contains the {x}, {y}, and {z} placeholders. These placeholders correspond to the tile coordinates and zoom level that the tile service uses to locate a specific tile. Some providers also accept a {s} placeholder, which can be used to switch between subdomains, and therefore download tiles in parallel for better performance.
What follows is a roundup of some of the more popular tile providers, together with the URL you must use in the TileLayer constructor. Some providers will have usage policies to constrain bandwidth. Just about all of them will require some sort of attribution, which you can set with the attribution property. This property accepts just about any valid HTML, so you can hyperlink back to the tile provider’s website if you wish. See the providers’ individual websites for specific attribution details.
OpenStreetMap
OpenStreetMap is an amazing resource, consisting of crowd-sourced mapping for much of the world’s surface.
OSM Mapnik
OSM Mapnik is the standard way of viewing OpenStreetMap data, which we used in Chapter 1.
URL template: http://{s}.tile.openstreetmap.org/{z}/{x}/{y}.png
Example:
Code Listing 8: OSM Mapnik tile layer
... // OSM Mapnik var osmLink = "<ahref='http://www.openstreetmap.org'>OpenStreetMap</a>"; L.tileLayer( 'http://{s}.tile.openstreetmap.org/{z}/{x}/{y}.png', { attribution: '© ' + osmLink, maxZoom: 18, }).addTo(map); ... |
OSM Black and White
This is a black and white/grayscale version of OSM Mapnik, and it’s great if you want to superimpose your own data points on the map and make them easily visible.
URL template: http://{s}.www.toolserver.org/tiles/bw-mapnik/{z}/{x}/{y}.png
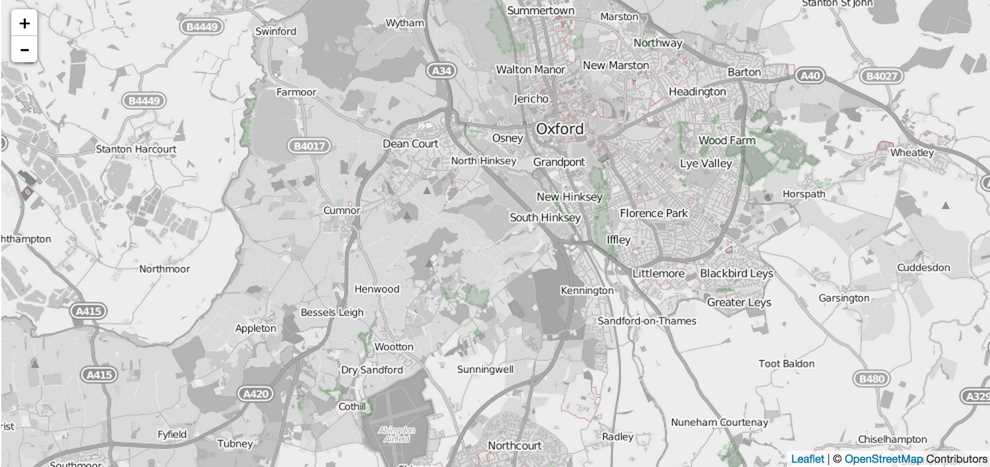
Figure 6: OSM Black and White
Code Listing 9: OSM Black and White
... // OSM Black & White var osmLink = "<a href='http://www.openstreetmap.org'>Open StreetMap</a>"; L.tileLayer( 'http://{s}.www.toolserver.org/tiles/bw-mapnik/{z}/{x}/{y}.png', { attribution: '© ' + osmLink, maxZoom: 18 }).addTo(map); ... |
Thunderforest
Thunderforest is owned by Andy Allan, a digital cartographer best known for OpenCycleMap. Thunderforest now offers a range of different tile layers which, like OpenCycleMap, are based on OpenStreetMap. Check out the Docs page here.
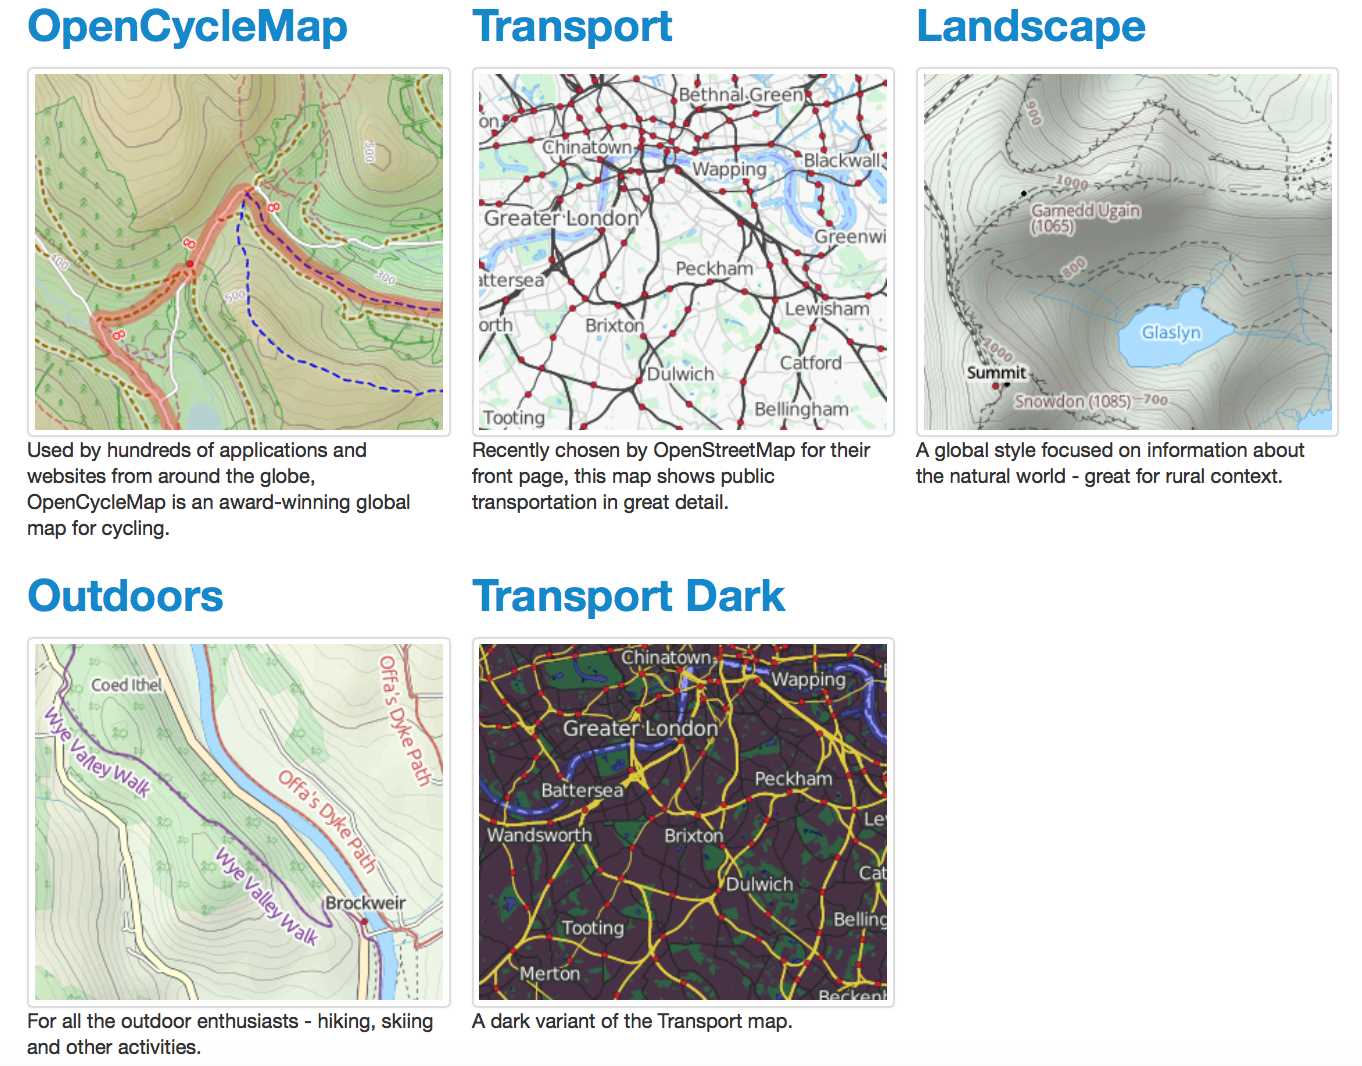
Figure 7: Tile Layers provided by www.thunderforest.com
URL template: http://{s}.tile.thunderforest.com/<tilelayer>/{z}/{x}/{y}.png
Where possible, entries for <tilelayer> are:
- cycle
- transport
- landscape
- outdoors
- transport-dark
Stamen
Stamen provides a number of gorgeous tile layers. Some of these are widely useful, such as their beautifully-shaded Terrain (USA only) and high-contrast Toner layers. Others, such as their sublime Watercolor map, are perhaps less immediately useful but very good fun to play with.
URL template: http://{s}.tile.stamen.com/<tilelayer>/{z}/{x}/{y}.<jpg/png>
We’ll have a look at some of Stamen’s tile layers later in this chapter.
Other tile layer providers
There are several other tile providers we don’t space to do justice to here. However, hopefully you will have seen by now that the process for using tile layers is very similar, regardless of the provider.
Check out these providers for starters, and look at their documentation for the correct method to add their tile layers to your Leaflet.js maps:
- Esri: The world’s largest Geographical Information Systems company. They have a selection of very high-quality tile layers, available here.
- MapQuest: MapQuest offers a couple of very useful tile layers. The MapQuest Open Aerial tiles consist of aerial imagery that covers the globe at various different levels of detail. The MapQuest OSM tiles are a variation on OpenStreetMap data with different styling. MapQuest makes these tile layers easy to use via a Leaflet plug-in.
- Cloudmade and MapBox: Both of these companies offer tile layers. Leaflet’s creator, Vladimir Agafonkin, now works for MapBox, and the Leaflet.js framework is a central part of MapBox’s services.
WMS (Web Map Service) tile layers (TileLayer.WMS)
Another option you can consider when you are looking for basemaps for your application is a WMS (Web Map Service) layer. WMS is a recognized standard for serving map imagery over the web, defined by the Open Geospatial Consortium. Unlike the tile layers we have seen so far, WMS imagery is generated dynamically by a map server, such as ArcGIS Server, MapServer, or GeoServer. The map server queries a spatial database that contains all the data required to generate the map dynamically, creates the required images and then sends them down to the browser for display. The benefits of dynamically generating imagery in this way (as opposed to using pre-created map tiles) include not being confined to the zoom levels at which the tiles were created, being able to choose which data (layers) within the map service to display, and the fact that you can request transparent images. Using transparency lets you stack layers without the top-most layer obscuring the ones beneath it.
With it being an industry standard, there are a lot of WMS services out there, but admittedly some of them are quite hard to find. The exciting thing about this approach is that, with a bit of know-how and freely available software such as QGIS (for map creation), PostGIS (for the spatial database) and GeoServer (to act as a WMS server), you can create your own basemap services. So, if you’ve ever wanted to create a web map of Westeross in the Game of Thrones series, knock yourself out!
One of the best places I’ve found on the web to locate WMS services is the Spatineo Directory. You can search by keyword, geographic area, and layer type (WMS). Note that there is a definite U.S. bias here. The United States seems keener to share geographic information than, for example, Europe, where I live.
Here is the code for using a WMS layer (TileLayer.WMS) in Leaflet.js:
Code Listing 10: WMS tile layer
... // Esri World Imagery Service L.tileLayer( 'http://server.arcgisonline.com/ArcGIS/rest/services/\ World_Imagery/MapServer/tile/{z}/{y}/{x}', { attribution: '© ' + mapLink + ', ' + sourcesLink, maxZoom: 18, }).addTo(map); // US States WMS Layer L.tileLayer.wms("http://demo.opengeo.org/geoserver/wms", { layers: 'topp:states', format: 'image/png', transparent: true, attribution: "<a href='http://www.boundlessgeo.com'>OpenGeo</a>" }).addTo(map); ... |
The main differences between TileLayer.WMS and TileLayer are:
- The URL does not use placeholders like the standard tile layer URLs. Each URL is different depending on who served it and how, so you’ll need to do a bit of research into a WMS layer before you use it. (This typically involves issuing a GetCapabilities request on the service and deciphering the XML it returns. See this tutorial for more information.)
- You need to find out which layers are available within the WMS tile layer and list the ones you want in the layers property, separated by commas. (Again, this information is available via a GetCapabilities request.)
- You can set the transparent property to true so that you can see your other map layers in regions where there is no data for the WMS layer. For this to work, the image format property must be set to image/png.
In Figure 6, I am using a sample GeoServer WMS layer from an instance hosted by Boundless showing U.S. state polygons, and superimposing this on the Esri World Imagery tile layer.
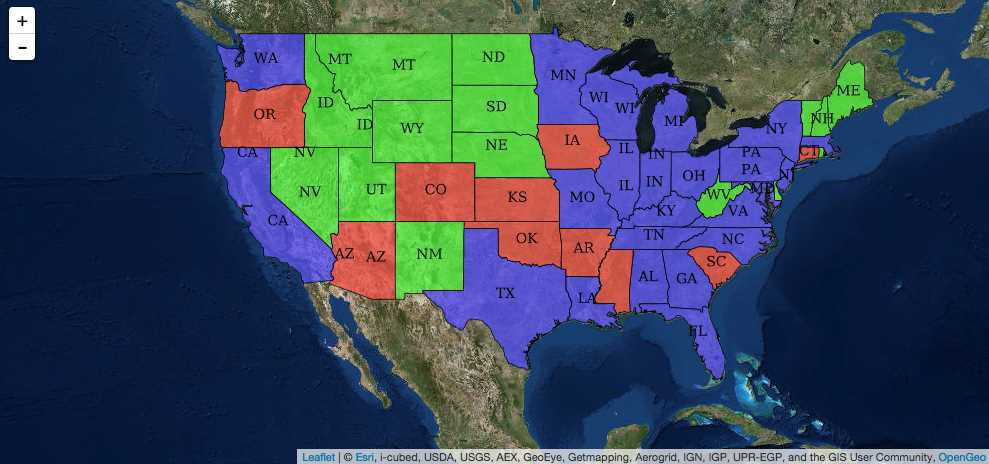
Figure 8: WMS layer showing US states
Switching between multiple tile layers
Wouldn’t it be nice to allow your users to select from a range of base maps, rather like Google Maps does? Well, Leaflet.js makes it easy. We can use one of the framework’s built-in controls: the layers control. Let’s do that.
If you want to follow along, make a new file in your web server document root called basemaps.html. Copy the code from mymap.html and paste it into basemaps.html. Remove the script block that contains your init() function declaration and replace it with the code in Listing 10.
Code Listing 11: Basemap switching
... function init() { map = L.map('map').setView([37.42, -122.05], 12); attrLink = 'Map tiles by <a href="http://stamen.com">Stamen Design</a>, under <a href="http://creativecommons.org/licenses/by/3.0">CC BY 3.0</a>. Data by <a href="http://openstreetmap.org">OpenStreetMap</a>, under <a href="http://creativecommons.org/licenses/by-sa/3.0">CC BY SA</a>.' attrLinkToner = 'Map tiles by <a href="http://stamen.com">Stamen Design</a>, under <a href="http://creativecommons.org/licenses/by/3.0">CC BY 3.0</a>. Data by <a href="http://openstreetmap.org">OpenStreetMap</a>, under <a href="http://www.openstreetmap.org/copyright">ODbL</a>.'; var terrainMap = L.tileLayer( 'http://{s}.tile.stamen.com/terrain/{z}/{x}/{y}.jpg', { attribution: attrLink, maxZoom: 18, }).addTo(map); var tonerMap = L.tileLayer( 'http://{s}.tile.stamen.com/toner/{z}/{x}/{y}.png', { attribution: attrLinkToner, maxZoom: 18, }).addTo(map); var watercolorMap = L.tileLayer( 'http://{s}.tile.stamen.com/watercolor/{z}/{x}/{y}.jpg', { attribution: attrLink, maxZoom: 18, }).addTo(map); var baseLayers = { "Stamen Terrain": terrainMap, "Stamen Toner": tonerMap, "Stamen Watercolor": watercolorMap }; L.control.layers(baseLayers).addTo(map); } ... |
The things to note here are as follows:
- We have added three tile layers from Stamen Design.
- We have assigned each tile layer constructor to a variable so that we can reference it in later code.
- We created a simple JavaScript object literal called baseLayers, which consists of three key/value pairs: the name of the layer as we want it to appear in our layers control followed by the layer’s variable name.
- We then created a layers control, passing in the baseLayers object to tell it which layers to work with, and then immediately called .addTo() to add the layers control to our map.
View the page in the browser. You’ll notice that a little control appears in the top right-hand corner of the map. Click the control and the layer selection list appears, configured as you specified in the baseLayers object. You can now choose which basemap layer to display.
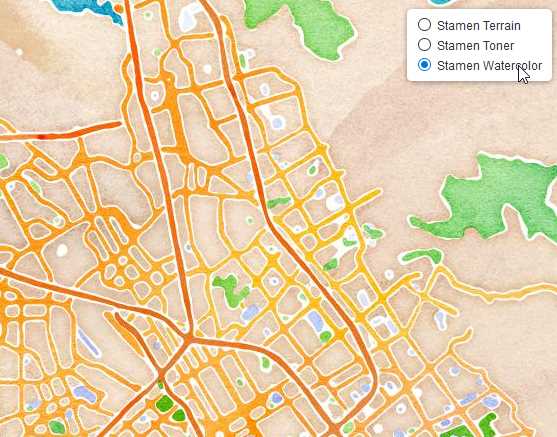
Figure 9: The layers control in action, showing the Stamen Watercolor tiled map service
- 1800+ high-performance UI components.
- Includes popular controls such as Grid, Chart, Scheduler, and more.
- 24x5 unlimited support by developers.