
Leaflet.js Succinctly®

CHAPTER 4
Handling Events
Now that you have an application that contains a map and some data, you’ll often want a way for your users to interact with it. So far, the only interaction you have enabled is the ability for a user to click on a feature in your overlay and see a popup that you bound to it using the .bindPopup() method.
Just about every control in Leaflet.js emits events to alert your application when things happen. For example, the L.Map class supports 34 events at the time of writing. These range from the sort of event that you expect just about any control in any programming environment to have, such as focus, mouseover, and click, to ones that are very specific to the functionality it provides, such as overlayadd (when a new overlay is added to the map) and move (when the map extent changes).
Map control events
This table lists the events supported in L.Map. It shows the name of the event, the object returned when the event fires, and a description.
Table 1: Map Control Events
L.Map Events | ||
|---|---|---|
Name | Return Type | When Fired |
click | MouseEvent | When the user clicks (or taps) the map |
dblclick | MouseEvent | When the user double-clicks (or double-taps) the map. |
mousedown | MouseEvent | When the user pushes the mouse button while over the map. |
mouseup | MouseEvent | When the user releases the mouse button while over the map. |
mouseover | MouseEvent | When the mouse pointer enters the map. |
mouseout | MouseEvent | When the mouse pointer leaves the map. |
mousemove | MouseEvent | While the mouse pointer is moving over the map. |
contextmenu | MouseEvent | When the user pushes the right mouse button while over the map (or uses a long press on a mobile device). If you handle this event, it prevents the usual context menu from appearing. |
focus | Event | When the map control gains the focus (via clicking, panning, or tabbing to it). |
blur | Event | When the map control loses the focus. |
preclick | MouseEvent | Prior to the click event occurring. This is useful if you want to pre-empt the click behavior. |
load | Event | When the map is initialized and its center and zoom level is fixed for the first time. |
unload | Event | When the map is destroyed using the .remove() method. |
viewreset | Event | When the map needs to redraw. |
movestart | Event | When the map extent starts to change (such as when the user starts dragging the map). |
move | Event | When the map extent (center point or zoom level) changes. |
moveend | Event | When the map extent stops changing (such as when the user stops dragging the map). |
dragstart | Event | When the user starts dragging the map. |
drag | Event | While the user is dragging the map. |
dragend | DragEndEvent | When the user stops dragging the map. |
zoomstart | Event | When the map zoom level is about to change (before zoom animation occurs). |
zoomend | Event | When the map zoom level changes. |
zoomlevelschange | Event | When the number of zoom levels in the map changes due to the addition or removal of a layer. |
resize | ResizeEvent | When the map control is resized. |
autopanstart | Event | When the map begins to autopan as a result of a popup being opened. |
layeradd | LayerEvent | When a new layer is added to the map. |
layerremove | LayerEvent | When a layer is removed from the map. |
baselayerchange | LayerEvent | When the layer control changes the current base layer. |
overlayadd | LayerEvent | When the layer control selects an overlay. |
overlayremove | LayerEvent | When the layer control deselects an overlay. |
locationfound | LocationEvent | When geolocation is successful. |
locationerror | ErrorEvent | When geolocation fails. |
popupopen | PopupEvent | When a popup is opened via .openPopup() |
popupclose | PopupEvent | When a popup is closed via .closePopup() |
This is the list of events for just one of the controls in Leaflet.js (although arguably the most complex). All the other controls emit their own events, and this is what makes it possible to create highly interactive web mapping applications.
In this chapter, we’re going to be using the map control’s events to demonstrate event handling in Leaflet.js. For information about the events belonging to the other controls, check out the Leaflet.js documentation for the control you are interested in.
Handling events
In order to work with events, you need to know:
- Which event you want your application to start noticing
- The name of the event
- The type of data returned by the event when it fires
Let’s demonstrate this with an example. Suppose we want to build an application that allows a user to click on the map and display the map coordinates at the point they clicked, in a popup.
Looking at Table 1, we can see that the event we want to monitor is the map’s click event. In order to start capturing click events, we need to create an event handler for that event. We can do this using the map’s .on() method, which takes as its first parameter the name of the event that we want to handle (click), and a function (the callback) that will respond to the event as its second parameter.
We can wire up the event handler and test that it is working using the following simple code:
Code Listing 34: Handling the map's click event
... <script type="text/javascript"> function init() { var map = L.map('map').setView([52.187, -1.274],7); // OSM Mapnik var osmLink = "<a href='http://www.openstreetmap.org'>Open StreetMap</a>"; L.tileLayer( 'http://{s}.tile.openstreetmap.org/{z}/{x}/{y}.png', { attribution: '© ' + osmLink, maxZoom: 18, }).addTo(map); map.on("click", function() { alert("You clicked the map!"); }) } </script> ... |
If your code is correct and free of syntax errors, you can launch the app and click on the map, and your handler should fire and display a message box:
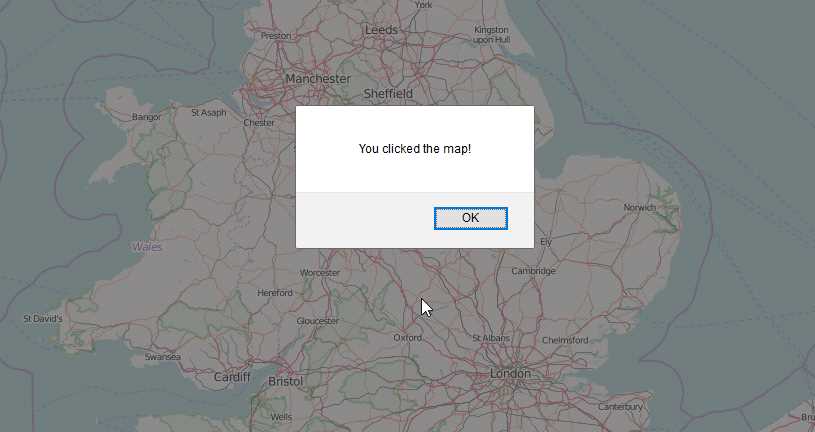
Figure 28: The map captures the click event
If you have gotten this far, then you know that your application is listening to the map click event. Great! The next thing to do is to capture the information that the map click event is just itching to pass to your event handler, but that is currently being ignored.
In order to do something with the event data, you need to know what type of data is being returned and then adjust your callback function to intercept and process it.
Looking at Table 1, you can see that the map’s click event returns an object of type MouseEvent. The Leaflet.js documentation for MouseEvent provides the following information:
Table 2: MouseEvent properties:
MouseEvent | ||
|---|---|---|
property | type | description |
latlng | LatLng | The geographical point where the mouse event occurred. |
layerPoint | Point | Pixel coordinates of the point where the mouse event occurred relative to the map layer. |
containerPoint | Point | Pixel coordinates of the point where the mouse event occurred relative to the map container. |
originalEvent | DOMMouseEvent | The original DOM mouse event fired by the browser. |
Looking at this table, you can see that MouseEvent extends DOMMouseEvent, which is the original event object for a mouse click on any DOM element in a web page. It just adds a few new properties relevant to the map. If we need the information from the original event, we can drill into the MouseEvent’s originalEvent property.
However, for our purposes, we don’t need to do that. Our goal is to display the geographical coordinates of the point at which the user clicked, and that information is available in the MouseEvent’s latlng property. With that in mind, we can adjust our callback to handle the event and report the information back to the user.
Code Listing 35: Displaying map click coordinates in a message box
... map.on("click", function(e) { var lat = e.latlng.lat; var lng = e.latlng.lng; alert("You clicked the map at " + lat + "," + lng); }) ... |
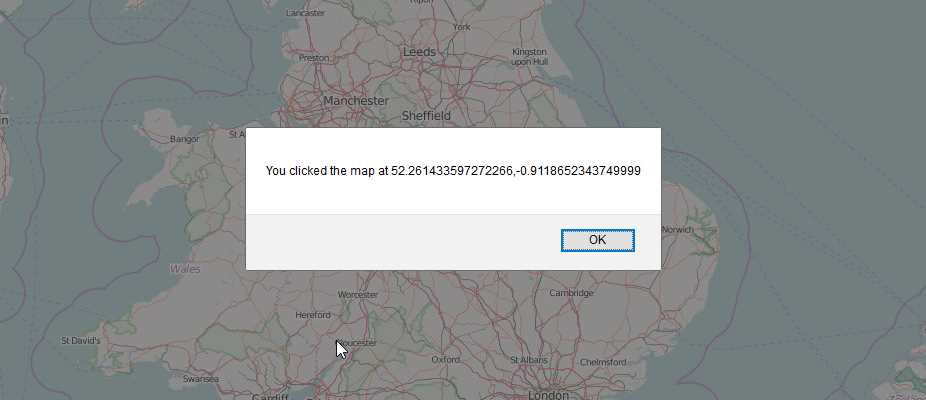
Figure 29: Displaying the map click coordinates in a message box
That’s all well and good, but the use of a message box is a bit intrusive because it’s modal and prevents us from interacting with the map. Besides which, our original task was to display the information in a popup. So why don’t we use the knowledge we gained in the previous chapter to add a new marker object at the point where we clicked, so that we can see where it is on the map and perhaps refer to it again later once we’ve clicked elsewhere? While we’re at it, we’ll use a running counter of map clicks and format the output nicely in HTML:
Code Listing 36: Display map coordinate data as a marker with a popup
... var clickCount = 0; map.on("click", function(event) { var lat = event.latlng.lat; var lng = event.latlng.lng; ++clickCount; var popupContent = "<h2>Marker " + clickCount + "</h2>" + "<p>Map coordinates:</p>" + "<ul><li>Latitude: " + lat + "</li>" + "<li>Longitude: " + lng + "</li></ul>"; var myMarker = L.marker([lat, lng], { title: "Click to see map coordinates" }).bindPopup(popupContent).addTo(map); }) ... |
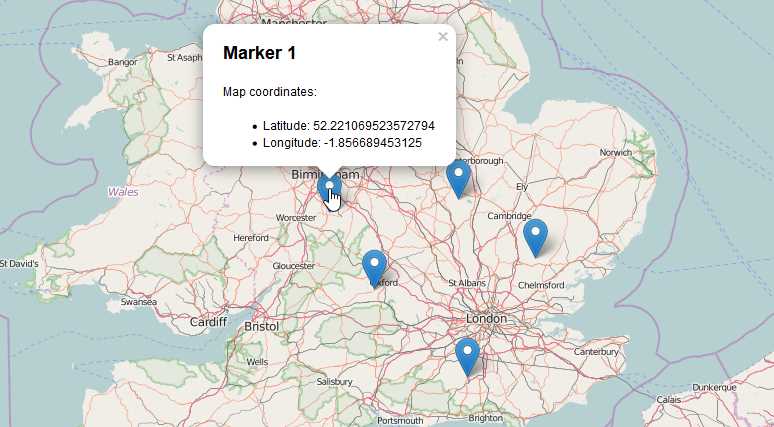
Figure 30: Markers placed at click coordinates
Let’s try something a little more complex to really get the hang of working with events. We’re going to implement a very simple geofence. A geofence is basically a “virtual barrier.” When something enters a specified area, an alert is triggered.
In our example, the geofenced area is going to be a rectangle that has appeared mysteriously in the middle of the Irish countryside, and our “something” is going to be one or more markers.
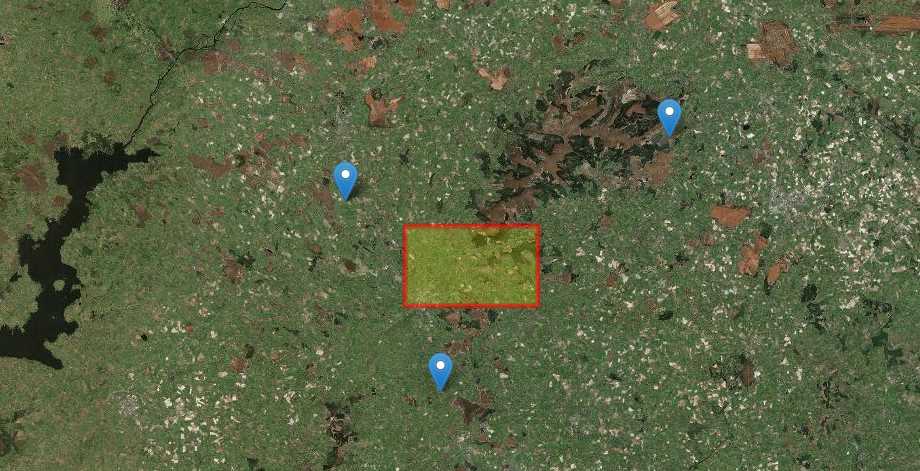
Figure 31: Our "geofence" and markers
Were going to make our markers draggable so that the the user of our application can move them around the countryside. Making a marker draggable is as simple as setting its draggable property to true.
Then we’re going to wire up two event handlers to monitor the marker’s dragstart and dragend events. As the names suggest, these events are fired when the user commences and finishes dragging the marker, respectively.
Because we have three markers, we’re going to create just one event handler for each of the dragstart and dragend events, and the markers will share them. We’ll dig into the Event object that gets passed into our callback to work out which marker raised the event.
Here’s our starting point:
Code Listing 37: Geofence code, showing event handler stubs
... <script type="text/javascript"> var theRectangle; function init() { var map = L.map('map').setView([52.96228865548326, -7.499542236328124],10); var mapLink = "Esri"; var sourcesLink ="Contributors"; // Esri World Imagery Service L.tileLayer( 'http://server.arcgisonline.com/ArcGIS/rest/services/. . . { attribution: '© ' + mapLink + ', ' + sourcesLink, maxZoom: 18, }).addTo(map); theRectangle = L.rectangle( [[52.947728, -7.820206],[53.013874, -7.637558]], { color: "red", weight: 5, fillColor:"yellow", } ).addTo(map); var marker1 = L.marker([53.085694, -7.459030], {draggable:true}).addTo(map); marker1.on("dragstart", dragStartHandler); marker1.on("dragend", dragEndHandler); var marker2 = L.marker([52.875678, -7.772141], {draggable:true}).addTo(map); marker2.on("dragstart", dragStartHandler); marker2.on("dragend", dragEndHandler); var marker3 = L.marker([53.033699, -7.903976], {draggable:true}).addTo(map); marker3.on("dragstart", dragStartHandler); marker3.on("dragend", dragEndHandler); } function dragStartHandler(e) { // starting marker drag } function dragEndHandler(e) { // ending marker drag } </script> ... |
At this point you might want to make sure that the dragStartHandler() and dragEndHandler() events fire when you drag the markers around. You can log something to the browser console using console.log("message"), which you can view in your browser’s developer tools, or log something to the browser console using console.log("message"), which you can view in your browser’s developer tools. I use Firefox with the amazing Firebug extension, but all the main browsers these days have pretty good developer tools you can use to debug your scripts.
The first thing we’re going to do is create a nice little visual effect that makes the markers partially transparent while they’re being dragged, and restores them to full opacity when they reach their destination. To achieve this, we need to know which marker raised the events, so we can set the opacity on that marker and leave the others alone.
Looking at the documentation, we can see that the dragstart and dragend events both pass different event objects into their callbacks:
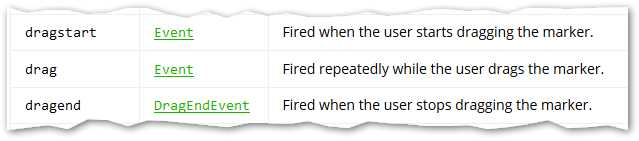
Figure 32: The marker's drag events
Let’s dig further into the documentation to look at those event objects. First, the Event object for the dragstart event:
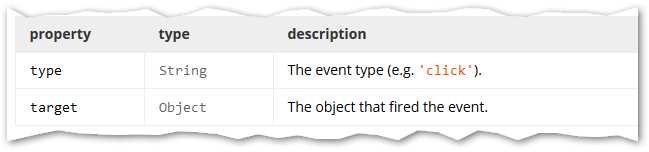
Figure 33: The Event object
The Event object, as the documentation helpfully points out, is the basis of all the other event classes, and they include its properties. One of those properties, target, is absolutely vital for us to be able to work out which marker raised an event.
Now the DragEndEvent object, for the dragend event:
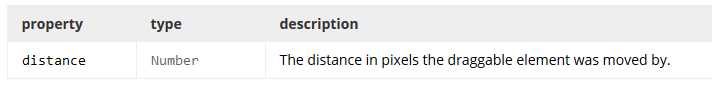
Figure 34: The DragEndEvent object
DragEndEvent includes a distance property, so we can work out how far a particular marker was dragged. That’s interesting for other use cases, but not relevant for what we are trying to achieve in this example. So for the dragend event, we’ll just be using properties on DragEndEvent’s parent class: Event.
We want to work out which marker raised the dragstart event and set its opacity to 0.5, which is half-transparent. We also want to know which marker raised the dragend event so we can reset its opacity to 1.0 (fully opaque). We can use the event object’s target property to retrieve the marker that raised the event, and then call its setOpacity() method:
Code Listing 38: Setting the marker transparency during the drag operation
... function dragStartHandler(e) { // starting marker drag e.target.setOpacity(0.5); } function dragEndHandler(e) { // ending marker drag e.target.setOpacity(1.0); } ... |
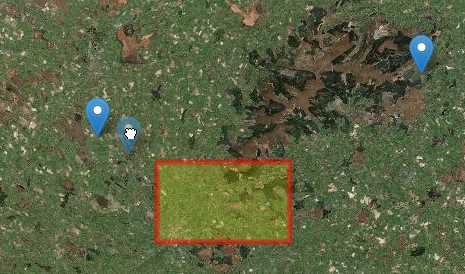
Figure 35: Marker becoming partially transparent during the drag operation
That’s great. We can now move our markers around our map, including into the geofenced area, and we’ve got some nice transparency effects.
What we now need to work out is if any of our markers end up in the geofence. If they do, then we can change their appearance to highlight that fact.
First, we need to work out the extent of the rectangle. The Rectangle class implements the abstract class Path, which gives it access to all of Path’s properties, events, and methods. This includes the getBounds() method, which returns a LatLngBounds object representing the bounding rectangle that encloses our rectangle. In the case of a rectangle, the bounding rectangle that encloses the rectangle is exactly the same size and shape as the rectangle it encloses! But the other overlays we have covered, such as the Polygon, also implement getBounds(), and their enclosing rectangles could be a very different shape:
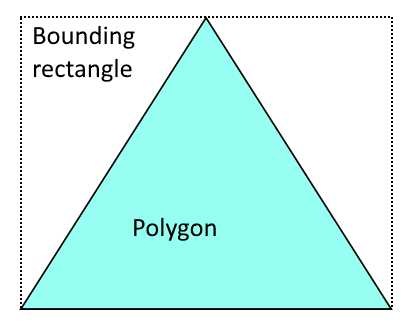
Figure 36: The bounding rectangle of a polygon
Having retrieved the LatLngBounds object, we can then call one of its contains() methods, passing in the marker’s map coordinates, to establish whether the rectangle encloses the marker:
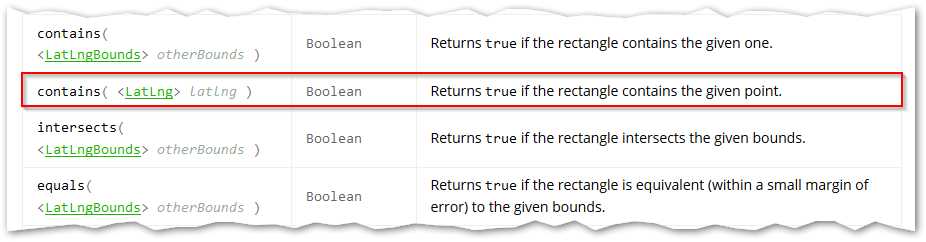
Figure 37: The LatLngBnds object's contains, intersect,s, and equals methods
You can see from the extract from the Leaflet.js API reference that LatLngBnds contains two versions of contains(): one for points (such as the location of our marker), and one for other rectangles. It also includes methods to check whether one rectangle intersects another one, or for the equivalency of two rectangles.
We need to implement this check in our dragend event handler. If contains() returns true, then we know that our marker has entered the geofence, and we need some way to alert the user. In this example, I’m just using a bit of CSS to change the marker icon background color, but you could switch the marker’s icon instead, to achieve a different effect:
Code Listing 39: Checking if the new marker position falls within the geofence rectangle
... function dragEndHandler(event) { // ending marker drag event.target.setOpacity(0.5); if (theRectangle.getBounds().contains(event.target.getLatLng())) { event.target.valueOf()._icon.style.backgroundColor = 'red'; } } ... |

Figure 38: Geofenced marker
- 1800+ high-performance UI components.
- Includes popular controls such as Grid, Chart, Scheduler, and more.
- 24x5 unlimited support by developers.