
Leaflet.js Succinctly®

CHAPTER 1
Getting to Know Leaflet.js
What is Leaflet.js?
Leaflet.js is a super-lightweight mapping library. It consists of approximately 34KB of compressed JavaScript with absolutely no external dependencies. What makes Leaflet.js really remarkable is that it manages to do this without sacrificing features. Whereas many frameworks quickly become bloated and complex over time, Leaflet.js is still relatively new on the scene, and was designed from the ground up by developer Vladimir Agafonkin to be simple, intuitive, and easy to use.
Leaflet.js is open source and has a very vibrant and active developer community. Although the core library is very small by design (to avoid your application having to download lots of code it does not rely on), there are numerous plugins you can use to extend the functionality of your web-mapping applications. So if you are looking at another web mapping framework and thinking, “Wouldn’t it be cool if Leaflet.js did that?” you can be almost certain that someone, somewhere thought the same thing and wrote a plugin for it.
I could go on about the great design of Leaflet.js and its amazing capabilities, but this is a Succinctly guide, and we want you to get up and running straight away—and help you discover these things for yourself. So let’s get started.
What do you need to get started?
Basically, not much. You need a text editor to write your code; any text editor that you are familiar with will work just fine. I’m using a cross-platform editor called Brackets that is specifically designed for web development by Adobe, but you can use anything you like. Try and get one that supports syntax highlighting for HTML, CSS, and JavaScript, because it will help you make sense of your code and quickly spot any syntax errors. Notepad++ is a good choice for Windows users.
You’ll need a web browser. Again, use your favorite, but I’d suggest choosing either Mozilla Firefox or Google Chrome, simply because they have such excellent developer tools. These can really help when you’re scratching your head over why some feature of your application does not work and JavaScript is not being forthcoming about the nature of the error.
I also recommend that you use a web server to host your HTML pages and JavaScript code. Although it’s possible to run most of the samples in this book by opening the code file directly in the browser, you’ll want to use a web server for anything more than trivial experimentation. I use XAMPP, which is super-easy to configure and use, and available on both Windows and Mac. XAMPP provides an installer to set up a local Apache web server, as well as other components you might find useful as you start to expand upon your knowledge of Leaflet.js. These include MySQL (the world’s most popular open source web database) and MariaDB, a drop-in replacement for MySQL, and the PHP language for server-side scripting.
Other options include WAMP (for Windows) and MAMP (for Mac OS).
Just run the installer for your chosen solution, start it up, and note where the server’s document root is, and which port the web server is running on. The document root is the location on your file system where you will put the HTML and JavaScript (and PHP, if you follow along with the examples in Chapter 5) files you create. When you try to access a specific page via your web browser, the web server looks in the document root for the corresponding file. You will need to enter the port number as part of the URL so that your chosen web server can intercept any requests.
Launch the application’s GUI control panel and make sure the Apache and MySQL services are running. (MySQL is optional here, but you’ll need it later on if you want to run the database samples in Chapter 5.) This is what it looks like in XAMPP:
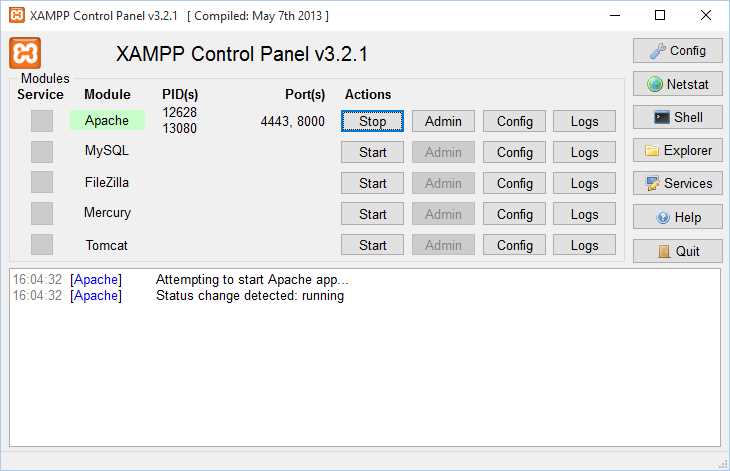
Figure 1: XAMPP control panel
I'm using a slightly older version of XAMPP. The most recent version of XAMPP contains the MariaDB database system rather than MySQL. The two DB systems are binary-compatible, so you'll have no trouble using MariaDB if you want to follow the code examples in this e-book. In my environment, I have Apache running and listening on port 8000. The default port for Apache is 80, but I have another web server using that port, so I used the “Config” option to change the port number. I can visit http://localhost:8000 in my web browser and see the confirmation page:

Figure 2: XAMPP/Apache confirmation page
Apache requires that you place your web pages in its htdocs folder, which, in my XAMPP environment, is under C:\xampp\:

Figure 3: Where to put your code files
Any .html, .js, or .php pages you place in the root directory can be accessed via your browser at http://localhost:<port number>/<page name>.
The source code for this book
The source code for all the code listings in this book, along with any relevant images and other files, can be downloaded here.
Each code listing in the book relates to a file that is numbered accordingly, within a folder named after the chapter it appears in. For example, the source code for Code Listing 1 can be found in the directory called Ch01_gtk, and is called listing01.html.
I have also included the source code for the two “helper” applications I refer to in this book. They can be found in the extentfinder and mapdraw directories within the zip file, or accessed online at the following locations:
Creating a simple map in a web page
You are going to create a simple interactive web map in just a few lines of code. Because this is a web map, it needs to be hosted in a web page. So open up your text editor of choice and create a file called mymap.html. Enter the following HTML markup into the file:
Code Listing 1: Basic HTML Web Page
<!DOCTYPE html> <html> <head> <title>My Leaflet.js Map</title> </head> <body> </body> </html> |
Steps to create the map
Perform the following steps to create your first map:
- Reference the Leaflet.js library and CSS.
- Create a <div> element on your page where the map will appear.
- Create a map object.
- Add a layer to the map.
Referencing Leaflet.js in your code
There are two ways to use Leaflet.js in your applications:
- Reference a hosted version of the library via a Content Delivery Network (CDN).
- Download the Leaflet.js library and host it on your own web server.
Accessing Leaflet.js via a CDN
To access Leaflet.js via a CDN (Content Delivery Network), reference its CSS by using a <link> tag, and the JavaScript library by using a <script> tag. Both of these tags should appear in the <head> section of your HTML page, right after the <title> tag:
Code Listing 2: Accessing Leaflet.js via a CDN
... <head> <title>My Leaflet.js Map</title> <link rel="stylesheet" href="http://cdnjs.cloudflare.com/ajax/libs/leaflet/0.7.3/leaflet.css" /> <script src="http://cdnjs.cloudflare.com/ajax/libs/leaflet/0.7.3/leaflet.js"> </script> </head> ... |
Note: The URLs shown in Code Listing 2 should reference the latest stable version of Leaflet.js, which at the time of writing, is 0.7.3. Check the Leaflet.js website for the latest available stable version.
We’ll be using a CDN for the examples in this book.
Accessing Leaflet.js from your own web server
If you want to host Leaflet.js yourself, you have a couple of options:
- Download a pre-built package from the Leaflet.js website to your document root, and set the appropriate path in the <script> and <link> tags. The package archive contains the minified JavaScript code (leaflet.js) and an unminified version called leaflet-src.js, which can help when debugging. It also includes the required CSS.
- Download the source code from GitHub and build it using Node.js. This gives you access to absolutely everything, including the original source code, unit tests, and so on. You’ll need to do this if you want to get a good look at the internals of Leaflet.js, and perhaps even add new features to make it even better for the rest of us! See the Leaflet.js website for full instructions.
Creating a <div> element for your map
Before you write any Leaflet.js code, you need to create a space on your page to host the map. Just create a <div> element, and give it a suitable id attribute so that you can refer to it in your code later on. You must also specify (at a minimum) a height attribute for the <div>. If you don’t specify a height attribute, the map won’t display. Specify a width attribute as well, if you want. If you choose not to, then the map will span the entire width of its parent element (which in the following example is the <body> tag).
Code Listing 3: Creating and sizing the map
<!DOCTYPE html> <html> <head> <title>My Leaflet.js Map</title> <link rel="stylesheet" href="http://cdnjs.cloudflare.com/ajax/libs/leaflet/0.7.3/leaflet.css" /> <script src="http://cdnjs.cloudflare.com/ajax/libs/leaflet/0.7.3/leaflet.js"> </script> <style> #map { height: 400px; } </style> </head> <body> <div id="map"></div> </body> </html> |
But that’s a lot of empty page and a tiny map, right? What if you want to make the map occupy the entire page? Just make sure the map <div> and its parent elements have their height attribute set to 100%.
Code Listing 4: Making the map full screen
... <style> html, body, #map { height: 100%; } </style> ... |
Creating the map object
Now that we have a place for the map on our page, we need to create the Leaflet.js map object. To do that, we need to write a JavaScript function and wait for all the elements in the page to load before we call it. If we don’t wait, then our map <div> might not yet exist when we attempt to reference it in our code, and we’ll get an error.
Create a <script> tag to host your JavaScript code, and stub out a function that will be called when the DOM has finished loading:
Code Listing 5: Creating a function that waits for all page elements to load
... <script type="text/javascript"> function init() { alert("I'm ready!"); } </script> </head> <body onload=init()> <div id="map"></div> </body> </html> |
Save it, launch it in your web browser, and confirm that the init() function gets called and displays the “I’m ready!” message. If that’s working correctly, we can use it to create the map object and tell it which <div> to display in. Replace the code within the init() function with the following:
Code Listing 6: Creating the map object
... <script type="text/javascript"> function init() { var map = L.map('map').setView([51.73, -1.28], 12); } </script> ... |
So what’s going on here?
- L.map('map') is the Leaflet.js map constructor. All Leaflet.js objects are prefixed with L. The constructor takes two arguments: the HTML element where the map will display (in our example, that is map), and (optionally) an object literal that defines specific options for the map’s appearance and behavior. We haven’t specified a map options object in this example. See the full range of map options in the Leaflet.js docs.
- .setView(…) Once we have the map object, we call its setView() method to pass in the extent of the map. The extent is the visible area we want to display. The setView() method takes two parameters. The first parameter is an array that represents the latitude and longitude of the map’s center, and the second is a number that represents the zoom level.
- The map object we defined with these two methods is then stored in our local JavaScript variable map.
If we save our file and launch it then we see…precisely nothing. That’s because although we have a map, we haven’t yet told it what data to display. We’ll do that next.
Add a layer to the map
Our map object is just a container. To actually have our map display something we need to add one or more layers.
Typically, a web map will have multiple layers. These will include base maps, which show terrain, roads, or other contextual information; and operational layers, which contain any data of particular interest to our users, such as the location of coffee shops, restaurants, or hiking trails. Usually, base maps are hosted by a third party. Operational data can also come from other sources, but is often something we provide ourselves, and can be either hard-coded into the application, loaded at runtime from a database, or entered by our users.
Considering maps as discrete layers allows a great deal of flexibility, because it allows us to show or hide information depending on what our users want to see. For example, if our users only want to see restaurants, then we can hide our “coffee shops” layer. And if they are not in the market for refreshment but want to head for the hills instead, then we can hide our “restaurant” and “coffee shops” layers and swap the street map for some satellite imagery so they can better understand where those trails lead.
Unlike, for example, Google Maps, where you only have access to Google’s own base maps, we can use an astonishing array of different base maps with Leaflet.js. Some are widely available; others need more effort to track down. With the aid of some specialist software like GeoServer or MapServer, we can even create and host our own base maps.
We’ll get more into map layers in the next chapter. For now, let’s just add a single base map layer so we can have something to play with. We’ll use one from OpenStreetmap, a wonderful map made entirely from crowd-sourced map data.
Enter the following code into the init() function to add an OpenStreetMap layer to the map:
Code Listing 7: Adding a base map layer
... <script type="text/javascript"> function init() { var osmLink = "<a href='http://www.openstreetmap.org'>Open StreetMap</a>" var map = L.map('map').setView([51.73, -1.28],12); L.tileLayer( 'http://{s}.tile.openstreetmap.org/{z}/{x}/{y}.png', { attribution: 'Map data © ' + osmLink, maxZoom: 18, }).addTo(map); } </script> ... |
Here we define a new layer of type TileLayer. We use a TileLayer because most base maps consist of a massive image that is sliced and diced into tiles so that the browser only has to download the image tiles it needs for a particular extent. We’ll talk about layers in more detail in the next chapter.
The TileLayer object’s constructor takes as its first parameter a URL that tells our application where to get the tile data from. The {s}, {z}, {x}, and {y} placeholders in the URL represent the following:
- {s} allows one of the subdomains of the primary domain to serve tile requests, enabling our application to make multiple requests simultaneously, and thereby download tiles much faster.
- {x} and {y} define the tile coordinates.
- {z} represents the zoom level.
Thankfully, we don’t have to worry about populating those placeholders ourselves; Leaflet.js takes care of that for us.
The second parameter is a JavaScript object literal that defines any options we want to set to configure the layer. In this instance we have provided some attribution data and the maximum zoom level we want our users to be able to zoom into when this layer is active.
Finally, we call the TileLayer.addTo() method and pass in the map object that we want this layer to appear in.
Save your code and navigate to the mymap.html page in your web browser. If you’re using the same set up as me, that will be at http://localhost:8000/mymap.html. You should see the following:

Figure 4: Your first Leaflet.js map
The map shows OpenStreetMap data for an area around Oxford in the United Kingdom. To interact with the map:
Zooming:
- Use the plus/minus buttons in the top left-hand corner of the map.
- Use your mouse scroll wheel.
- Shift+click and drag with the mouse (this is known as a “box zoom”).
Panning:
- Click on the map and drag the mouse.
Congratulations! You have created your first Leaflet.js map and are now officially a neogeographer. (See Wikipedia for more information on the club you have just joined.)
But Oxford, England is probably not a location that means very much to you. So, as an exercise, change the extent of the map to focus on your hometown. This requires knowing the latitude and longitude of the center of your desired extent. Since most people don’t carry that sort of information around in their heads, I have written a little helper application you can access here. Just locate your desired extent and click Get Map Code. When the dialog box appears, copy the code it contains and use it to replace the map constructor code in your application.

Figure 5: Using the extent finder application
Note: The extent finder application is accurate to far too many decimal places. You don’t normally need that kind of accuracy; anything more than three decimal places for a latitude or longitude coordinate is probably overkill.
In the next chapter we’ll look at map layers in more detail.
- 1800+ high-performance UI components.
- Includes popular controls such as Grid, Chart, Scheduler, and more.
- 24x5 unlimited support by developers.