
Leaflet.js Succinctly®

CHAPTER 7
Conclusion
So now that you’ve had a chance to play with Leaflet.js, I hope you’re as excited about its possibilities as I am. I can say that it is, hands down, the nicest web mapping API I have ever used, and I’ve tried most of them.
By keeping the core of Leaflet.js small and extending its functionality via plugins, the API is a pleasure to work with, and without the bloat that mars the efforts of some of its competitors. Things just work the way you expect them to, which is unusual in this space. A lot of mapping APIs are created by geographers, and they tend to want features and terminology in their APIs that don’t mean a great deal to ordinary folk. Leaflet’s creator, Vladimir Agafonkin, is first and foremost a web developer—and it shows, because he has built an API that other web developers can relate to.
In this book, we covered most of the core API, and even had a look at some plugins. If you want to greatly extend the functionality of your web mapping applications, then you should have a look at the sheer range of plugins out there. The official plugin page on Leaflet.js lists plenty, covering just about every sort of functionality you could even imagine.
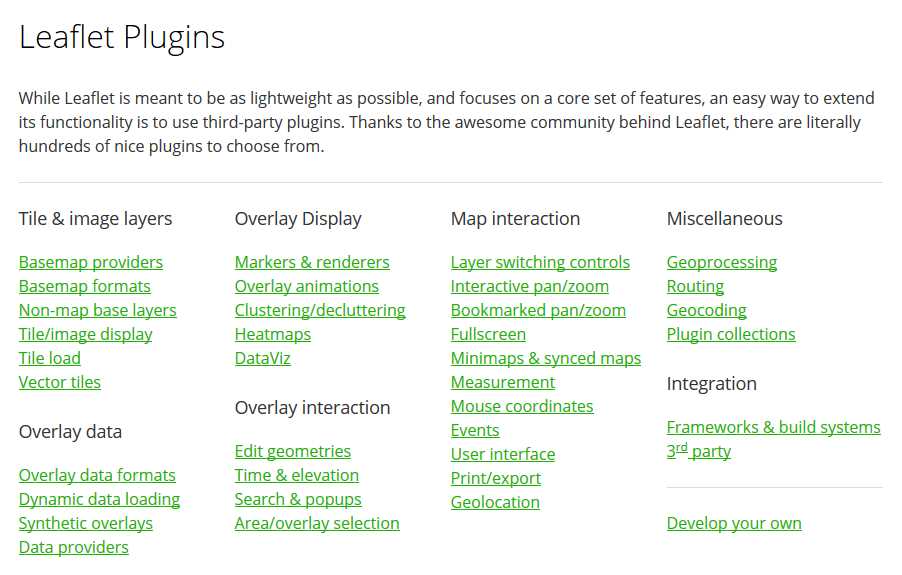
Figure 57: The Leaflet.js plugins page
There are plugins that enable animations, bookmarking of locations, route navigation, and more.
For example, if you want to create heat maps where areas of high point density are shown as “hot” and areas low point density are shown as “cold,” then you should consider the heatmap.js plugin by Patrick Wied:
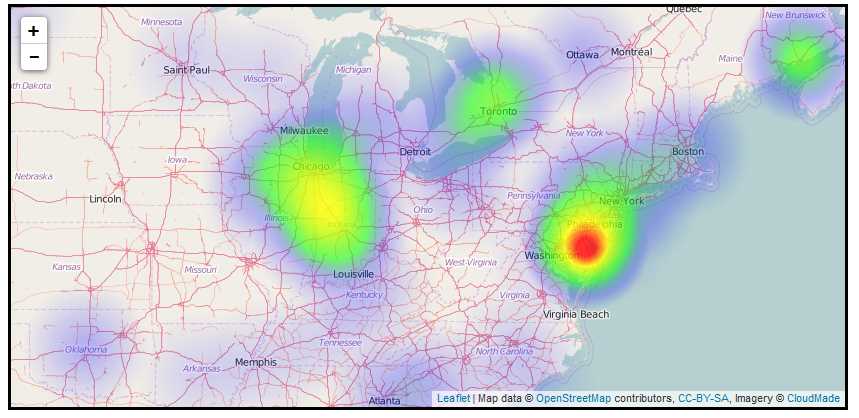
Figure 58: The heatmap.js plugin by Patrick Wied
If you want to use the D3.js to create dynamic, interactive data visualizations in conjunction with Leaflet.js, you should have a look at Kirill Zhuravlev’s Leaflet.D3SvgOverlay plugin, which allows you to combine the power of D3.js with the interactivity of SVG:
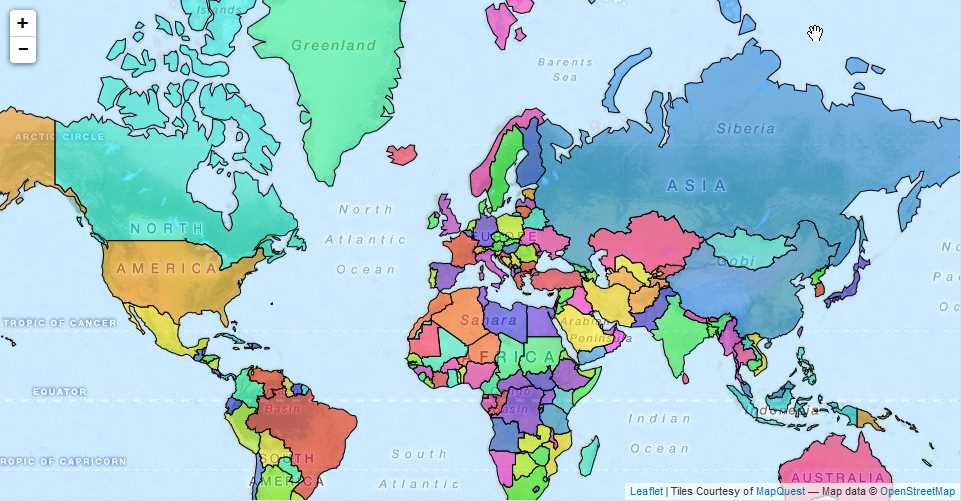
Figure 59: The Leaflet.D3SvgOverlay plugin by Kirill Zhuravlev
If you want to visualize temporal data in Leaflet.js and allow your users to use a time slider to alter the period for which they want to see data, try the Leaflet.TimeDimension plugin by SOCIB:
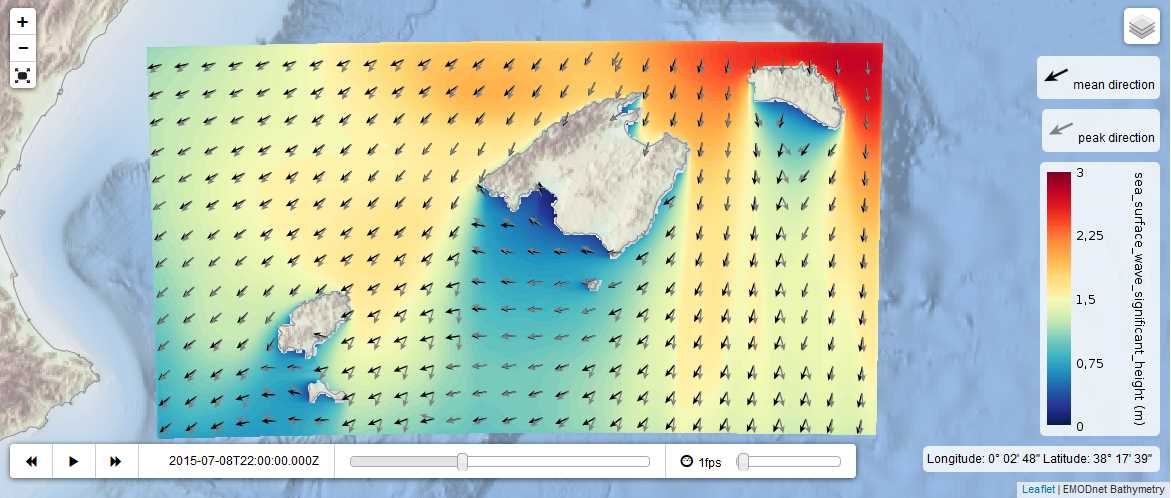
Figure 60: Visualizing temporal data with Leaflet.TimeDimension
Or if you’re all about usability, check out the handy little overview map (Leaflet.miniMap) provided by Robert Nordan. It provides a control that allows you to see the larger extent to which the current map view belongs, and even navigate directly from it:
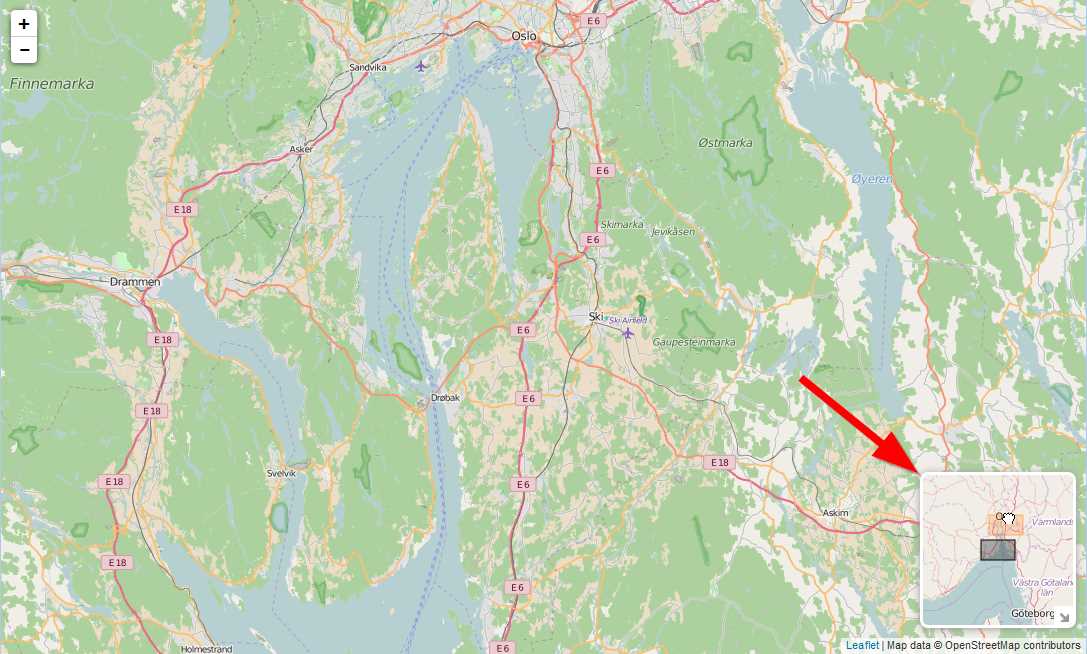
Figure 61: Robert Nordan's Leaflet.MiniMap
If there’s some functionality you want that doesn’t appear to be served by one of Leaflet’s official plugins, then a search on GitHub will usually give you an amazing array of possibilities. Be warned, though: the quality through unofficial channels is very variable:
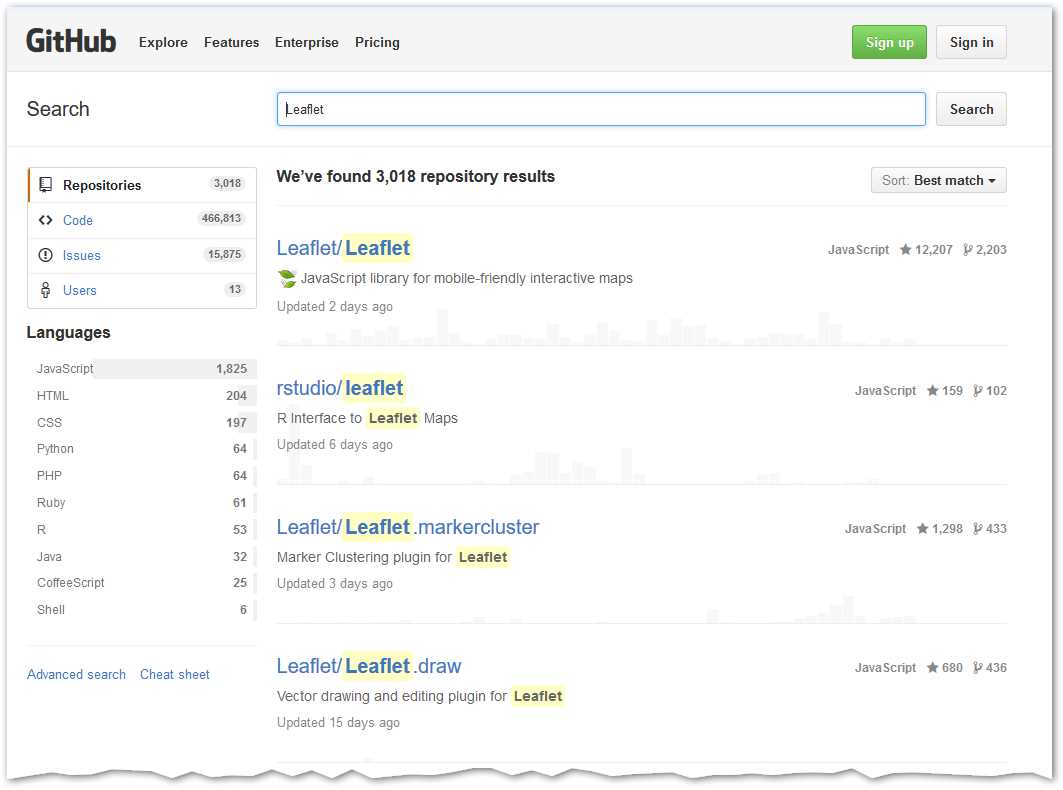
Figure 62: A huge array of plugins can be found on GitHub, as well as the Leaflet.js code itself
Finally, if there’s nothing there that fits the bill, why not create your own plugin and share it with the Leaflet.js community? Leaflet maintains a very comprehensive document on GitHub called the Leaflet Plugin Authoring Guide.
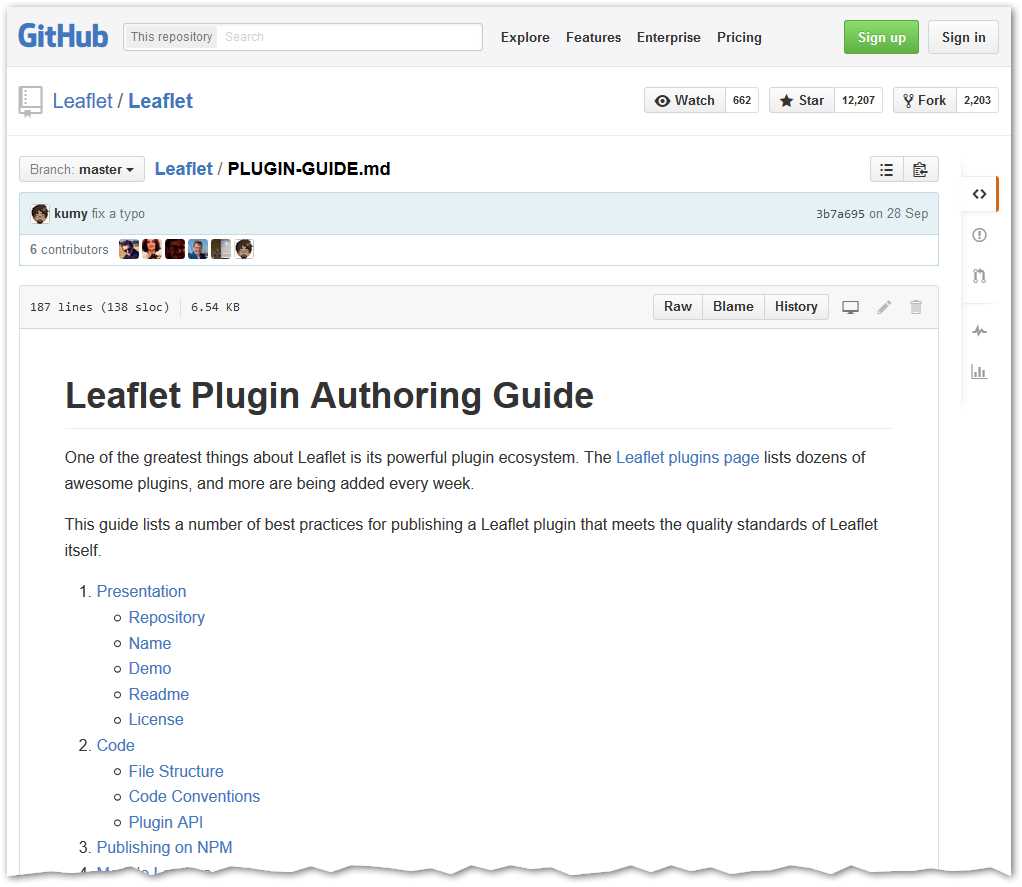
Figure 63: The Leaflet Plugin Authoring Guide
- 1800+ high-performance UI components.
- Includes popular controls such as Grid, Chart, Scheduler, and more.
- 24x5 unlimited support by developers.