
Leaflet.js Succinctly®

CHAPTER 3
Adding Overlays
In the last chapter, we made the distinction between base maps and overlays. Base maps provide a “background” for the data that forms the basis of your application, which is typically in the form of an overlay.
This data can come from anywhere. You might supply it yourself (for example, if you run a chain of bicycle stores and want your users to be able to locate the nearest one), or use data from other sources (such as demographic data from the government or from remote servers via a Web API, such as Yahoo Weather). You might even want your users to create the data themselves (for instance, if you are building an application that allows users to report graffiti in their local neighborhood).
In any event, your application data is likely to be in the form of points, lines, or polygons. This data is rendered dynamically on your map at runtime. Leaflet.js provides a number of different classes to help you do this, and in this chapter, we’re going to dive in and start using some of the more common ones.
Markers
In GIS terms, a point is the simplest spatial type, and is defined purely by its x and y coordinates. Leaflet.js has a Point class, but it’s really only used to define locations on the map in screen, rather than map coordinates. Instantiating an instance of Point(x,y) refers to a point on the screen:
var pt = L.Point(300,400);
To display a point on the map, you need to think in terms of “markers” rather than “points.” A marker is an example of what Leaflet.js refers to as a UI Layer. The Marker class accepts a LatLng object, which defines the latitude and longitude where the marker should display, and (optionally) an options object, which allows you to set various properties on the marker to specify its appearance and behavior. The following example demonstrates creating a marker and setting its title property so that it displays a tooltip when the user hovers over it with the mouse pointer. The alt property provides alternative text for screen readers:
Code Listing 12: Creating a marker with a tooltip
... var pubLatLng = L.latLng(51.757230,-1.260269); var pubMarker = L.marker(pubLatLng, { title: "The Eagle and Child: JRR Tolkien and CS Lewis supped beer here", alt: "The Eagle and Child public house" }).addTo(map); ... |

Figure 10: Marker with tooltip
To avoid creating any unnecessary variables, we can create the LatLng object on the fly, by passing in the latitude and longitude coordinates as an array:
Code Listing 13: Passing the L.latLng object into the L.marker constructor
... var pubMarker = L.marker([51.757230,-1.260269], { title: "The Eagle and Child: JRR Tolkien and CS Lewis supped beer here", alt: "The Eagle and Child public house" }).addTo(map); ... |
The Marker class has a whole bunch of different properties that you can set by specifying them in an options object. Consult the Leaflet.js documentation for a full list, but some of the more interesting ones include icon, draggable, and opacity.
Using custom marker icons
By default, Leaflet.js denotes a marker on the map with a simple blue pushpin. You can define your own custom marker icons with the L.icon class. The L.icon class has several properties that let you fine-tune the appearance of your icon, including properties for retina display, icon size, and the positioning of tooltips and shadows, but as a bare minimum, you must set the iconUrl property where the icon graphic is located:
Code Listing 14: Defining a custom icon using the L.icon class
... var pubIcon = L.icon({ iconUrl: "./images/beer.png", iconSize: [40,50] }); var pubMarker = L.marker([51.757230,-1.260269], { icon: pubIcon, title: "The Eagle and Child: JRR Tolkien and CS Lewis supped beer here", alt: "The Eagle and Child public house" }).addTo(map); ... |
![]()
Figure 11: Marker with custom icon
Making markers interactive
By default, the map marker’s clickable property is true, which means that it can respond to mouse events, including (but not limited to) click.
By setting the draggable property to true, you can allow your users to move your markers around the map. This could be handy in certain use cases, such as an asset-tracking application. But in order to be really useful, you need to figure out when a marker has been moved and where it has been moved to.
We take a look at events for map and map objects like markers in Chapter 4.
Adjusting marker transparency
You can make your marker more or less transparent by adjusting the value of the opacity property in the marker options object. The default value is 1.0 (fully opaque), and a value of 0.0 is completely transparent.
Polylines
In geospatial terms, a line is just a collection of points. To draw one on our map, we need to create an object of the PolyLine class. A PolyLine is a type of vector layer, in that Leaflet.js renders the line it describes it as vector graphics. All Leaflet.js vector graphics are derived from an abstract class called Path, which you never instantiate directly, but whose properties, methods, and events are available in subclasses.
Polylines are created from collections of LatLng pairs, so to define a PolyLine we must supply at least two such pairs: the start and end point of a line. We can add as many other pairs as we wish if we need our line to meander. If the line consists of many segments, consider using the PolyLine class smoothFactor property, which simplifies the line and makes it faster for Leaflet.js to draw. You’ll need to experiment to get the right trade-off between accuracy and performance.
You can change the appearance of the PolyLine by using properties from the parent Path class. These include color (for the color of the line) and weight (for the line width in pixels). The following example creates a line denoting an imaginary walk (or stagger?) from the Eagle and Child pub made up of five points. Note the nesting of arrays. Each point on the line is represented as a latitude/longitude pair within an array, and these point arrays are passed to the polyline constructor within a single “parent” array. The color property of the line is red, and the weight is eight pixels.
Code Listing 15: Defining a polyline
... var walkLine = L.polyline([ [51.757276, -1.260129], [51.756831, -1.260054], [51.756154, -1.259700], [51.756074, -1.259453], [51.755636, -1.259346] ], { color: "red", weight: 8 }).addTo(map); ... |
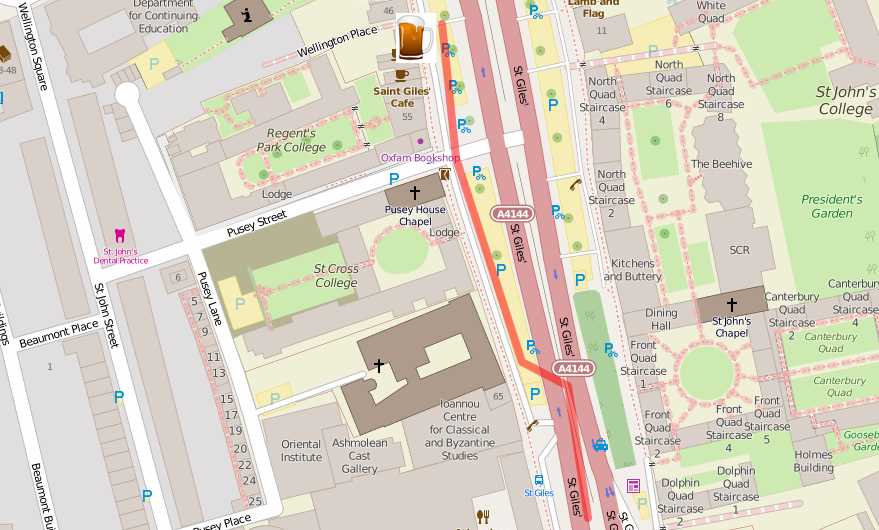
Figure 12: Polyline displayed on map
Polygons
A polygon is just a line where the start and end points are the same. You can create an object of the L.polygon class and pass in the coordinate pairs in the same way as you did for L.polyline. You don’t need to specify the end point—Leaflet.js will “close” the polygon for you. Because L.polygon is a subclass of L.path, you use the same properties color and weight to set the color and thickness of the polygon’s outline that you used for the polyline. But because you also have the area enclosed by the polygon to play with, you can use the L.path.fillColor and L.path.fillOpacity properties to determine how that inner region is rendered.
For example, the following code defines a polygon with six vertices, a blue outline, and a red fill with 50 percent transparency:
Code Listing 16: Defining a polygon
... var buildingPoly = L.polygon([ [51.756633, -1.258688], [51.756416, -1.258618], [51.756454, -1.258323], [51.756592, -1.258371], [51.756584, -1.258443], [51.756663, -1.258473] ], { color: "blue", weight: 5, fillColor: "red", fillOpacity: 0.5 }).addTo(map); ... |

Figure 13: Polygon displayed on map
Certain polygons, such as circles and rectangles, are very common in web mapping applications, often denoting geographical boundaries, and therefore, Leaflet.js provides a couple of utility classes for creating those shapes. These are, unsurprisingly, the L.circle and L.rectangle classes.
Rectangles
The L.rectangle class is a subclass of L.polygon, so you can use all of L.polygon’s properties, methods, and events, as well as those of its parent class, L.path.
To create a rectangle, instantiate an object of the L.rectangle class, providing the latitude and longitude coordinates for both the upper-left and lower-right corners as parameters. Set the outline and fill in exactly the same way as any other polygon.
Code Listing 17: Defining a rectangle
... var parkRectangle = L.rectangle([ [51.761539, -1.258820], [51.760995,-1.256974] ], { color: "red", weight: 5, fillColor:"blue" }).addTo(map); ... |
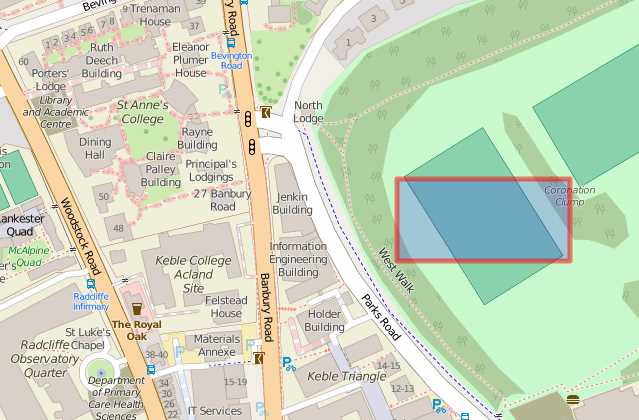
Figure 14: Rectangle displayed on map
Circles
Like L.rectangle, L.circle is subclassed from L.polygon. To create a circle, provide a latitude and longitude for the center and a radius in meters.
Code Listing 18: Defining a circle
... var areaCircle = L.circle( [51.759806, -1.264173], 100, { color: "red", weight: 5, fillColor:"green" } ).addTo(map); ... |
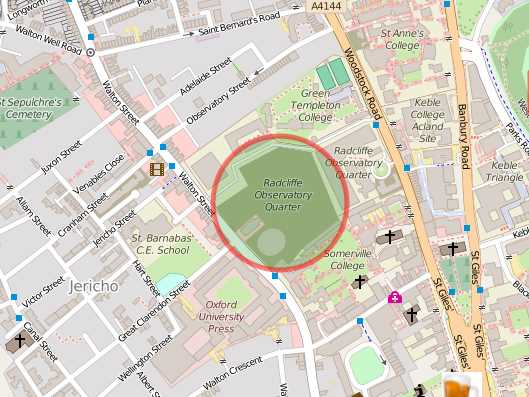
Figure 15: Circle displayed on map
Treating multiple polylines or polygons as single objects
Often when you’re building up a layer of data, you’ll want to give your users the ability to toggle all the features in that layer on or off with a single action. For that to happen, you need a way to group those features.
If the features you want to group in this way are all of the same type, and that type is either L.polyline or L.polygon, then you can use the L.multiPolyline and L.multiPolygon classes. For all intents and purposes, the way you create these objects is the same as creating individual polylines and polygons. The only difference is that you specify “sets” of latitudes and longitudes—one for each polyline or polygon. The following example uses L.multiPolygon, but you use exactly the same approach for L.multiPolyline. It also uses a layer control (which we covered in Chapter 2) that you can use to turn the overlay on or off as a whole.
Code Listing 19: Defining a multiPolygon
... function init() { var map = L.map('map').setView([51.76, -1.26],16);; // OSM Mapnik var osmLink = "<a href='http://www.openstreetmap.org'>Open StreetMap</a>"; var osm = L.tileLayer( 'http://{s}.tile.openstreetmap.org/{z}/{x}/{y}.png', { attribution: '© ' + osmLink, maxZoom: 18, }).addTo(map); var multipolygon = L.multiPolygon([ [ [51.756633, -1.258688], [51.756416, -1.258618], [51.756454, -1.258323], [51.756592, -1.258371], [51.756584, -1.258443], [51.756663, -1.258473] ], [ [51.756578, -1.259225], [51.756601, -1.259026], [51.756342, -1.258940], [51.756313, -1.259144] ] ], { color: "blue", weight: 5, fillColor: "red", fillOpacity: 0.5 }).addTo(map); var baseLayers = { "OpenStreetMap": osm }; var overlays = { "University Buildings": multipolygon, }; L.control.layers(baseLayers, overlays).addTo(map); } ... |
All the polylines and polygons within a L.multiPolyline or L.multiPolygon share the same symbology, so you’ll only want to use them to group features that are related to each other, such as town boundaries or water features.

Figure 16: L.MultiPolygon shown as discrete layer in Layer Control
Treating features of different types as a single group layer
If you want to group features of different types, such as a polygon with a set of markers, or even just a set of markers (which don’t have the equivalent of a L.multiPolyline or L.multiPolygon class), then you need to create a layer group.
Define the individual features first, but don’t add them to the map. Then create an object of L.layerGroup, passing in the variable names that you have assigned to the features that will comprise the group. Then call the layer group’s .addTo() method to add the group itself to the map instead of the individual layers.
The following example uses a layer control to demonstrate that the features within the layer group are considered as a single overlay. This gives you the ability to work with each of the features in the layer group collectively (for example, allowing your users to hide or display them all at once instead of individually).
Code Listing 20: Grouping several different features
... function init() { var map = L.map('map').setView([51.76, -1.26],16);; // OSM Mapnik var osmLink = "<a href='http://www.openstreetmap.org'>Open StreetMap</a>"; var osm = L.tileLayer( 'http://{s}.tile.openstreetmap.org/{z}/{x}/{y}.png', { attribution: '© ' + osmLink, maxZoom: 18, }).addTo(map); var pubIcon = L.icon({ iconUrl: "./images/beer.png", iconSize: [40,50] }); var pubMarker = L.marker([51.757230,-1.260269], { icon: pubIcon }); var walkLine = L.polyline([ [51.757276, -1.260129], [51.756831, -1.260054], [51.756154, -1.259700], [51.756074, -1.259453], [51.755636, -1.259346] ], { color: "red", weight: 8 }); var buildingPoly = L.polygon([ [51.756633, -1.258688], [51.756416, -1.258618], [51.756454, -1.258323], [51.756592, -1.258371], [51.756584, -1.258443], [51.756663, -1.258473] ], { color: "blue", weight: 5, fillColor: "red", fillOpacity: 0.5 }); var myLayerGroup = L.layerGroup( [ pubMarker, walkLine, buildingPoly ] ).addTo(map); var baseLayers = { "OpenStreetMap": osm }; var overlays = { "My Layer Group": myLayerGroup, }; L.control.layers(baseLayers, overlays).addTo(map); } ... |
If you want to add or remove features from the group programmatically, use the group’s .addLayer() and .removeLayer() methods, respectively:
Code Listing 21: Programmatic addition and removal of layers from the layer group
... var myLayerGroup = L.layerGroup( [ walkLine, buildingPoly ] ).addTo(map); var baseLayers = { "OpenStreetMap": osm }; var overlays = { "My Layer Group": myLayerGroup, }; L.control.layers(baseLayers, overlays).addTo(map); myLayerGroup.addLayer(pubMarker); myLayerGroup.removeLayer(walkLine); ... |

Figure 17: Layer Group with walking route removed and pub added
One thing to note about the L.layerGroup class is that it does not support popups (covered next) or mouse events. If this functionality is important to you, then use a L.featureGroup instead. The construction of a L.featureGroup object is identical to the L.layerGroup, but offers extra methods and events.
Adding popups to graphics
Now that you have all these nice graphics on your map, you’re probably looking for a way for your users to interact with them to find out what they represent. A very simple way of doing this is to use another UI layer element called a popup. You can use a popup with any of the layers we have seen so far in this chapter, and the popup can include any valid HTML. This makes popups great for displaying formatted information about a geographical feature, and also displaying links, images, and videos.
To display a popup when a user clicks on a marker, polyline, or polygon, use that object’s .bindPopup() method, pass in a string of HTML, and optionally, an options object. Valid options properties for popups include:
- .maxWidth, .minWidth, .maxHeight: To control the size of the popup
- .keepInView: Set to true to keep the popup in view if the user pans the screen away from the feature in question
- .closeButton: Set to false if you don’t want a close button to appear in the popup
- .closeOnClick: Set to false if you don’t want the user to be able to close the popup by clicking on the map
- .zoomAnimation: Whether the popup should be animated when the user zooms in (true by default)
Code Listing 22: Binding a popup to the polyline
... var walkLine = L.polyline([ [51.757276, -1.260129], [51.756831, -1.260054], [51.756154, -1.259700], [51.756074, -1.259453], [51.755636, -1.259346] ], { color: "red", weight: 8 }).bindPopup("Our route"); ... |
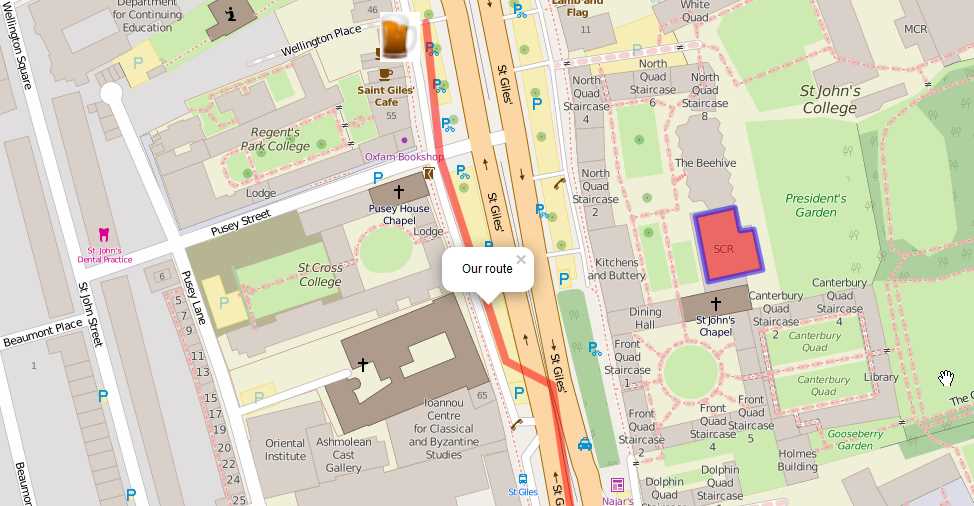
Figure 18: Clicking on the route polyline displays a popup
To have all the features in a feature group display a popup when clicked, create a L.featureGroup object and call its .bindPopup() method. The following example demonstrates adding HTML content to the popup contents. Every feature in the feature group displays exactly the same details, including a link to the Wikipedia entry for Oxford:
Code Listing 23: Binding a popup to a feature group
... var popupContent = "<h2>Walking Tour of Oxford</h2>" + "<p>Lots of <b>cool things</b> to see in " + "<a href='https://en.wikipedia.org/wiki/Oxford'>Oxford</a>"; var myFeatureGroup = L.featureGroup( [ pubMarker, walkLine, buildingPoly ] ).bindPopup(popupContent).addTo(map); ... |

Figure 19: Popup for feature group with HTML formatted contents
You can enable popups on L.multiLine and L.multiPolyline features in exactly the same way:
Code Listing 24: Binding a popup to a L.multiPolygon
... var multipolygon = L.multiPolygon([ [ [51.756633, -1.258688], [51.756416, -1.258618], [51.756454, -1.258323], [51.756592, -1.258371], [51.756584, -1.258443], [51.756663, -1.258473] ], [ [51.756578, -1.259225], [51.756601, -1.259026], [51.756342, -1.258940], [51.756313, -1.259144] ] ], { color: "blue", weight: 5, fillColor: "red", fillOpacity: 0.5 }).bindPopup("This is a multipolygon").addTo(map); ... |

Figure 20: Each polygon in the L.multiPolygon displays the same popup
The Map Draw utility
Because it can be a pain trying to discover the coordinates for the locations and geometries you want to represent in your Leaflet.js applications, I have written a simple tool that you can access here.
To use the tool, zoom in to the location in which you want to create features, and then use the draw toolbar on the left-hand side of the map and follow the instructions to create the desired geometry. The Leaflet.js code to create that geometry will appear in the left-hand pane. Click Copy to Clipboard and the code is ready to be pasted into your editor or IDE of choice.
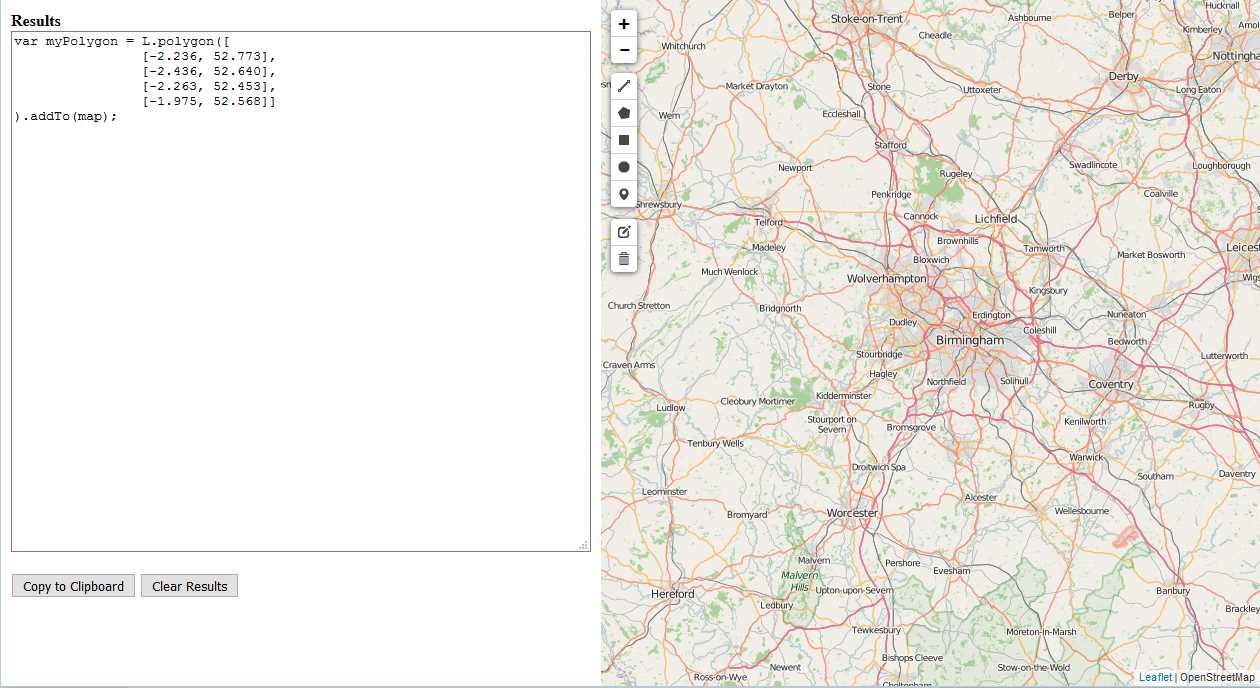
Figure 21: The Map Draw utility
GeoJSON
If you know your JavaScript, then you have doubtless heard of JSON. JSON stands for JavaScript Object Notation, and it’s the syntax you use to specify object literals in JavaScript. In recent years, JSON has outgrown JavaScript, and is now used as a human-readable lightweight data interchange format, often in preference to XML, which is seen as heavyweight by comparison, and more difficult to interpret by human readers.
For example, the following JSON example defines a “takeaways” object, which comprises an array of three objects representing individual takeout restaurants and the types of cuisine they offer:
Code Listing 25: "Standard" JSON describing takeaway restaurants
{"takeaways":[ {"name":"Aziz", "cuisine":"Indian"}, {"name":"Dak Bo", "cuisine":"Chinese"}, {"name":"Luigi's", "cuisine":"Italian"} ]} |
GeoJSON is an extension of standard JSON that allows you to describe geometries. You can specify points, lines, and polygons using GeoJSON, and you can group those geometries into multipoints, multilines, and multipolygons.
Note: You can view the full GeoJSON specification here.
GeoJSON is a real boon to web map developers like us, because it provides a convenient way of describing geospatial features—their geometries and attributes—in a highly portable way.
Adding GeoJSON to the map
The simplest way to add GeoJSON to your Leaflet.js map is to hardcode it as a JavaScript variable and then add it using an instance of the L.geoJson class. If we take our initial JSON, we can turn it into GeoJSON by adding adding type, geometry and properties objects to each of our takeaway objects:
Code Listing 26: Takeaways represented in GeoJSON format
var geoJSON = [{ "type": "Feature", "geometry": { "type": "Point", "coordinates": [-1.155, 51.896] }, "properties": { "name": "Aziz", "cuisine": "Indian" } }, { "type": "Feature", "geometry": { "type": "Point", "coordinates": [-1.150, 51.897] }, "properties": { "name": "Dak Bo", "cuisine": "Chinese" } }, { "type": "Feature", "geometry": { "type": "Point", "coordinates": [-1.153, 51.897] }, "properties": { "name": "Luigi's", "cuisine": "Italian" } }]; |
Note: GeoJSON requires that points are specified in the order of
[longitude, latitude] rather than the [latitude, longitude] that Leaflet.js expects.
We can then use the L.geoJson layer type to add this geoJson to our map just like any other layer:
Code Listing 27: Adding GeoJSON to the map
var geoJSON = [{ "type": "Feature", "geometry": {…}, "properties": {…} }, { "type": "Feature", "geometry": {…}, "properties": {…} }, { "type": "Feature", "geometry": {…}, "properties": {…} }]; var geoJSONLayer = L.geoJson(geoJSON).addTo(map); |
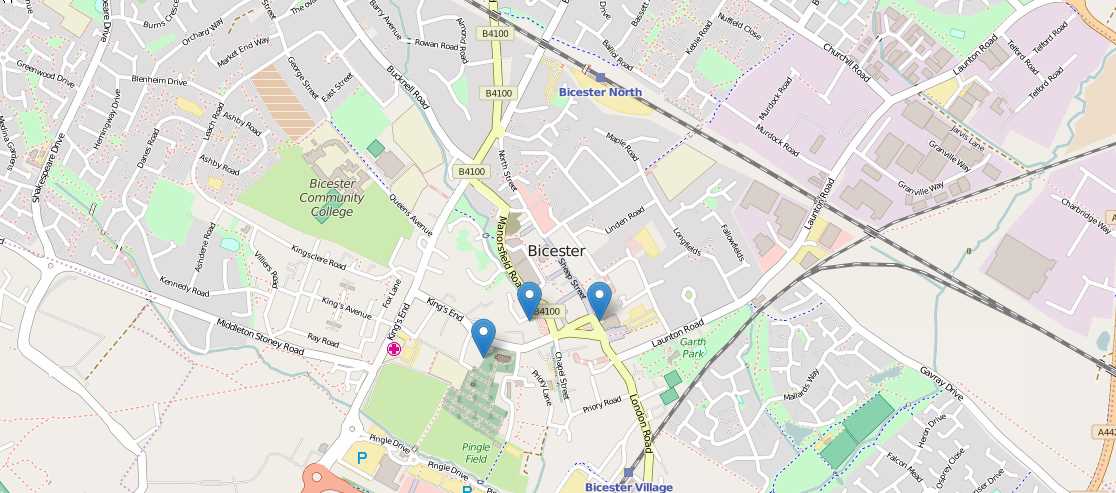
Figure 22: GeoJSON data displayed on the map
We can mix points, lines, and polygons in GeoJSON, too. Consider the following GeoJSON:
Code Listing 28: Mixing different geometries in GeoJSON
var geoJSON = [{ "type": "Feature", "geometry": { "type": "Point", "coordinates": [-1.145, 51.898] }, "properties": { "name": "My Point", "title": "This is a point" } }, { "type": "Feature", "geometry": { "type": "LineString", "coordinates": [ [-1.161, 51.904], [-1.159, 51.909], [-1.157, 51.903], [-1.149, 51.905], [-1.144, 51.904] ] }, "properties": { "name": "My LineString", "title": "This is a polyline" } }, { "type": "Feature", "geometry": { "type": "Polygon", "coordinates": [ [ [-1.176, 51.905], [-1.176, 51.902], [-1.165, 51.899], [-1.163, 51.902] ] ] }, "properties": { "name": "My Polygon", "title": "This is a polygon" } }]; var geoJSONLayer = L.geoJson(geoJSON).addTo(map); |

Figure 23: Mixed GeoJSON geometries displayed on the map
Note: GeoJSON polygon coordinates are encoded with one more level of nested arrays than we have seen in previous examples. This is to allow for the creation of “rings”—polygons within polygons. Using rings, you can create polygons with “holes” (think of the shape of a donut). The L.polygon class also allows you to specify polygon geometries in this way.
Rendering GeoJSON: polylines and polygons
You’ll note from the previous two examples that Leaflet.js has provided default symbology for our GeoJSON. Usually you’ll want to specify this yourself.
You can control the symbology of geoJSON polylines or polygons either by specifying a style property in an options object that you pass to the L.geoJson constructor as its second argument, or by calling the layer’s setStyle() method. Generally speaking, you use the first method (setting the style in the constructor) to specify an initial style for when the layer first displays, and the second method (calling setStyle()) to programmatically change the symbology later on, perhaps in response to a user action, such as hovering over a feature with the mouse. We’ll talk about responding to events in the next chapter.
Let’s look at the first method: adding a style property within the options object. The value of the style property is a function that gets called when the features are loaded and can optionally be used to symbolize based on one of that feature’s attributes. In this example we are symbolizing based on the value of the name property:
Code Listing 29: Symbolizing GeoJSON based on feature properties
... var geoJSONLayer = L.geoJson(geoJSON, { style: function(feature) { switch(feature.properties.name) { case 'My LineString': return { color: "#F115CA", weight: 8 } break; case 'My Polygon': return { color: "red", fillColor: "#488D52", fillOpacity: 0.5 } break; } } }).addTo(map); ... |
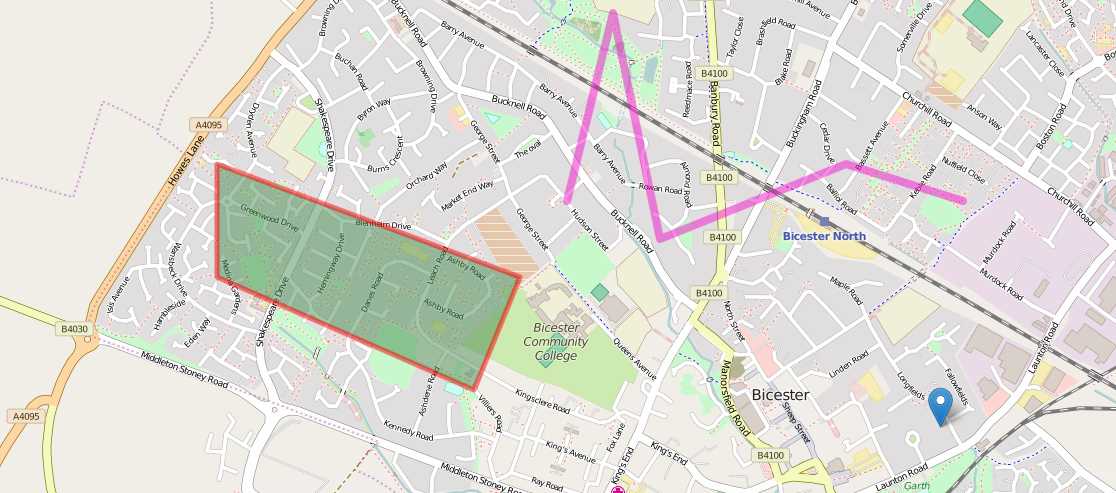
Figure 24: The GeoJSON polyline and polygon symbolized by name
If we wanted to style either multiple polylines or polygons exactly the same way without considering any differences between them, we would just define our symbology and pass it directly to the style property in the options object. The following example demonstrates setting an identical symbology for two different polygons:
Code Listing 30: Styline two different polygons identically:
... var schoolSymbol = { "color": "#CE4A93", "weight": 5, "fillColor": "#FF002B", "fillOpacity": 0.65 }; var schoolsGeoJSON = [{ "type": "Feature", "geometry": { "type": "Polygon", "coordinates": [ [ [-1.173, 51.907], [-1.174, 51.906], [-1.173, 51.905], [-1.173, 51.905], [-1.172, 51.905], [-1.172, 51.905], [-1.173, 51.905], [-1.172, 51.906] ] ] } }, { "type": "Feature", "geometry": { "type": "Polygon", "coordinates": [ [ [-1.163, 51.902], [-1.164, 51.901], [-1.164, 51.901], [-1.165, 51.900], [-1.159, 51.899], [-1.158, 51.899], [-1.158, 51.899], [-1.158, 51.900], [-1.158, 51.900], [-1.158, 51.900], [-1.162, 51.902] ] ] } }]; var geoJSONLayer = L.geoJson(schoolsGeoJSON, { style: schoolSymbol }).addTo(map); ... |
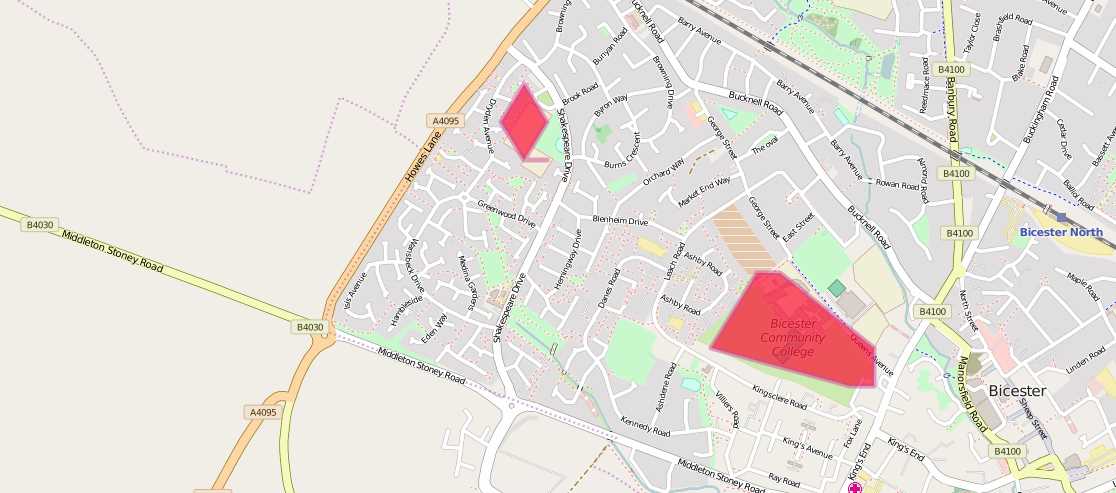
Figure 25: Two different polygons sharing the same symbology
If you want to perform other actions on each feature before it’s loaded, add a property to the options object in the constructor called onEachFeature(). This property exists on points as well as lines and polygons. Its value is a function that receives a feature and the layer it came from. This can be really useful if, for example, you want to bind a popup to each feature based on its properties:
Code Listing 31: Displaying popups on all features using onEachFeature()
... var geoJSONLayer = L.geoJson(geoJSON, { style: function(feature) { switch(feature.properties.name) { case 'My LineString': return { color: "#F115CA", weight: 8 } break; case 'My Polygon': return { color: "red", fillColor: "#488D52", fillOpacity: 0.5 } break; } }, onEachFeature: function(feature, layer) { layer.bindPopup(feature.properties.name); } }).addTo(map); ... |
Rendering GeoJSON: points
Because L.polyline and L.polyline both inherit from L.path, they can both be styled in the same way. Markers, representing GeoJSON point features, need to be treated differently. Instead of using the style property of the options object, we use the pointToLayer property. Going back to our takeaway restaurants, we can demonstrate this in the following example, where we symbolize markers depending on the type of cuisine available at each. We also take the opportunity to bind a popup to each marker so we can display the name of the restaurant it represents:
Code Listing 32: Symbolizing markers by GeoJSON properties
... var indianIcon = L.icon({ iconUrl: 'images/India.png', iconSize: [48, 48], }); var chineseIcon = L.icon({ iconUrl: 'images/China.png', iconSize: [48, 48], }); var italianIcon = L.icon({ iconUrl: 'images/Italy.png', iconSize: [48, 48], }); var indian, chinese, italian; var geoJSONLayer = L.geoJson(geoJSON, { pointToLayer: function(feature, latlng) { switch(feature.properties.cuisine) { case 'Indian': indian = L.marker(latlng, { icon: indianIcon }).bindPopup(feature.properties.name); return indian; break; case 'Chinese': chinese = L.marker(latlng, { icon: chineseIcon }).bindPopup(feature.properties.name); return chinese; break; case 'Italian': italian = L.marker(latlng, { icon: italianIcon }).bindPopup(feature.properties.name); return italian; break; } } }).addTo(map); ... |
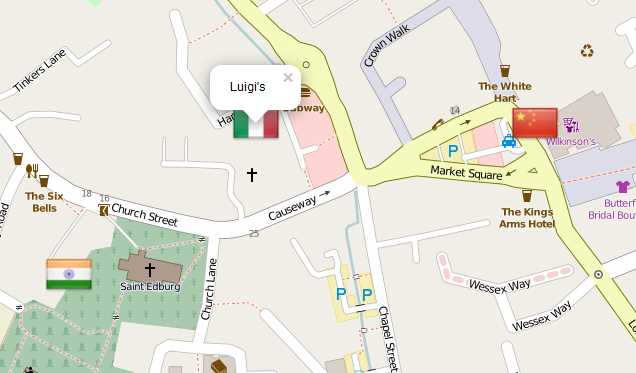
Figure 26: Takeaways symbolized by cuisine
Filtering GeoJSON
Sometimes it can be useful to filter the data within GeoJSON. Perhaps the GeoJSON comes from an external source and we are only interested in particular features. We might even extend this ability to our users and build an application that allows them to choose which features to display.
Just use the filter property in an options object and give it a function that tests the values passed to it for whatever your criteria are. Return true to display features and false to hide them. In this example, we have decided that we don’t want Italian food tonight (we stuffed ourselves full of pizza last night):
Code Listing 33: Filtering GeoJSON based on feature attributes
... var indian, chinese, italian; var geoJSONLayer = L.geoJson(geoJSON, { pointToLayer: function(feature, latlng) { switch(feature.properties.cuisine) { case 'Indian': indian = L.marker(latlng, { icon: indianIcon }).bindPopup(feature.properties.name); return indian; break; case 'Chinese': chinese = L.marker(latlng, { icon: chineseIcon }).bindPopup(feature.properties.name); return chinese; break; case 'Italian': italian = L.marker(latlng, { icon: italianIcon }).bindPopup(feature.properties.name); return italian; break; } }, filter: function(feature, latlng) { switch(feature.properties.cuisine) { case 'Indian': return true; break; case 'Chinese': return true; break; case 'Italian': return false; break; } } }).addTo(map); ... |
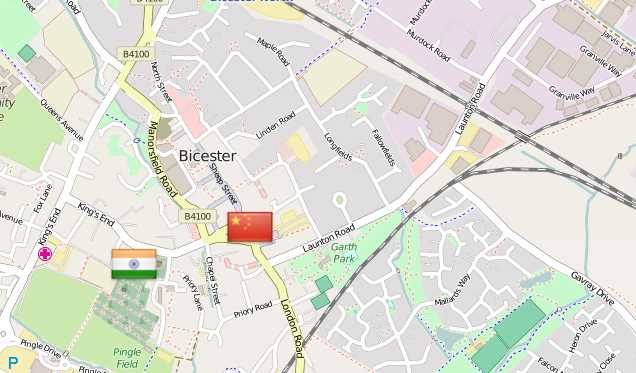
Figure 27: We don't fancy Italian food tonight
- 1800+ high-performance UI components.
- Includes popular controls such as Grid, Chart, Scheduler, and more.
- 24x5 unlimited support by developers.