
Leaflet.js Succinctly®

CHAPTER 5
Accessing External Data Sources
So far we’ve seen how to add data by hardcoding it into our mapping applications. If you’re building anything that’s not completely trivial, then that approach is just not going to cut it. Nobody wants to create marker code for 10,000 different locations! And we haven’t even discussed the possibility that a user might want to change data via your application.
Thankfully, there are many different ways of getting data into your Leaflet.js applications. In this chapter, we look at a few of the most popular techniques you can use.
Accessing data in a database
Databases are the go-to platform for storing data of any description, so let’s consider how we can store and retrieve data with a spatial component for use in our web maps.
We have been creating client-side applications that run on the browser. Browser-based applications don’t typically access database data directly. They either involve some server-side code, or some sort of middleware—normally a web service of some description—which accesses the database and makes it available to the page.
One of the most common methods of building database-driven web applications is to use PHP for the server-side scripting and MySQL as the back-end database. Both have been around for a long time and are freely available, so even though there are newer, fancier platforms available, we’ll stick with PHP and MySQL for our first example.
The database
You can download MySQL directly from Oracle’s website, or, as I have done, use a “friendlier” package to do the installation and configuration for you. These are bundled programs with some sort of administration GUI that bundle the installation of a LAMP stack (Linux, Apache, MySQL, and PHP). Although Linux is a popular choice for hosting web servers, for development purposes you’ll often want to install a Windows or Mac-specific flavor of the LAMP stack. As I mentioned in Chapter 1, I use XAMPP for this. You need to ensure that the MySQL service is running.
In my environment, I have MySQL running and listening to requests on the default port (3306):
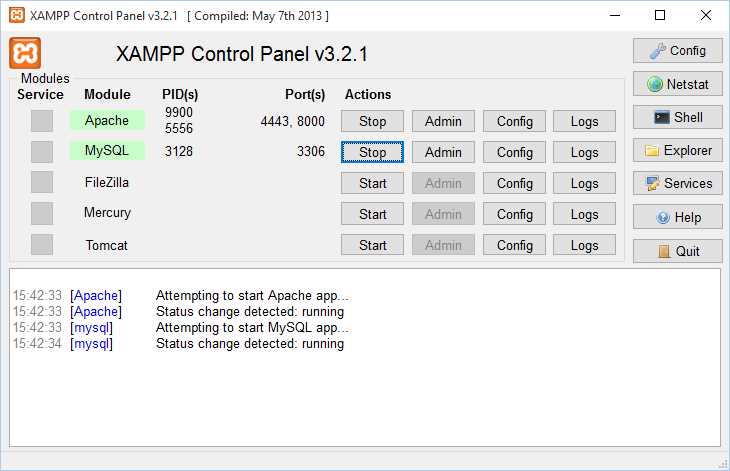
Figure 39: XAMPP control panel showing the MySQL service running
Now that I’ve got a running database server, I need to create a database and populate it with some data I can then consume within my Leaflet.js application. XAMPP bundles a graphical user interface to MySQL called myPhpAdmin, but I like working at the command line, so that’s what I’ll demonstrate here.
First, I need to log into the MySQL server. I can do this from the Shell button in the XAMPP Control Panel, or I could add the MySQL binaries to my PATH and access it from the standard terminal. XAMPP configures MySQL with a root account, but no password, so let’s give the root user a password of leaflet.
# mysqladmin.exe –u root password leaflet
For this example, I’m going to use the locations of various coffee shops around the United States. I have created a “dump” file called CoffeeShops.sql, which I have included within the ch05_consumingdata folder in this book’s source code (see Chapter 1 for details of where to download this file from). If you execute the following command at the terminal prompt, it will create and populate the leafletDB database from the coffee.csv file (also provided):
# mysql –uroot –pleaflet < "C:\CoffeeShops.sql";
Note: The ‘#’ character represents the command prompt. Do not enter it as part of the statement.
Once this process is complete, verify that the CoffeeShops table contains records by executing the following commands at the terminal prompt:
Code Listing 40: Verifying that the coffee shop data is in the database
# mysql -uroot -pleaflet Warning: Using a password on the command line interface can be insecure. Welcome to the MySQL monitor. Commands end with ; or \g. Your MySQL connection id is 151 Server version: 5.6.26 MySQL Community Server (GPL) Copyright (c) 2000, 2015, Oracle and/or its affiliates. All rights reserved. Oracle is a registered trademark of Oracle Corporation and/or its affiliates. Other names may be trademarks of their respective owners. Type 'help;' or '\h' for help. Type '\c' to clear the current input statement. mysql> USE leafletDB; Database changed mysql> SHOW TABLES; +---------------------+ | Tables_in_leafletdb | +---------------------+ | coffeeshops | +---------------------+ 1 row in set (0.00 sec) mysql> SELECT COUNT(*) FROM coffeeshops; +----------+ | COUNT(*) | +----------+ | 7664 | +----------+ 1 row in set (0.00 sec) mysql> |
The server-side code
That’s the database end of things; now we need some server-side code to access the database and return results in a format suitable for our client application to read. I’m going to code this in PHP, using PHP Data Objects (PDO) to handle the interaction with the database. The code for this is either incredibly simple or really obtuse, depending on whether or not you know PHP.
Here’s the code, which I’m saving in a file called coffee.php in the same directory I’ll use to create the HTML page that will display the map.
Code Listing 41: The server-side PHP code that reads the database
# mysql -uroot -pleaflet <?php $db = new PDO("mysql:host=localhost;dbname=leafletDB", "root", "leaflet"); $sql = "SELECT * FROM CoffeeShops WHERE City='Boston'"; $rs = $db->query($sql); if (!$rs) { echo "An SQL error occured.\n"; exit; } $rows = array(); while($r = $rs->fetch(PDO::FETCH_ASSOC)) { $rows[] = $r; } print json_encode($rows); $db = NULL; ?> |
Here’s how this code works:
$db = new PDO("mysql:host=localhost;dbname=leafletDB", "root", "leaflet");
This line provides the connection to the database.
$sql = "SELECT * FROM CoffeeShops WHERE City='Boston'";
$rs = $db->query($sql);
if (!$rs) {
echo "An SQL error occured.\n";
exit;
}
This code issues a query looking for all the coffee shops in the Boston area (there are a lot of coffee shops in our database, so let’s focus in on a specific area) and checks to see if any records are returned. If not, it reports an error and quits.
$rows = array();
while($r = $rs->fetch(PDO::FETCH_ASSOC)) {
$rows[] = $r;
}
This code fetches each row in the result set into an associative array.
print json_encode($rows);
This line of code prints the entire record set in JSON (JavaScript Object Notation). JSON is a lightweight data interchange format that is ideal for our client application to process. If you launch the coffee.php file in the browser, then you will see what this looks like:
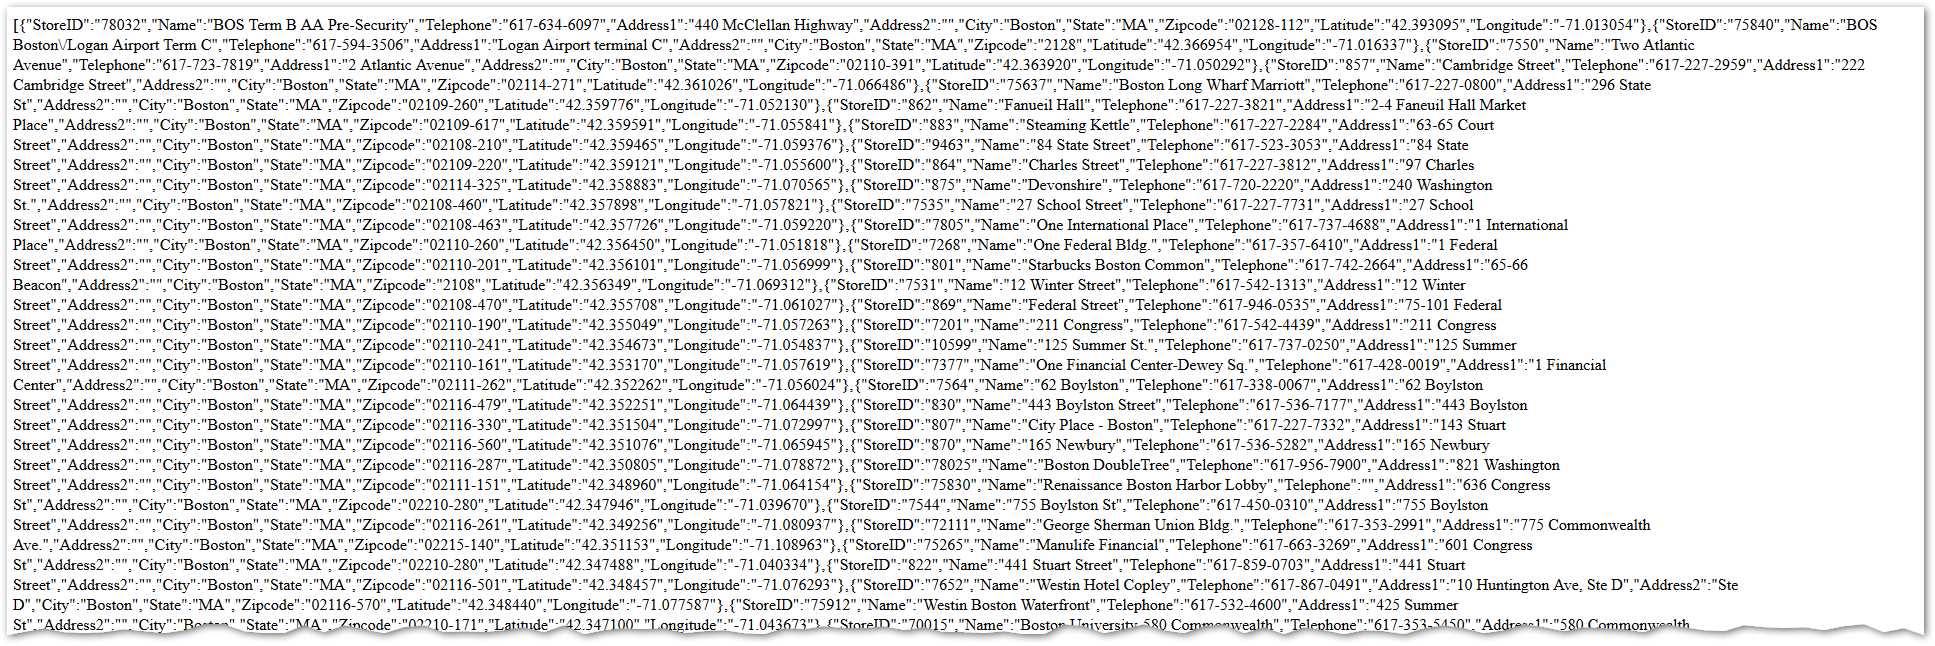
Figure 40: The database data in JSON format
It might look like a load of garbled nonsense to you. Even though JSON is a recognized data interchange format in its own right, its roots are in JavaScript, where it is the syntax used to create a JavaScript object literal. Yes, that thing is just one great big JavaScript object, which makes it trivial to bring into our client application.
The line of PHP code that performs the magic of taking a result set from a database and converting it into JSON that can be streamed into our web page is this:
print json_encode($rows);
This sort of capability is not unique to PHP. With JSON fast eclipsing XML as the preferred way of slinging data around in a web environment, other server-side scripting languages, such as Ruby, VBScript, Perl, and C# have equivalent functionality.
The client application
We need a way for our web page to access the JSON data returned by coffee.php. The best way to do this is asynchronously so that we don’t have to hold up our users by refreshing the page.
To achieve this, we need our web page to make an AJAX request to the coffee.php script. AJAX stands for Asynchronous JavaScript and XML. Wait a minute…XML?
Well, when the AJAX technique first surfaced, XML was the preferred data interchange format. But now JSON is preferred, so technically, AJAX should now really be called AJAJ. But AJAX as an acronym is ubiquitous regardless of the fact that, more often than not, JSON is the preferred format. Plus, it’s easier to say.
Now, there are ways of achieving this in vanilla JavaScript using XMLHttpRequest, but they are pretty ugly. A much nicer, cleaner way of working with AJAX is to use JQuery. JQuery is a JavaScript framework that builds upon basic JavaScript to make certain tasks easier for developers. And AJAX is one of those tasks. If you want to learn more about JQuery (and you really should) check out Succinctly JQuery, by Cody Lindley.
In order to access JQuery, you must reference it in a <script> tag in your page, whether that points to a local version of the framework, or one hosted by a CDN (Content Delivery Network). Both Microsoft and Google make JQuery available via CDN, so I’m just going to reference Microsoft’s (because Google gets all the love these days).
Here’s the starting code for our client application. I have highlighted the <script> tag that references the JQuery CDN:
Code Listing 42: Client application, referencing the JQuery framework via a CDN
<!DOCTYPE html> <html> <head> <title>My Leaflet.js Map</title> <link rel="stylesheet" href="http://cdnjs.cloudflare.com/ajax/libs/leaflet/0.7.3/leaflet.css" /> <script src="http://ajax.aspnetcdn.com/ajax/jQuery/jquery-1.11.3.min.js"></script> <script src="http://cdnjs.cloudflare.com/ajax/libs/leaflet/0.7.3/leaflet.js"> </script> <style> html, body, #map { height: 100%; } </style> <script type="text/javascript"> function init() { var map = L.map('map').setView([42.362, -71.085], 13); // OSM Mapnik var osmLink = "<a href='http://www.openstreetmap.org'>Open StreetMap</a>"; L.tileLayer( 'http://{s}.tile.openstreetmap.org/{z}/{x}/{y}.png', { attribution: '© ' + osmLink, maxZoom: 18 }).addTo(map);
showCoffeeShops(map); }
function showCoffeeShops(map) {
// Retrieve and display coffee shop data
} </script> </head> <body onload="init()"> <div id="map"></div> </body> </html> |
You can see from the code in Code Listing 43 that we have built a very simple mapping application with an OSM Mapnik base layer. The init() function creates the map, adds the layer, and then calls the showCoffeeShops() function, which is where we turn our attention to next.
Code Listing 43: The completed showCoffeeShops() function
... function showCoffeeShops(map) { var mugIcon = L.icon({ iconUrl: "./images/mug.png", iconSize: [25,25] }); $.getJSON("coffee.php", function(data) { for (var i = 0; i < data.length; i++) { var location = new L.LatLng(data[i].Latitude, data[i].Longitude); var name = data[i].Name; var addr1 = data[i].Address1; if(data[i].Address2.length > 1) { addr2 = data[i].Address2 + "</br>"; } else { addr2 = ""; } var cityzip = data[i].City + ", " + data[i].Zip; var visits = data[i].Visits; var marker = new L.Marker(location, { icon: mugIcon, title: name }); var content = "<h2>" + name + "</h2>" + "<p>" + addr1 + "</br>" + addr2 + cityzip + "</p>" + "<p>Visits: <b>" + visits + "</b></p>"; marker.bindPopup(content, { maxWidth: '200' }); marker.addTo(map); } }); } ... |
Let’s have a look at the important bits.
First, let’s take a look at the call to the JQuery function getJson(). The getJson() function is a wrapper around JQuery’s ajax() function, with the dataType option set to json. This accesses our coffee.php script asynchronously and passes its output (the JSON representation of our CoffeeShops table in MySQL) into a callback as the parameter data. We then iterate through that data to access the individual result:
$.getJSON("coffee.php", function(data) {
for (var i = 0; i < data.length; i++) {
…
}
});
The next several lines just pull out the column values from each row in the result set. About the only thing we’re doing with these values is formatting them for later display in a popup. So, for example, if the Address2 field is blank, we’re leaving it out so as not to have a big gap in our popup content. We’re also concatenating the City and Zip column values so that they display on the same line:
var location = new L.LatLng(data[i].Latitude, data[i].Longitude);
var name = data[i].Name;
var addr1 = data[i].Address1;
if(data[i].Address2.length > 1) {
addr2 = data[i].Address2 + "</br>";
} else {
addr2 = "";
}
var cityzip = data[i].City + ", " + data[i].Zip;
var visits = data[i].Visits;
Finally, we’re creating a marker for each record from the Latitude and Longitude column values, and binding a popup to display the other data we have gathered:
var marker = new L.Marker(location, {
icon: mugIcon,
title: name
});
var content = "<h2>" + name + "</h2>"
+ "<p>" + addr1 + "</br>" + addr2
+ cityzip + "</p>"
+ "<p>Visits: <b>" + visits + "</b></p>";
marker.bindPopup(content, {
maxWidth: '200'
});
marker.addTo(map);
Note that we have also created a custom icon called mugIcon to show each location as a coffee cup on the map:

Figure 41: The finished application
Mashing up data with an API
Another way we can get ahold of data is by using a third-party API. This technique is what the cool kids refer to as creating a “mashup.”
The number of APIs that you can access freely or via a paid subscription is phenomenal: just check out this website for inspiration. Many of these provide location data, and for those that don’t (such as the Twitter APIs), it’s pretty easy to geocode any content with place names. We’ll have a look at geocoding in Chapter 6.
For now, let’s use an API that does store location data when it’s available, and one such API is Flickr Photo Search. Our task for this exercise is to create an application centered on the city of London in England, and display any Flickr photos that have been geotagged as being taken there.
In order to access the Flickr Photo Search API, we first need to specify what sort of information we want the API to return to us. Once we’ve done that, we get a URL consisting of various query parameters that specifies the request our application will make of the Flickr service.
First, visit the Flickr API App Garden page, just to get an idea of the huge range of APIs available from just this single provider. Then, click on the flickr.photos.search link.
This will take you to a page with a form where you need to specify the information you want the Flick Photo Search API to return to you. Make the following entries in the form:
- Set the text field to London. We’re looking for all photos with “London” in the description somewhere.
- Set the has_geo field to 1. This will return only photos with spatial coordinates.
- Set the extras field to geo, url_s. These two options return the spatial data and a small thumbnail of each image. We’ll use the first to plot the location as a marker on the map and the second to display in that marker’s popup.
- Finally, set the Output option at the bottom of the page to JSON. We like JSON.
- Leave all the other options alone.
Once you have entered all this information, click the Call Method… button. If everything works correctly, you should see a sample output and below it, a scary-looking custom URL you will need to paste into the application we are about to build.

Figure 42: Successful configuration of the Flickr Photo Search API
So here is our starting point. We have a map centered on London with OSM Mapnik as a base layer, and we’re calling a function called showPhotos(), where we are going to work our Flickr magic.
Code Listing 44: The starting point for our Flickr API application
<!DOCTYPE html> <html> <head> <title>My Leaflet.js Map</title> <link rel="stylesheet" href="http://cdnjs.cloudflare.com/ajax/libs/leaflet/0.7.3/leaflet.css" /> <script src="http://cdnjs.cloudflare.com/ajax/libs/leaflet/0.7.3/leaflet.js"></script> <script src="js/leaflet-layerjson.min.js"></script> </script> <style> html, body, #map { height: 100%; } </style> <script type="text/javascript"> function init() { var map = L.map('map').setView([51.505, -0.106],14); // OSM Mapnik var osmLink = "<a href='http://www.openstreetmap.org'>Open StreetMap</a>"; L.tileLayer( 'http://{s}.tile.openstreetmap.org/{z}/{x}/{y}.png', { attribution: '© ' + osmLink, maxZoom: 18 }).addTo(map); showPhotos(map); } function showPhotos(map) {
// Display Flickr photos } </script> </head> <body onload="init()"> <div id="map"></div> </body> </html> |
All is not quite the same as before in our MySQL example, however. In that example, we used JQuery to make our AJAX call to a PHP script that returned JSON data from the contents of a table in a database. In this example, we’re going to use a Leaflet.js plug-in to make the AJAX request and handle the response.
Plugins are part of what makes Leaflet.js really cool. The Leaflet.js framework itself is tiny and extremely robust, and it has stayed that way because the maintainers only include core functionality in the framework. However, there is a rich base of community-developed plugins that extend Leaflet in many exciting ways. We’ll have a look at other plugins in the next two chapters, but in this example we’re going to use a plugin called leaflet-layerJSON, created by Stefano Cudini. See the project’s GitHub page for more information.
The great thing about this plugin is that it will read the JSON data coming from the Flickr Photo Search API and automatically create markers and their associated popups from the data it returns. How cool is that?
Start by downloading the latest release from the releases tab on the leaflet-layer-JSON project page:
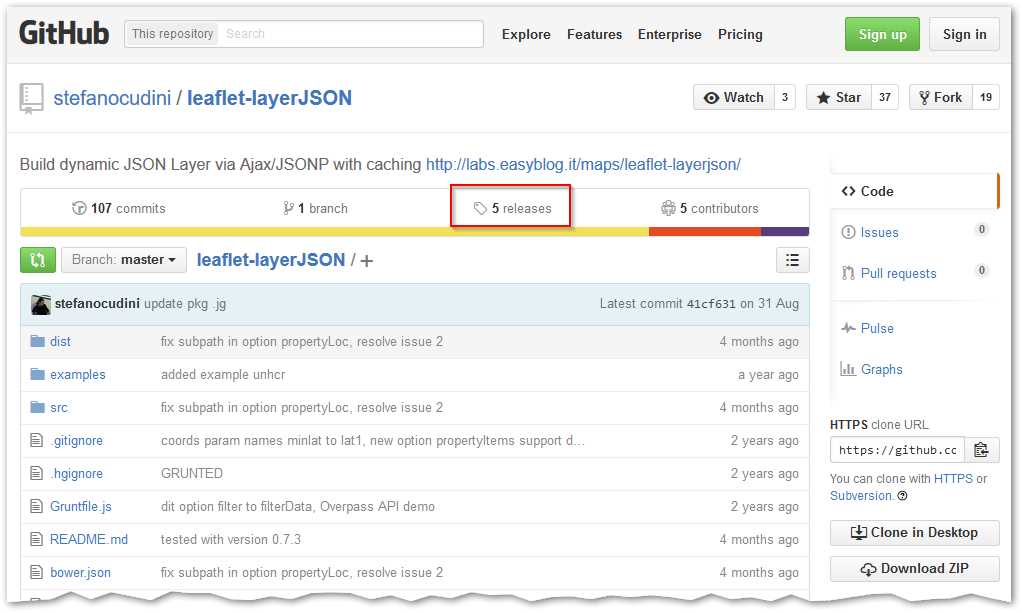
Figure 43: The leaflet-layerJSON project page on GitHub
This will give you a zip file that contains all the source code and build files for leaflet-layerJSON. There’s a lot of stuff in there, but we only need the minified JavaScript file, which you can find in the zip file’s dist folder. Create a folder in the same directory as your HTML page called js, and put the leaflet-layerjson.min.js file in there. Then, make sure you include a reference to that file in a <script> tag, as shown in Code Listing 45.
This is how it looks in Windows Explorer on my PC:
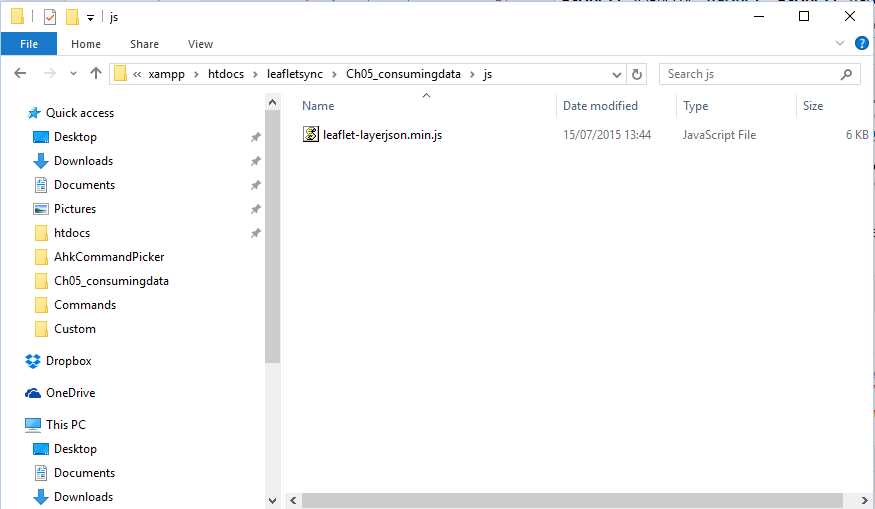
Figure 44: Location of the leaflet-layerJSON plugin
Now we can write the code for our showPhotos() function, as shown in Code Listing 45. Notice that I have used placeholders for the Flickr API and signature values. These are specific to the Photo Search API URL Flickr generated for you earlier.
Code Listing 45: Completing the showPhotos() function
... function showPhotos(map) { var url1 = "https://api.flickr.com/services/rest/?method=flickr.photos.search"; var url2 = "&api_key=[your value]"; var url3 = "&text=London&has_geo=1&extras=geo%2C+url_s" var url4 = "&per_page=100&format=json&nojsoncallback=1" var url5 = "&api_sig=[your value]" var popupContent = function(data,markers) { return "<strong>" + data.title + "</strong><br><img src='" + data.url_s+"'>"|| null; }; jsonLayer = new L.LayerJSON({ url: url1 + url2 + url3 + url4 + url5, propertyItems: 'photos.photo', propertyLoc: ['latitude','longitude'], buildPopup: popupContent }); map.addLayer(jsonLayer); } ... |
I have split the long URL provided by the Flickr Photo Search API into several different strings, just so you can see what it consists of.
var url1 = "https://api.flickr.com/services/rest/?method=flickr.photos.search";
var url2 = "&api_key=[api key value]";
var url3 = "&text=London&has_geo=1&extras=geo%2C+url_s"
var url4 = "&per_page=100&format=json&nojsoncallback=1"
var url5 = "&api_sig=[api sig value]"
Next, I created a popupContent variable that contains a function. This function will create the content of the popups that the L.LayerJSON object (provided by leaflet-layerJSON) will render for us. Note how I am including the title and url_s properties that we requested when we created the API URL in the flickr.photos.search page. These correspond to the title of any photos returned by the API and a small thumbnail image, respectively.
var popupContent = function(data,markers) {
return "<strong>"
+ data.title
+ "</strong><br><img src='"
+ data.url_s+"'>"|| null;
};
What follows is our call to the Flickr Photo Search API, neatly handled by the L.LayerJSON object in the leaflet-layerJSON plugin. The propertyItems property is the element in the JSON that stores the data we’re interested in. The propertyLoc property returns the fields in the JSON that contain coordinate data, and the buildPopup property uses the function we stored in the popupContent variable to create the popup contents:
jsonLayer = new L.LayerJSON({
url: url1 + url2 + url3 + url4 + url5,
propertyItems: 'photos.photo',
propertyLoc: ['latitude','longitude'],
buildPopup: popupContent
});
Once we have instantiated the L.LayerJSON object, we can add it to our map in the normal way using map.addLayer(jsonLayer).
Let’s run the application and click on a few markers. Note that this is a live feed, so your results will probably be significantly different from mine:

Figure 45: The Flickr API application, with dodgy-looking popups
Well it all appears to be working, but our popups aren’t big enough to contain the images returned by Flickr. We can fix that with a bit of simple CSS. I used my browser’s developer tools to find out which classes in the Leaflet.js API were responsible for styling the popup, and then made a small change in the <style> section at the head of my page:
Code Listing 46: Auto-sizing the popups with CSS
... <style> html, body, #map { height: 100%; } .leaflet-popup-content { width:auto !important; } </style> ... |
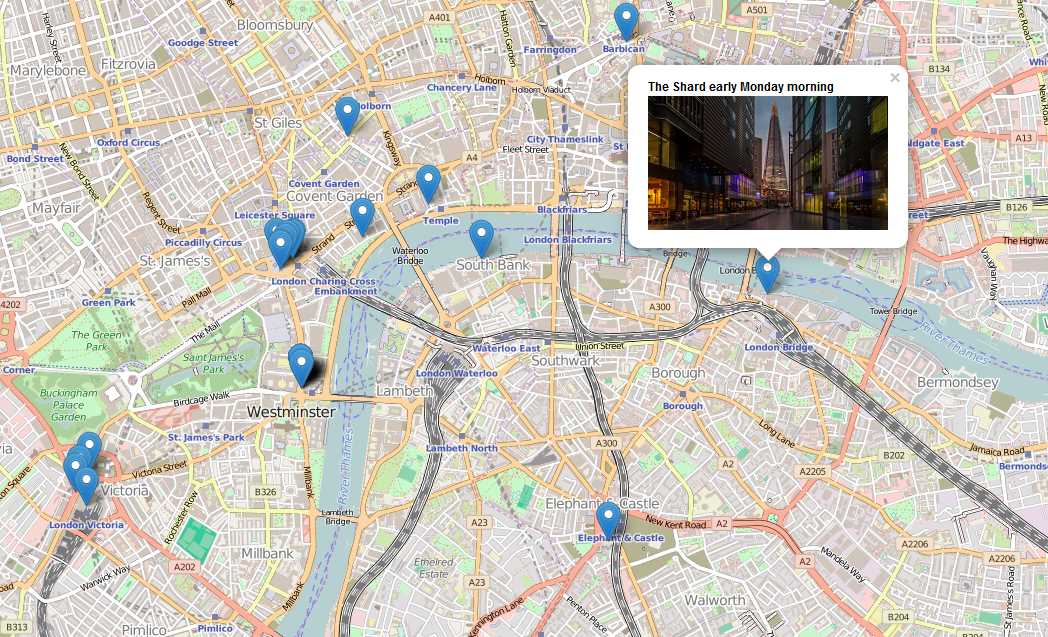
Figure 46: The final Flickr Photo Search API application
Loading KML data into your Leaflet application
As I’m sure you’re beginning to appreciate, there are many different ways of getting data into your Leaflet.js application. But let’s consider one more.
KML stands for Keyhole Markup Language. The full name doesn’t really mean much to anyone anymore, but the acronym certainly does. It’s an XML-based format for representing geographic data that Google has used extensively in its Google Earth and Google Maps applications, and has now found a considerable following elsewhere. KML has now been recognized as an official international standard of the Open Geospatial Consortium, an organization that has more than a passing interest in how we store and share geographic data.
And the Keyhole bit? That’s just a hangover from the days when Google Earth was called Keyhole Earth Viewe,r until Google acquire Keyhole Inc. in 2004.
Anyway, KML is pretty cool because you can represent just about any geographic data with it in either two or three dimensions. And there’s a ton of it out there, just waiting for you to suck into your Leaflet.js mapping applications. Just do a Google search for filetype:kml, and you should find plenty—that’s how I found the USGS Earthquakes Google Earth/KML Files page. Let’s use their Real-Time Earthquakes KML feed in a Leaflet.js application.
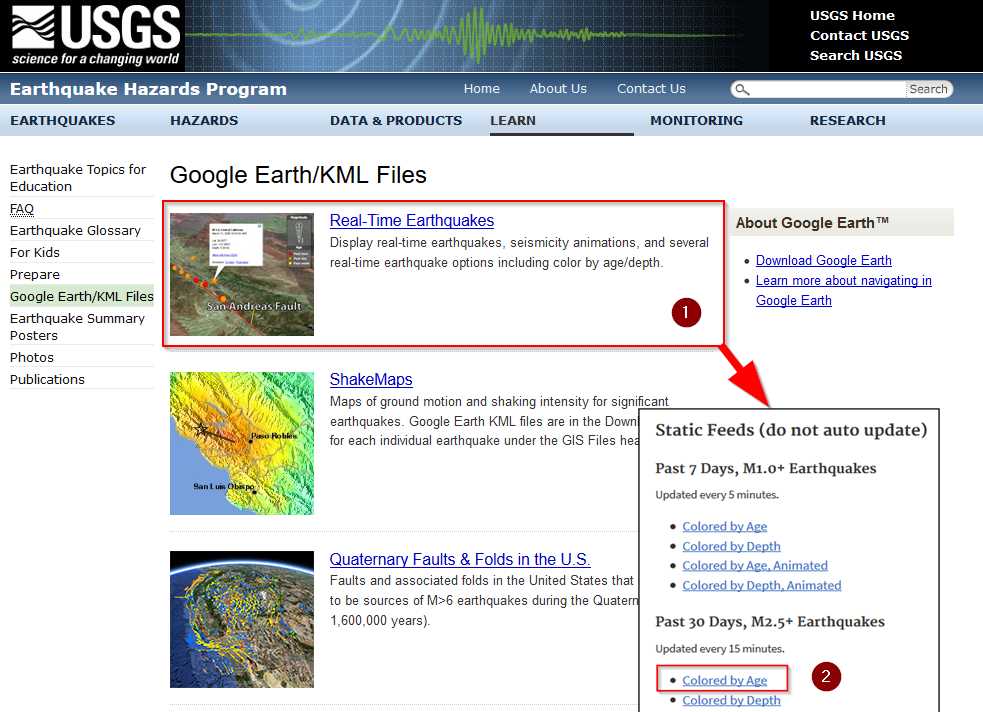
Figure 47: The USGS repository for KML files
I’m going for the Past 30 Days, M2.5+ Earthquakes Colored by Age KML file from Static Feeds, shown in Figure 47.
If you want to follow along, create a folder called kml in the same directory as the web page you are about to create, and put the 2.5_month_age.kml file in there.
The next thing we need is something in Leaflet.js that recognizes and can deal with KML. There’s nothing in the core framework, so again we’re looking for a plugin. The Leaflet.js Plugins page lists “official” plugins, so that’s a good place to start looking. If I search for “KML,” I find something that looks very suitable: leaflet-omnivore, which reads in all sorts of different formats as overlays, including KML.
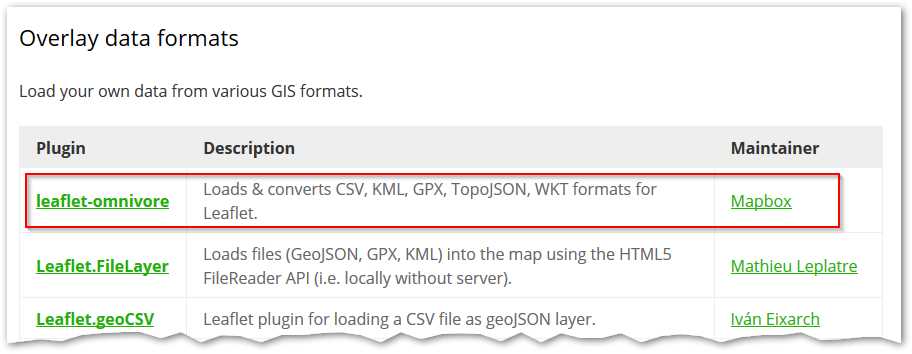
Figure 48: leaflet-omnivore, on the Leaflet.js plugins page
With a quick hop across to GitHub, I can download the latest release as a zip file, extract leaflet-omnivore.min.js, and place it in my js directory, just as we did in the MySQL example. The way leaflet-omnivore works is to download the KML data and format it as a Leaflet GeoJSON layer.
A bit of reading on the GitHub page gives me all the information I need to know to create my application. Here’s the code.
Code Listing 47: Loading KML data with the leaflet-omnivore plugin
<!DOCTYPE html> <html> <head> <title>My Leaflet.js Map</title> <link rel="stylesheet" href="http://cdnjs.cloudflare.com/ajax/libs/leaflet/0.7.3/leaflet.css" /> <script src="http://cdnjs.cloudflare.com/ajax/libs/leaflet/0.7.3/leaflet.js"></script> <script src='js/leaflet-omnivore.min.js'></script> </script> <style> html, body, #map { height: 100%; } </style> <script type="text/javascript"> function init() { var map = L.map('map').setView([0,0], 2); // OSM Mapnik var osmLink = "<a href='http://www.openstreetmap.org'>Open StreetMap</a>"; L.tileLayer( 'http://{s}.tile.openstreetmap.org/{z}/{x}/{y}.png', { attribution: '© ' + osmLink, maxZoom: 18 }).addTo(map); var runLayer = omnivore.kml('kml/2.5_month_age.kml') .on('ready', function() { map.fitBounds(runLayer.getBounds()); runLayer.eachLayer(function(layer) { layer.bindPopup(layer.feature.properties.name); }); }).addTo(map); } </script> </head> <body onload="init()"> <div id="map"></div> </body> </html> |
Let’s pick that code apart and see how it works.
First, we’re referencing the leaflet-omnivore plugin code that we downloaded into our js folder:
<script src='js/leaflet-omnivore.min.js'></script>
Then we’re creating the map in the usual way, not being too bothered about the initial coordinates because we’re going to zoom to the extent of the KML layer when it appears on our map.
We create a new layer called runLayer, an object of class omnivore.kml, which references the earthquake data KML file we downloaded to our kml folder. We’re immediately wiring up an event handler to listen for the KML layer’s ready method, which will tell us when it is loaded.
In the callback function for the ready event, we first get the extent of the KML layer by calling its getBounds() method. We pass the resulting LatLngBounds object into the map’s fitBounds() method, which sets the extent of the map to the extent of the KML layer.
We then iterate through each feature in the KML layer using the layer’s utility method eachLayer(), and set the contents of the popup to be the name field associated with that feature. (Don’t be confused by the use of the term “layer” in eachLayer; that’s how KML views its contents, but we can think of them as individual features within a single KML layer.) We add the result to the map in the usual way.
var runLayer = omnivore.kml('kml/2.5_month_age.kml')
.on('ready', function() {
map.fitBounds(runLayer.getBounds());
runLayer.eachLayer(function(layer) {
layer.bindPopup(layer.feature.properties.name);
});
}).addTo(map);
How did I come up with that feature.properties.name path to the data we needed for the popup? It wasn’t magic. I just used my browser’s developer tools to put a breakpoint on that line and examine the contents of the layer variable:
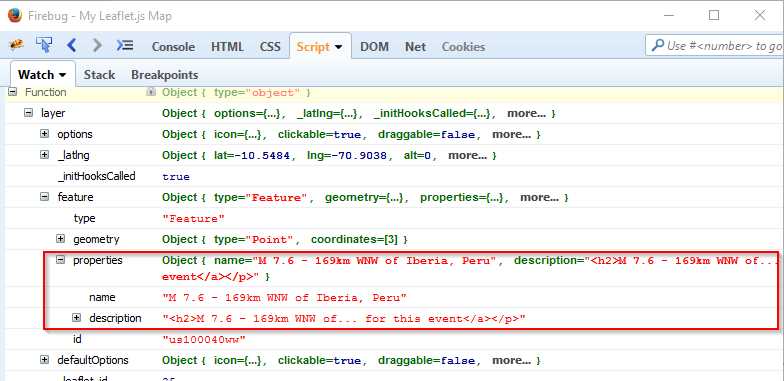
Figure 49: Examining the contents of the earthquake data in Firebug to get the right information for our popups
And what we get as a result is a bunch of markers representing the last 30-days worth of earthquakes of magnitude 2.5 and above, with a popup providing details of the location and actual magnitude of each earthquake:
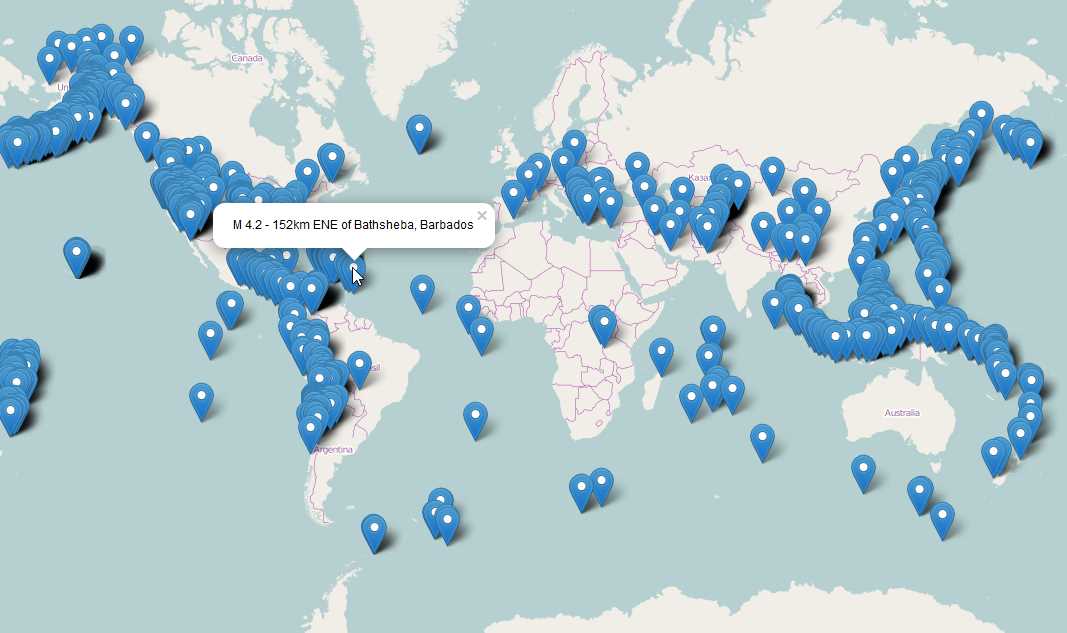
Figure 50: USGS Earthquake KML data visualized in Leaflet.js
In this chapter, we've seen how to add data to Leaflet maps from SQL databases and third-party providers. We've also seen how Leaflet plugins can greatly extend the types of data you can add to your maps, while keeping the core Leaflet code base small.
- 1800+ high-performance UI components.
- Includes popular controls such as Grid, Chart, Scheduler, and more.
- 24x5 unlimited support by developers.