
Istio Succinctly®

CHAPTER 9
Observability
Istio and Kubernetes are effective for operationalizing dense microservices deployments on a fixed number of nodes. When there are many services running on a platform, it is important for operations to detect failures and degradation of services on the platform in real time. As we saw through demos earlier, Istio adds a high level of network resiliency to the system, and a monitoring system might not even detect the degradation of a subset of services. The Envoy proxy of Istio sits in the hot path of the request, and therefore, it can generate high-fidelity instrumentation that can be used to detect and fix issues that can otherwise stay undetected in a system.
In a distributed system, a request may travel through multiple microservices before returning a response to the user. Therefore, it is critical for microservices to implement distributed tracing with a correlation identifier so that the request flow graph of any request can be traced. Istio implements the OpenTracing standard. Istio also supports integration with popular visualization tools such as Prometheus, Grafana, and Kiali, which can help developers and operations visualize the state of the mesh.
Mixer is the key component that collects and compiles telemetry that it receives from the Envoy proxies. The sidecar proxies buffer telemetry at runtime and periodically flush the aggregated data to Mixer. Previously, we discussed that Mixer interfaces with various backends using adapters. Mixer can push the telemetry that it receives from proxies in parallel to multiple telemetry adapters and wait for them to complete. Therefore, you can provision multiple adapters of the same type (such as telemetry adapters that supply data to different backends) at the same time.
Telemetry is a generic term that encompasses three components: metrics, logs, and traces. As we saw earlier, telemetry is periodically sent in the form of attributes by the sidecars to Mixer through its service named stio-telemetry, which is present in the stio-system namespace.
Metrics
Envoy automatically collects some of the common metrics, such as error rate, total request count, and response size. Mixer adapters interested in receiving metrics are required to consume data in the form of a metric adapter template. Istio aggregates metrics at two levels:
- Envoy proxy: Operators can configure the metrics that they want each proxy instance to generate. Some examples of metrics at this level are upstream successful request count, requests completed, connection errors, and upstream failed request count.
- Service: Operators can configure proxy to garner service-level metrics to monitor service-to-service communication in terms of latency, traffic, errors, and saturation.
By default, the metrics are exported to Prometheus by Mixer, but you can configure other backends as well. For configuring a new metric that Envoy should capture, you need three types of resources: an instance, a handler, and rules.
Let’s create these resources to produce a new metric that counts each request twice. The first step is to create a metric that defines what attributes it contains. In Istio, this collection of attributes is called dimensions. The following listing is the declaration of our metric as an instance.
Code Listing 134: Instance specification
apiVersion: config.istio.io/v1alpha2 kind: instance metadata: name: doublerequestcount namespace: istio-system spec: compiledTemplate: metric params: value: "2" # count each request twice dimensions: reporter: conditional((context.reporter.kind | "inbound") == "outbound", "client", "server") source: source.workload.name | "unknown" destination: destination.workload.name | "unknown" message: '"Counting requests twice!"' monitored_resource_type: '"UNSPECIFIED"' |
The previous listing defines a new schema for our new metrics called doublerequestcount. Because we have set the value of the key params.value to 2, on every request from the client when Istio requests for an instance of doublerequestcount, it will receive two objects, thereby recording the metric twice on each request. We have used CEXL expressions to supply values to each of the properties in the dimensions key.
Next, we need to specify the handler to which this metric should be sent. We will now define a Prometheus handler with the following specification.
Code Listing 135: Handler specification
apiVersion: config.istio.io/v1alpha2 kind: handler metadata: name: doublehandler namespace: istio-system spec: compiledAdapter: prometheus params: metrics: - name: double_request_count # Prometheus metric name instance_name: doublerequestcount.instance.istio-system kind: COUNTER label_names: - reporter - source - destination - message |
The previous specification defines a handler named doublehandler. It also defines a new Prometheus metric named double_request_count, which will show up in Prometheus as istio_double_request_count. The custom metric has four labels that map to the metric that we previously created.
Finally, we require a rule to bind the metric to the handler and specify the conditions on which the rule should be triggered. The following is the specification for the rule.
Code Listing 136: Rule specification
apiVersion: config.istio.io/v1alpha2 kind: rule metadata: name: doubleprom namespace: istio-system spec: actions: - handler: doublehandler instances: [doublerequestcount] |
Now that we have the configurations ready, let’s clear the namespace for our demo by executing the following command.
Code Listing 137: Delete namespace
$ kubectl delete namespace micro-shake-factory namespace "micro-shake-factory" deleted |
Now, let’s bring back our APIs by executing the following commands.
Code Listing 138: Create fruits API
$ kubectl apply -f fruits-api-all.yml -f juice-shop-api-all.yml namespace/micro-shake-factory created deployment.apps/fruits-api-deployment-v1 created service/fruits-api-service created virtualservice.networking.istio.io/fruits-api-vservice created namespace/micro-shake-factory unchanged deployment.apps/juice-shop-api-deployment created service/juice-shop-api-service created gateway.networking.istio.io/juice-shop-api-gateway created virtualservice.networking.istio.io/juice-shop-api-vservice created |
We are now ready to enable the metrics by executing the following command.
Code Listing 139: Create a custom metric
$ kubectl apply -f double-request-metric.yml instance.config.istio.io/doublerequestcount created handler.config.istio.io/doublehandler created rule.config.istio.io/doubleprom created |
Send a few requests to the juice-shop API service so that our metrics start showing up. Since the metrics are buffered by Envoy, it would take some time to have our metrics processed. Once the metrics are processed, they will start appearing in the Prometheus UI, which is already installed in your cluster. Let’s port forward the Prometheus service by executing the following command so that we can access it from our browser.
Code Listing 140: Port forward Prometheus
$ kubectl -n istio-system port-forward service/prometheus 9090 9090 |
Navigate to the Prometheus graph endpoint at https://localhost:9090/graph and enter the metric name for the records to show up in the grid: istio_double_request_count. You can also write Prometheus-supported queries such as sum(istio_double_request_count) to operate with the metric.
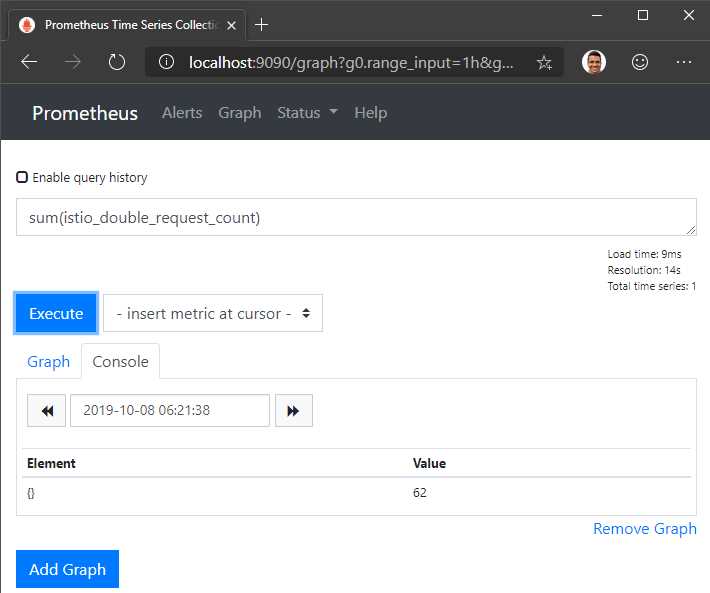
Figure 18: Prometheus UI
Prometheus is a time-series database and visualization tool. For an overall view of the mesh, Istio supports the Grafana visualization add-on. Grafana is a popular open-source metrics visualization tool that can be used to query, analyze, and alert on metrics. The Istio deployment of Grafana consists of some common dashboards. Grafana is dependent on Prometheus for metrics.
To enable Grafana, set the parameter --set grafana.enabled=true during the Helm installation of Istio. Next, send some traffic to the mesh and query for the dashboard endpoint by executing the following endpoint. Note that any dashboard endpoint that we discuss in this book will remain the same across clusters (yours or ours) unless configured otherwise, but you should know how you can retrieve the service ports and not remember a bunch of magic numbers.
Code Listing 141: Get Grafana service
$ kubectl -n istio-system get svc grafana NAME TYPE CLUSTER-IP EXTERNAL-IP PORT(S) AGE grafana ClusterIP 10.108.18.200 <none> 3000/TCP 5m50s |
The next operation to perform is to simply forward port 3000 of the Grafana service to a port on the localhost by executing the following command.
Code Listing 142: Port-forward Grafana
$ kubectl port-forward -n istio-system svc/grafana 3000:3000 Forwarding from 127.0.0.1:3000 -> 3000 Forwarding from [::1]:3000 -> 3000 |
This command will make the Grafana dashboard available on http://localhost:3000. Navigate to the portal and select Istio Service Dashboard from the list of dashboards, which will allow you to monitor incoming traffic in real time.
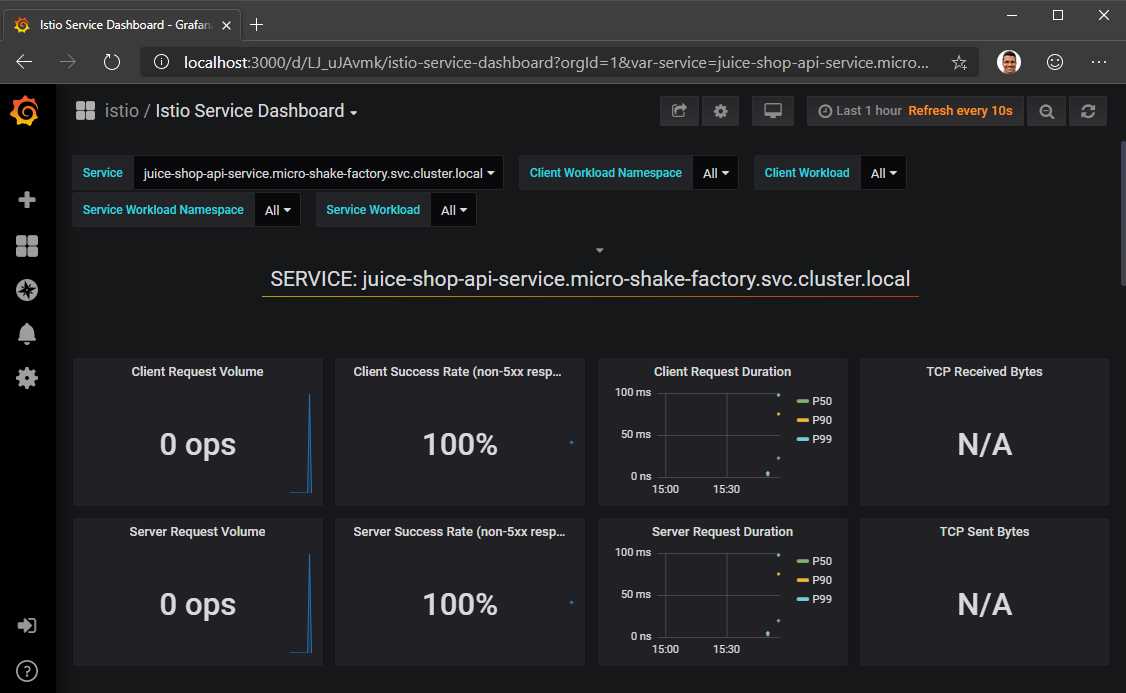
Figure 19: Grafana UI
Some of the other pre-provisioned dashboards allow you to visualize the overall mesh, individual workloads, and individual services.
Traces
Distributed tracing is key to getting deep insight from the service mesh. Two popular open-source tracing systems, Jaeger and Zipkin, are bundled in the Istio release package. Both solutions follow the OpenTracing standards. To enable tracing, you only have to set the parameter --set tracing.enabled=true in the Istio Helm install options. To enable Zipkin, you also need to set the parameter --set tracing.provider=zipkin during installation; otherwise, Jaeger will be installed by default.
Here is a brief overview of how distributed OpenTracing works. The span is the primary building block of a distributed trace, which represents an individual unit of work in a distributed system. The application is responsible for creating spans and sharing them with the OpenTracing engine. A span contains the beginning and end time of the operation, the name of the operation, and the logs generated within the operation. If the service invokes any other service, it will be responsible for propagating the trace context to the other service, which will create a new span and repeat the process. With spans and trace context, the OpenTracing engine generates a trace. A trace can show you the complete path of a request along with the time, duration, and other information. Each span has its own ID and a parent ID, which is the ID of the trace. These identifiers should be propagated between the services for correlation.
Istio manages communication with the OpenTracing engine and generates request tracing headers if they don’t exist. If it receives a request with the headers populated, it doesn’t generate them again and treats the trace as an in-progress trace. Istio relies on the following headers for distributed tracing:
- x-request-id
- x-b3-traceid
- x-b3-spanid
- x-b3-parentspanid
- x-b3-sampled
- x-b3-flags
- x-ot-span-context
If the service invokes another service, it must propagate the trace headers with the request so that Istio is able to correlate the upstream request with the incoming request to the service. Our demo application APIs are instrumented to propagate the headers across the services, and therefore, we will be able to trace a request end to end. If you list the services running under the istio-system namespace, you will find a service named tracing that is responsible for interfacing with the tracing provider Jaeger or Zipkin and fetching logs from the application. Let’s execute the following operations with our service to generate logs.
Code Listing 143: Access juice-shop API
$ curl -H "Host: juice-shop.istio-succinctly.io" -H "Content-Type: application/json" -H "country: au" -d "{\"fruits\":[\"kiwi\",\"mandarin\"]}" http://localhost/api/juice-shop/blender $ curl -H "Host: juice-shop.istio-succinctly.io" -H "Content-Type: application/json" -H "country: au" -d "{\"fruits\":[\"kiwi\",\"mango\"]}" http://localhost/api/juice-shop/blender $ curl http://localhost/api/juice-shop/hello -H 'Host: juice-shop.istio-succinctly.io' $ curl http://localhost/api/juice-shop/exoticFruits -H 'Host: juice-shop.istio-succinctly.io' |
To find out the port on which the telemetry service exposes the telemetry data, execute the following command, which returns all the ports exposed by the service.
Code Listing 144: Get tracing port name
$ kubectl get svc/tracing -n istio-system -o jsonpath='{.spec.ports}' '[map[name:http-query port:80 protocol:TCP targetPort:16686]]' |
We know what we should do next. Forward the port 80 (80 is mapped to 16686 on the container) of the service to the localhost using the following command.
Code Listing 145: Port-forward tracing
$ kubectl port-forward svc/tracing -n istio-system 8081:80 Forwarding from 127.0.0.1:8081 -> 16686 Forwarding from [::1]:8081 -> 16686 |
After executing the previous command, you can navigate to http://localhost:8081 to view the Jaeger dashboard. At this time, you might or might not see all the requests in the logs, since to save processing overheads, Istio records just 1 percent of requests by default. There are two approaches that you can take to adjust this value:
- Update the PILOT_TRACE_SAMPLING environment variable: Execute the command kubectl -n istio-system edit deploy istio-pilot and update the value of the PILOT_TRACING_SAMPLING variable to a number between 1 and 100. This change will affect all the services in the mesh.
- Set x-envoy-force-trace request header: Set the x-envoy-force-trace request header for all the requests that need to be traced.
Execute the previous requests to the juice-shop API service again after setting the request header, and then visit the Jaeger dashboard. In the dashboard, you will now be able to look up traces generated by each service as follows.
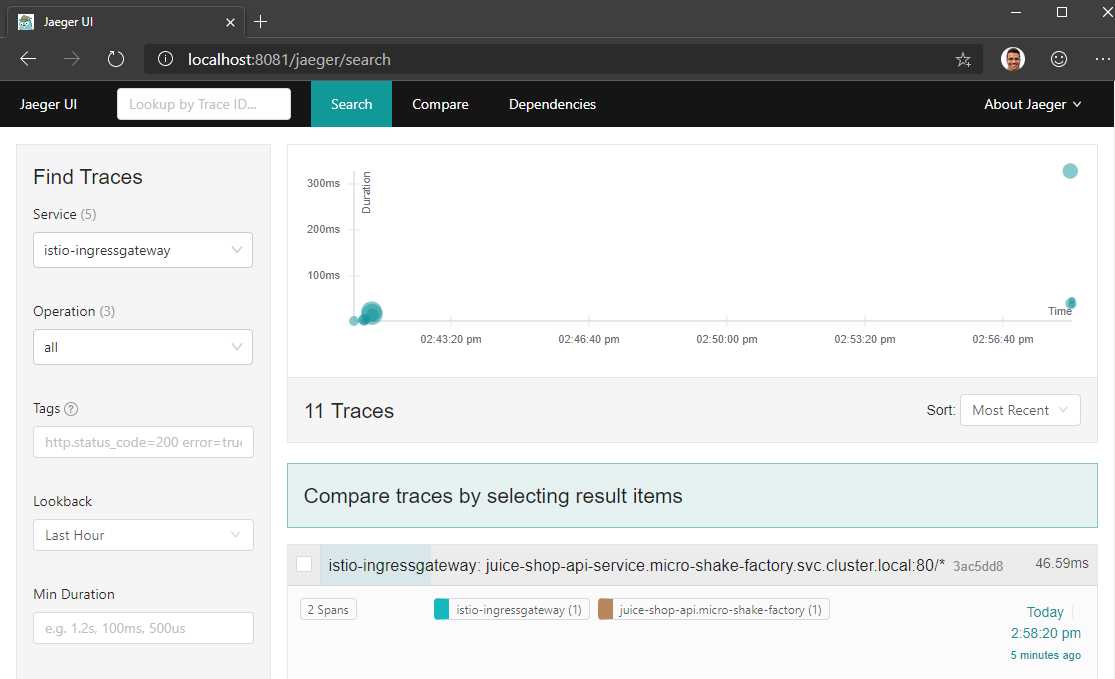
Figure 20: Jaeger dashboard
If you click on a trace, you will be able to see the call graph of the request. The following screenshot illustrates one such trace where the request is tracked across the services.
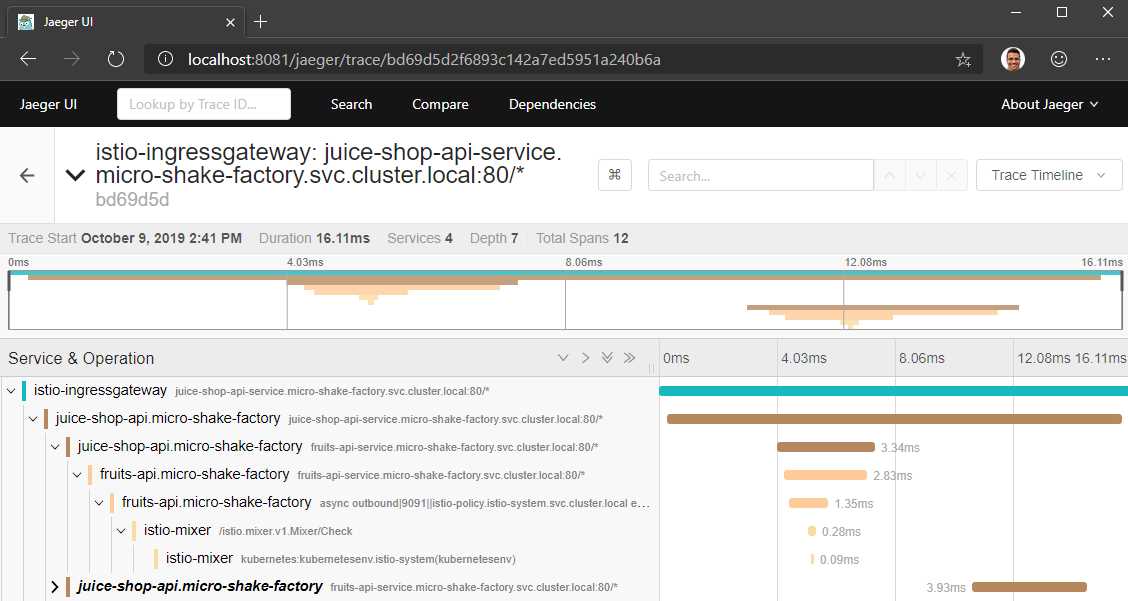
Figure 21: Jaeger trace results
By clicking on the Dependencies tab on the dashboard, you can also see the dependency graph of the services whose traces are available to Jaeger.
Logs
Logs are crucial for recording the application state details when an error occurs. Arguably the most popular choice for recording logs in a distributed environment is Fluentd, which can be enabled in the mesh through the Fluentd Mixer adapter. Mixer has a built-in adapter named logentry that generates a stream of logs. Fluentd, and many other logging backends rely on logentry to gather logs. Out of the many approaches for configuring Fluentd, let’s look at one of the easiest approaches using the following workflow:
- Create a logentry instance to generate a stream of logs.
- Configure a Fluentd handler to collect the logs and pass them to a Fluentd daemon running on the cluster.
- Create a rule that binds the logentry instance to the Fluentd handler and configures the logging level.
The following is the specification for a log entry instance, which will generate a log stream for logs of severity level information and above.
Code Listing 146: Log entry specification
apiVersion: config.istio.io/v1alpha2 kind: logentry metadata: name: istiolog namespace: istio-system spec: severity: '"info"' timestamp: request.time variables: source: source.labels["app"] | source.service | "unknown" user: source.user | "unknown" destination: destination.labels["app"] | destination.service | "unknown" responseCode: response.code | 0 responseSize: response.size | 0 latency: response.duration | "0ms" monitored_resource_type: '"UNSPECIFIED"' |
Next, we will create the Fluentd handler, which will pass the logs to the Fluentd daemon running at localhost:24224 in the cluster.
Code Listing 147: Fluentd specification
apiVersion: config.istio.io/v1alpha2 kind: fluentd metadata: name: handler namespace: istio-system spec: address: "localhost:24224" integerDuration: n |
Finally, the following rule will bind the previous two objects together.
Code Listing 148: Rule specification
apiVersion: config.istio.io/v1alpha2 kind: rule metadata: name: istiologtofluentd namespace: istio-system spec: match: "true" # Match for all requests actions: - handler: handler.fluentd instances: - istiolog.logentry |
You can tweak the severity level and the match rules to suit your needs. The application of this policy is dependent on how Fluentd is deployed on your cluster, and therefore, you should refer to the official documentation on the topic here for further guidance.
Mesh visualization
Visualizing how your mesh is performing at runtime can help give you absolute control over your mesh. Kiali (a Greek word that means “spyglass”) is an open-source and versatile visualization tool that pulls data from Prometheus and the host Kubernetes to generate a communication graph of the mesh that shows service-to-service interactions. With Kiali, since the entire communication stack (Istio and Kubernetes) is available to you, rather than just that of Istio from Grafana, you get much better visibility of the system with Kiali.
For installing Kiali in the mesh, set the parameter --set kiali.enabled=true in the Helm installation options of Istio. Since Kiali requires a username and password for configuration, we will create a secret that Kiali will read by default with both username and password set as admin (Base64 encoded).
Code Listing 149: Kiali secret
apiVersion: v1 kind: Secret metadata: name: kiali namespace: istio-system labels: app: kiali type: Opaque data: username: YWRtaW4= passphrase: YWRtaW4= |
The policy that we just provisioned is for demo only. You should never leave such policies in the source code repository. Let’s apply this policy to our mesh.
Code Listing 150: Create Kiali secret
$ kubectl apply -f kiali-secret.yml secret/kiali created |
For the secrets to take effect, we will delete the Kiali pod so that it gets recreated. Use the command kubectl get pods -n istio-system to find the name of the pod running the Kiali service, and execute the following command by substituting the name of the pod that your cluster has.
Code Listing 151: Delete existing pod
$ kubectl delete pod kiali-7d749f9dcb-lbkth -n istio-system pod "kiali-7d749f9dcb-lbkth" deleted |
Let’s repeat the same exercise as before to forward the port of the Kiali service to a port on the localhost. Use the same step as before to find out the required port of the Kiali service.
Code Listing 152: Port forward Kiali
$ kubectl port-forward -n istio-system svc/kiali 8080:20001 Forwarding from 127.0.0.1:8080 -> 20001 Forwarding from [::1]:8080 -> 20001 |
Navigate to http://localhost:8080 to visit the Kiali dashboard. You will be asked to enter a username and password, which would be admin for both the fields. On the Overview dashboard, you will see all the applications that are executing in your mesh. You can click on any application to view the health of the services in that application.
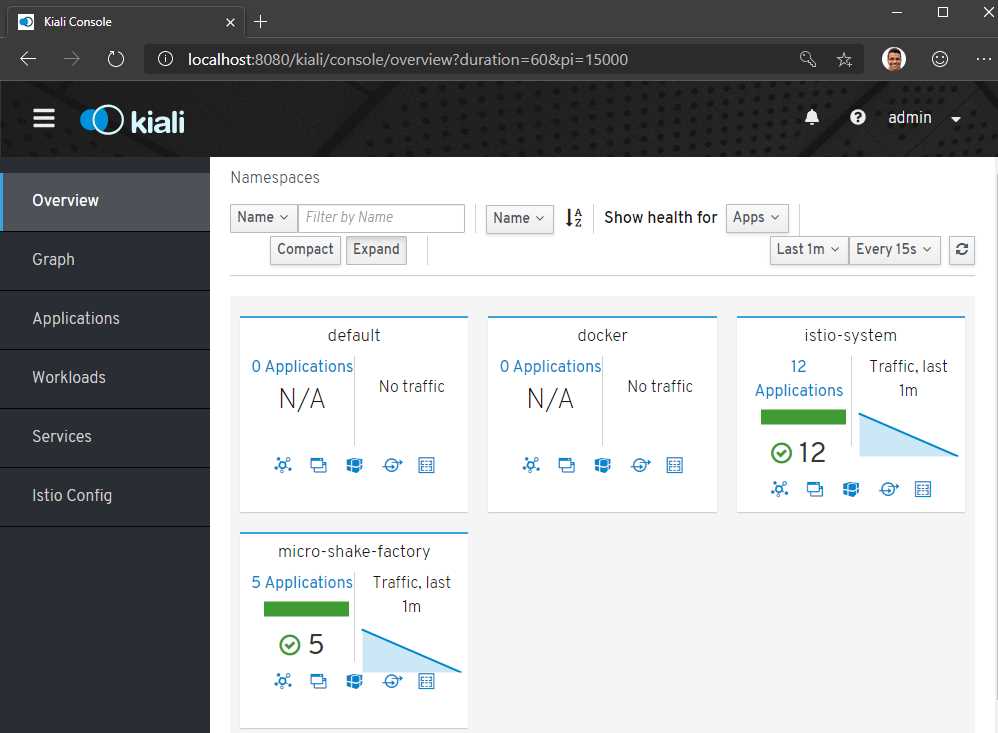
Figure 22: Kiali dashboard
For each application, the dashboard also shows incoming and outgoing traffic metrics. You can bring up this dashboard and send some traffic to the service in the background to light it up.
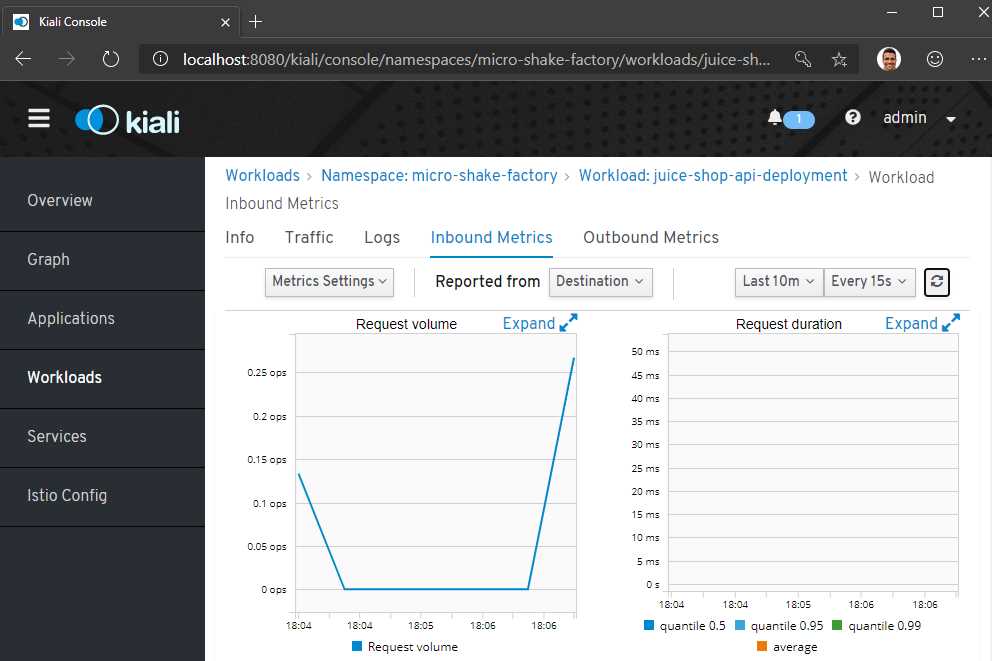
Figure 23: Kiali mesh visualization
Finally, you can also get a visual representation of the services in your namespace by clicking on the Graph tab and selecting your namespace from the drop-down list.
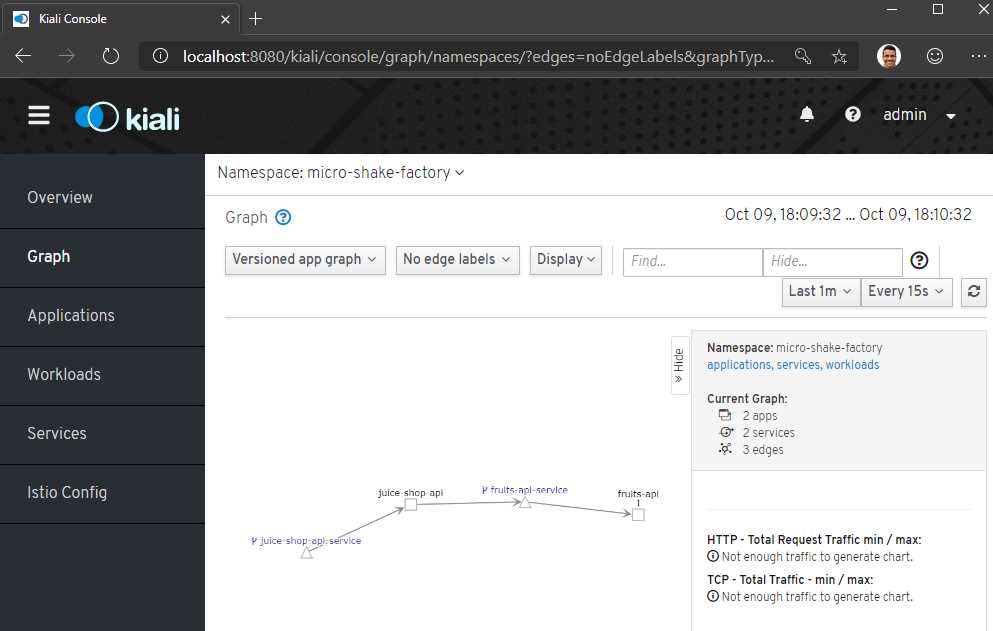
Figure 24: Kiali namespace visualization
The Istio Config tab can show you any misconfigurations in your mesh. This feature can surface issues such as virtual services listening to a gateway that does not exist, routes that do not exist, multiple virtual services for the same host, and non-existent service subsets.
Istioctl observability utilities
The istioctl dashboard command is a built-in wrapper over the port-forward commands that we discussed for the various dashboards. The command istioctl dashboard <dashboard-name> will launch a browser to bring up one of the available dashboards: controlz, envoy, grafana, jaeger, kiali, prometheus, and zipkin.
Summary
In this chapter, we discussed the elements of observability: metrics, traces, and logs; and how Istio supports all of them. We saw the observability visualization tools that are packaged with the Istio binary, and that it requires minimal effort from us to set up. However, there are costs to telemetry, and indiscriminate logging and tracing may hamper the performance of the application. We will discuss the aspect of performance and some recent service mesh initiatives in the next chapter.
- 1800+ high-performance UI components.
- Includes popular controls such as Grid, Chart, Scheduler, and more.
- 24x5 unlimited support by developers.