
HDInsight Succinctly®

CHAPTER 7
Using the Microsoft BI Suite to Visualize Results
Processing the data on Hadoop is a significant part of the story. However, for users to extract value from it, they need to be able to manipulate and visualize it. The Microsoft BI suite—through the data modeling tool PowerPivot and the data visualization tool PowerView—enables this via the familiar Excel interface.
The Hive ODBC Driver and PowerPivot
Part of the toolset available to Microsoft Big Data users is the Hive ODBC driver. This allows an ODBC connection to a Hive database to extract the results into Excel either directly or as a data source in a PowerPivot model. In this example, we will be using the output of the results from prior steps as a data source for a PowerPivot model.
Installing the Hive ODBC Driver
The Hive driver needs to be installed on the client machine. The latest version of the driver is available from the Microsoft Download Center, and the location of the latest driver can be found on the HDInsight documentation.[26]
Simply download and install the appropriate driver for the client machine.
Setting up a DSN for Hive
A prerequisite for connection to Hive is to set up a 64-bit System Data Source Name (DSN) that Excel can reference. Searching for ODBC brings up two apps:

From here, this launches the ODBC Data Source Administrator. Under System DSN, choose “Add”. When choosing Create New Data Source, the Hive driver is listed as an available option:
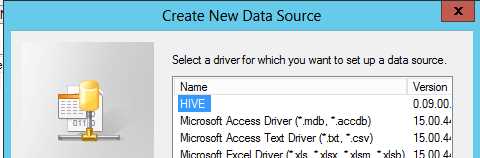
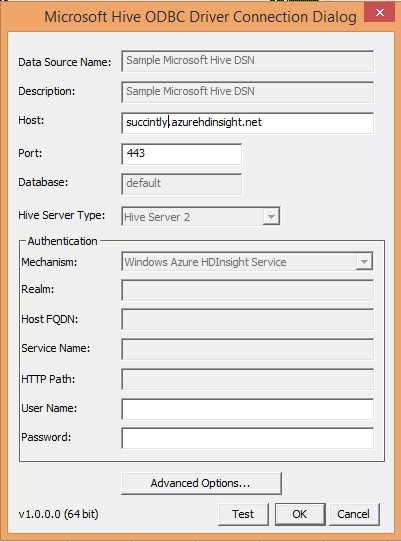
Selecting it and choosing OK takes you to the Hive Data Source Configuration which needs to be updated to match the specific system settings:
Once this step is complete, we can bring data into Excel.
Importing Data into Excel
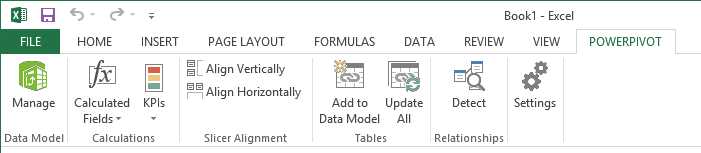
Starting from within Excel, on the PowerPivot tab, select Manage Data Model:
This will give you the option to Get External Data (in this case, “From Other Sources”):

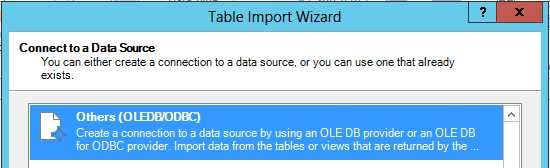
This opens up the Table Import Wizard. Under the “Relational Databases” section, select “Others (OLEDB/ODBC)” and click Next:
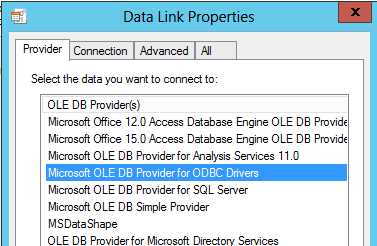
This will then prompt you for a connection string. Choose the build option and, on the Provider tab, choose “Microsoft OLE DB Provider for ODBC Drivers”:
Clicking Next will then get you on the Connection tab; you can then select the DSN created earlier. From there, click Next until the list of tables is displayed for import:
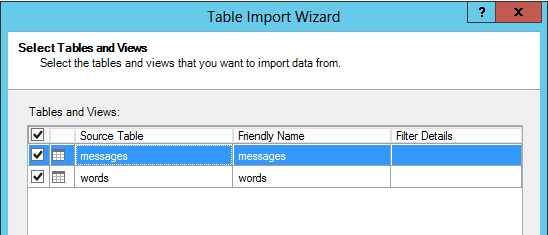
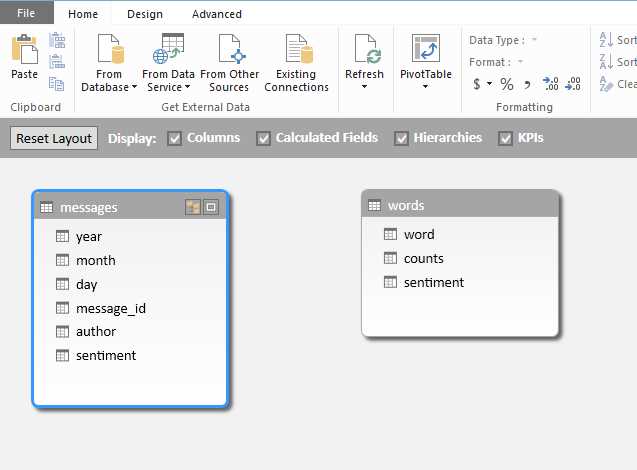
Select all relevant tables and choose Finish. The data from Hive is now available in PowerPivot for modeling and analysis as part of a normal Data Model:
Adding Context in PowerPivot
Part of PowerPivot’s power is its ability to enrich your data with additional information from other sources (also known as “mashing up”), and by adding additional calculations and ways of analyzing measures. A few of these will be shown below.
Importing a Date Table from Windows Azure DataMarket
The data provides little scope for additional demographic or user data as it has been anonymized. However, it is possible to add some insight around time by adding a date table with a suitable hierarchy.
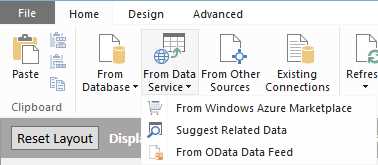
A BI-focused date table is available on Windows Azure DataMarket. To use this, when using the “Get External Data” option, choose “From Data Service” and “From Windows Azure Marketplace”:
This brings us to the Windows Azure Marketplace browser. A search for the “DateStream” set brings us to Boyan Penev’s date set, which is specifically designed for PowerPivot usage:
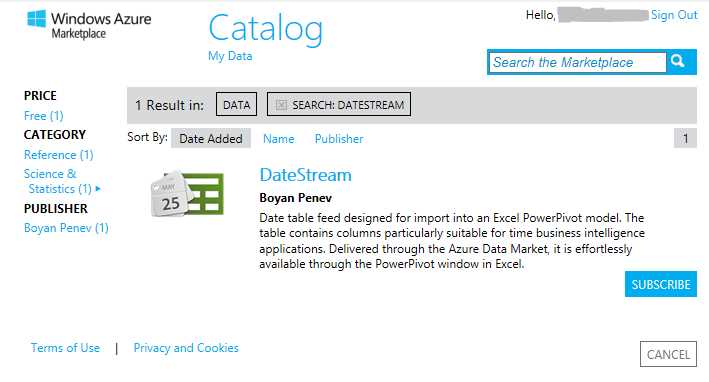
Choose to Subscribe (a Windows Live account is required but the data set itself is free). Follow through the various steps until you reach the Select Query screen:
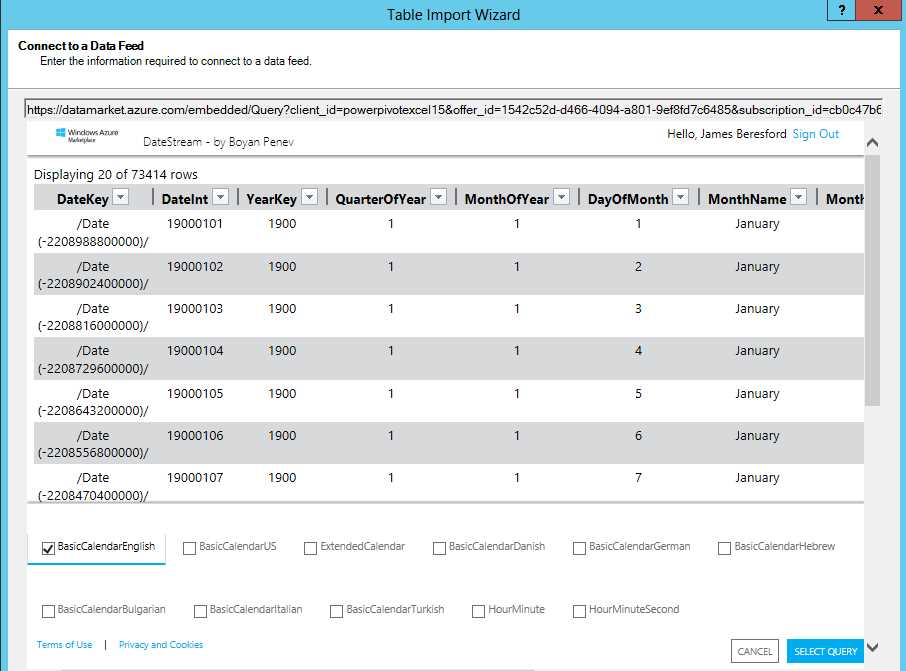
Here, uncheck all options apart from “BasicCalendarEnglish” so that we limit the content retrieved to just what is relevant for our analysis.
Follow through the remaining steps in the process, leaving everything as default. The “BasicCalendarEnglish” table will now be added to the Data Model.
Creating a Date Hierarchy
To increase user friendliness, we will create a browse able calendar hierarchy on the Date table. From within the Data Model manager, right-click on the YearKey column in the “BasicCalendarEnglish” table and choose to “Create Hierarchy”:
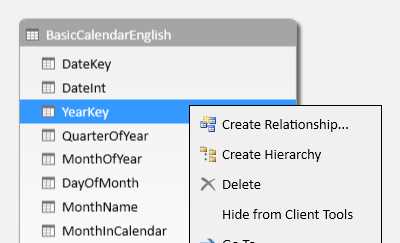
Give it the name Calendar. Then add the columns MonthName and DayOfMonth to the hierarchy by right-clicking and choosing “Add To Hierarchy” and selecting “Calendar”:

A Calendar hierarchy has been created. PowerPivot is intelligent enough to determine the levels and tree without any user intervention.
Linking to the Sentiment Data
The final step is to connect the date table to the date-sensitive data in the model. To do this, we need to create a key on the data that will match the key on the date table. In this scenario, we will use the column “DateInt” which is an integer in the format YYYYMMDD.
From our data, we have three columns: Year, Month, and Day. First, we need to create a calculate column which will hold the data in a matching format. This can be done with a fairly simple Data Analysis Expressions (DAX)-calculated column that pads Month and Day with an extra zero as necessary, as shown below:
DateKey = ([year]*10000)+([month]*100)+[day]
Back in the Diagram View, dragging the DateInt column from the “BasicCalendarEnglish” table to the “messages” table creates the relationship between the two tables and allows viewing of the messages data using the Calendar hierarchy.
Adding Measures for Analysis
In order to examine aspects of the data such as count of posts, we need to add measures to the data that can be quickly assessed by the Data Model.[27]
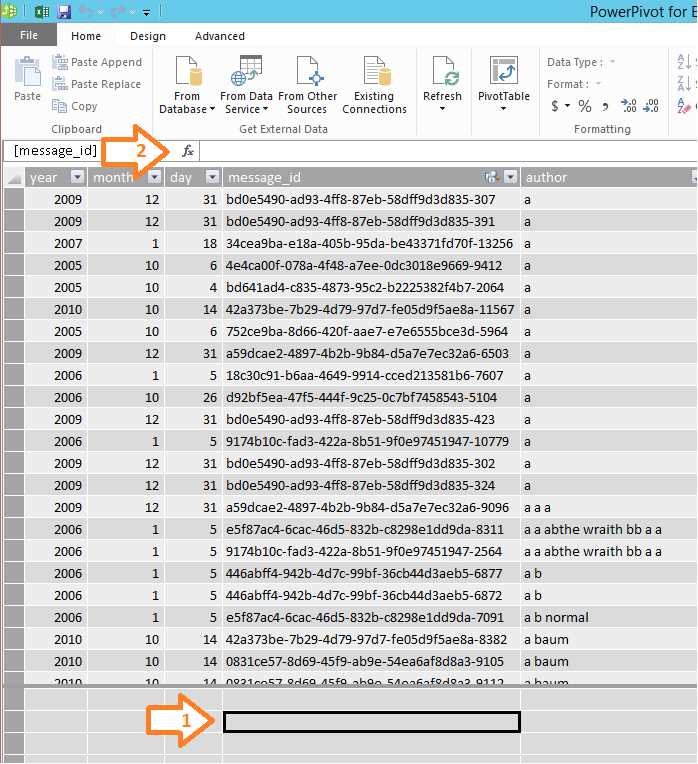
This is done in the Data View. Clicking in a cell in the area under the data (arrow 1) enables us to enter a formula in the Formula bar (arrow 2).
From this we can enter a simple count measure using the DAX expression language:
Message Count:=COUNTA([message_id])
This uses the COUNTA function to count all non-empty cells—we know in this case all message_ids will be non-empty so this can be used to count all messages.[28]
These measures are context-aware so, when using slicers, these will give the correct value depending on the slicer being used (for example, if you are looking at message count by users, it will give the count appropriate to that user).
More complex measures can be introduced such as this one which calculates average Sentiment per message:
Sentiment per Message:=sum([sentiment])/COUNTA([message_id])
This uses a simple sum function over the Sentiment, then divides by the message count to get the average Sentiment per message. This is context-aware so it could be used to determine the average Sentiment per user or sentiment trends over time.
Visualizing in PowerView
From within Excel, we can then visualize the data using the PowerView analytical tool against the Data Model we have created.
In Excel 2013, under the Insert tab on the Ribbon, we can launch “PowerView”:
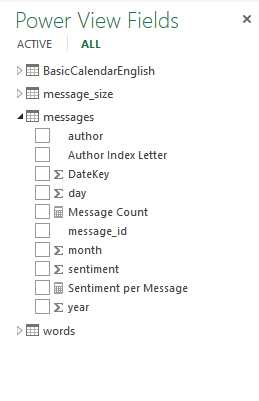
This then enables us to build reports from the Data Model we have created, selecting from the fields in the Model:
Through simple drag-and-drop operations, it becomes easy to create data visualizations with rich interactivity. Some examples are shown below.
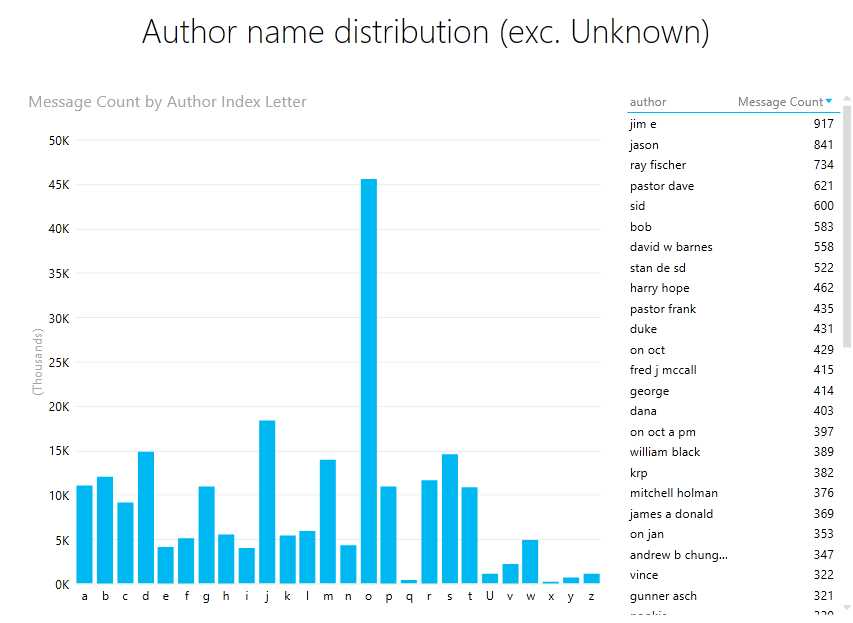
The first example is a look at the distribution of Author Name (excluding “Unknowns”) by first letter of the author name. This highlights a high proportion of author names beginning with the letter “o”—an anomaly worth investigating further.
It features a bar chart showing the post counts by first letter of author name, and also a table listing the most prolific authors:
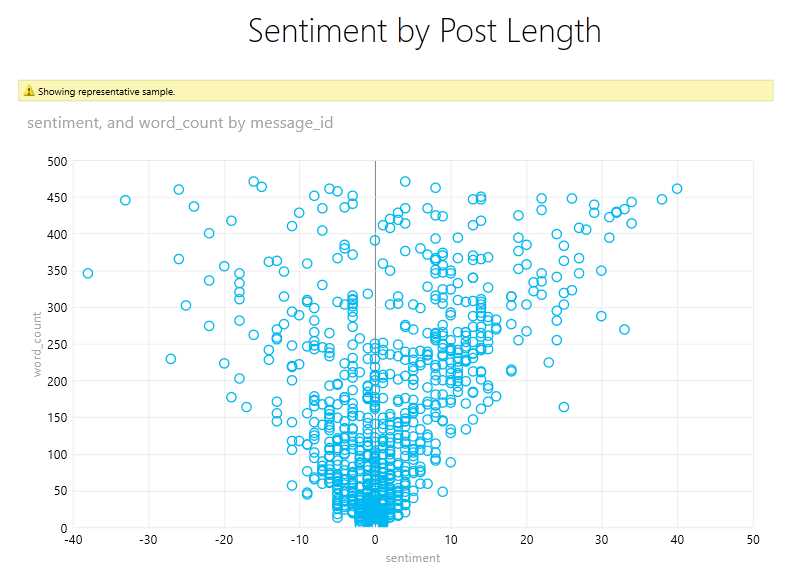
The next report looks at Sentiment related to Post Count, displayed as a scatter chart. Due to the number of data points, a warning appears indicating only a representative sample is being displayed.
The report appears to indicate that there is no strong relationship between post length and the overall Sentiment of the post:
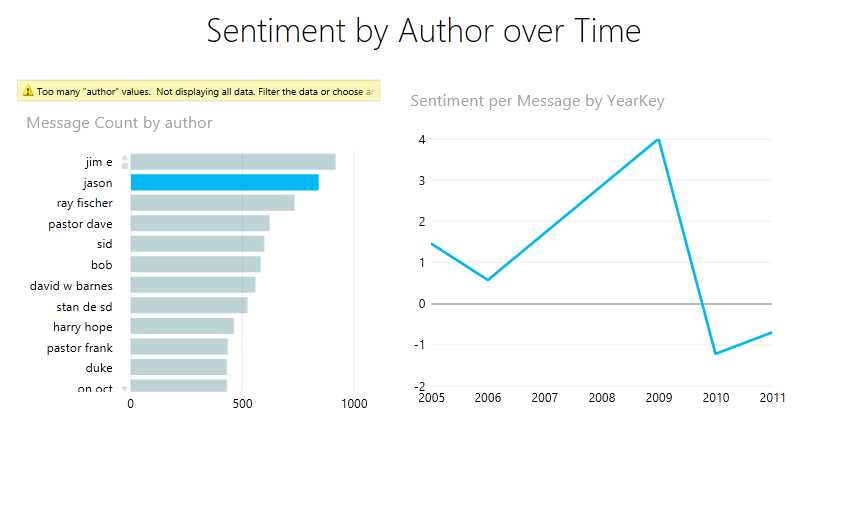
The final example shows “Sentiment by Author over Time”. This can be filtered by author using the bar chart on the left, showing post count by author:
PowerQuery and HDInsight
A second option for accessing data on HDInsight is to use the recently released Excel add-in PowerQuery.[29] This enables the direct extraction of text files from an HDInsight cluster or, strictly speaking, the Azure Blob Storage associated with the cluster.[30] In line with the architecture of HDInsight where compute is separate from storage, to access output from an HDInsight job, it is not necessary for the compute cluster to be up and running.
At present, this data access capability is not extended to PowerPivot, so the ability to bring in large volumes of data for analysis in Excel is limited.
- 1800+ high-performance UI components.
- Includes popular controls such as Grid, Chart, Scheduler, and more.
- 24x5 unlimited support by developers.