
HBase Succinctly®

CHAPTER 9
Monitoring and Administering HBase
HBase Web UIs
All the HBase services provide a simple Web UI, which gives you basic information about how the service is running and gives you access to the logs. These are useful for troubleshooting and diagnostics, and the core services—the Master and Region Servers—have much richer Web UIs that tell you a lot about the health of the database.
The Web UIs are embedded using the Jetty Web Server (which has a low memory footprint and fast response times), so they start when you run the relevant service. They are all unsecured sites; they run with no authentication over HTTP. Each UI runs on a non-standard HTTP port, so if you want to limit the availability of the UI(s), you need to block external access to the port(s).
The Docker container hbase-succinctly has all the HBase servers running and all the UI ports exposed, so you can run an instance and browse to each of the UIs.
External API UIs
The Thrift and Stargate UIs provide the same basic information for each server. Figure 17 shows the home page for the Thrift UI, which runs on port 9095:
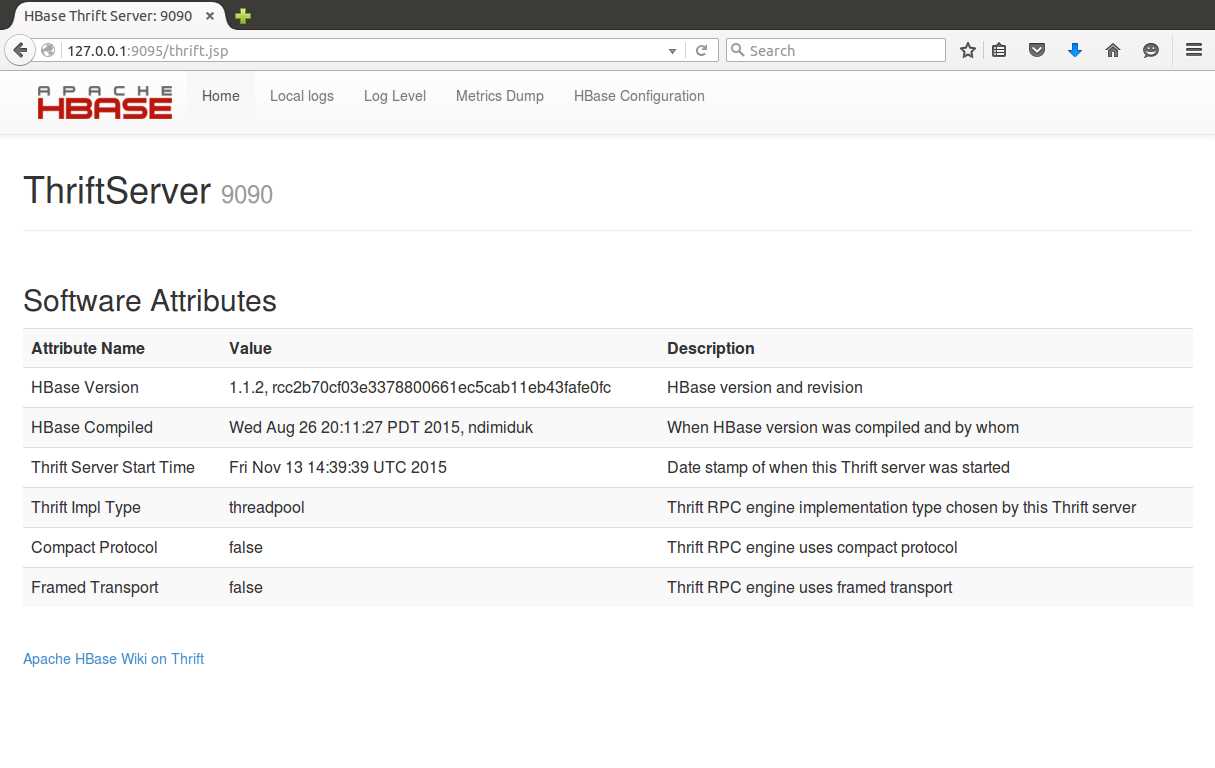
Figure 17: The Thrift Server UI
A similar interface is shown in Figure 18, the Stargate UI, which runs on port 8085:
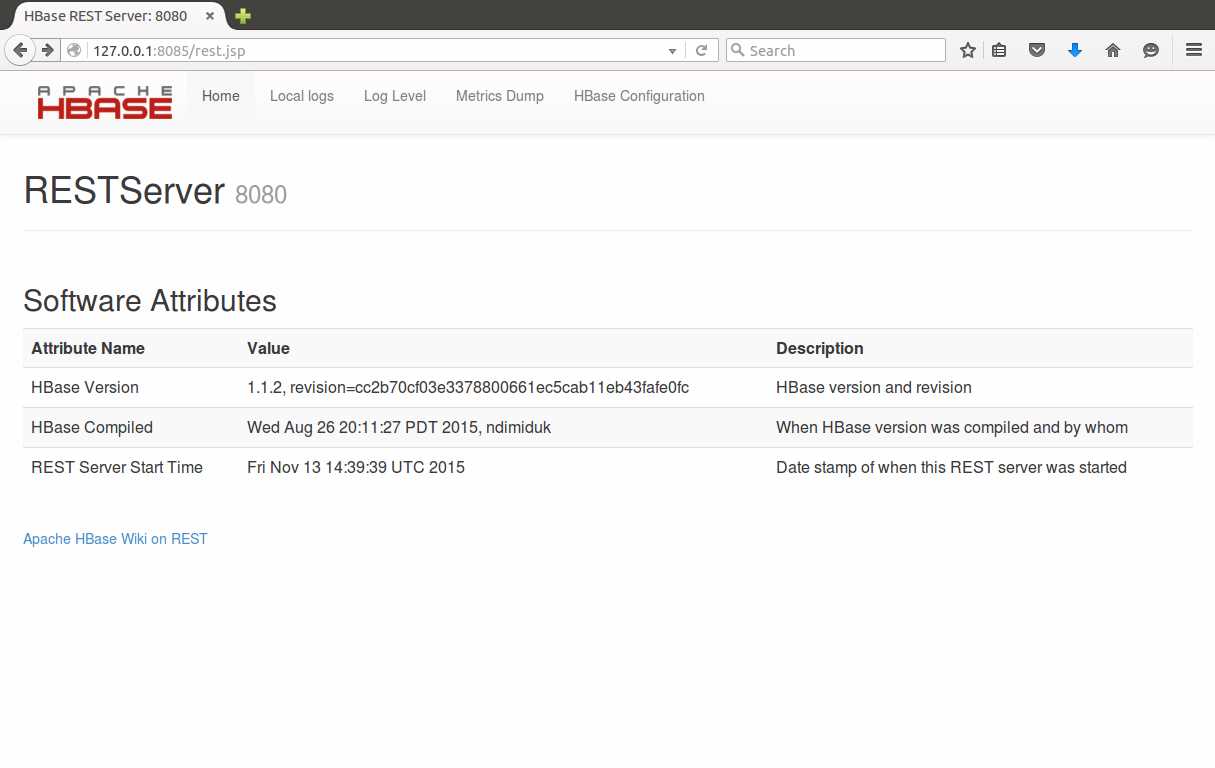
Both UIs show the exact version of HBase that's running, including the git commit ID (in the revision field), and the uptime of the server. If the server isn't running you won't get a response from the Web UI.
The Thrift UI also shows some key setup details (the transport and protocol types it accepts), and both UIs have the same set of links:
- Local logs – to view the log files on the server
- Log Level – to get or set the log levels for the server
- Metrics Dump – provides a detailed dump of the stats for the server
- HBase Configuration – shows all the configuration settings for the server
The last two links are worth looking at individually. Metrics Dump (URL is /jmx from the base path) gives a JSON output containing a huge amount of information, captured from Java Management Extensions running in the server.
You can use a JMX client to navigate the output, or add custom monitoring to query the server and parse the JSON as part of an automated diagnostic test. Code Listing 61 shows the JVM heap usage part of the output from the Metrics Dump:
Code Listing 61: JMX Metrics Dump
"HeapMemoryUsage": { "committed": 62652416, "init": 64689792, "max": 1018560512, "used": 16339616 } |
The HBase Configuration link (/conf from the base URL) returns the active HBase configuration in XML. Each property contains the current value and the source of the value (which could be the server's hbase-site.xml, or the HBase default), which can be very useful for tracking down misconfigured environments.
Code Listing 62 shows the Zookeeper address from the HBase Configuration:
Code Listing 62: XML Configuration Settings
<property> <name>hbase.zookeeper.quorum</name> <value>localhost</value> <source>hbase-default.xml</source> </property> |
Region Server UI
On the Region Servers, the Web UI has the same log, metrics, and configuration links as the external API UIs, but it contains a lot more detailed information about the performance of the server and the data it's providing.
Figure 19 shows the home page of the Region Server UI, which runs on port 60030:
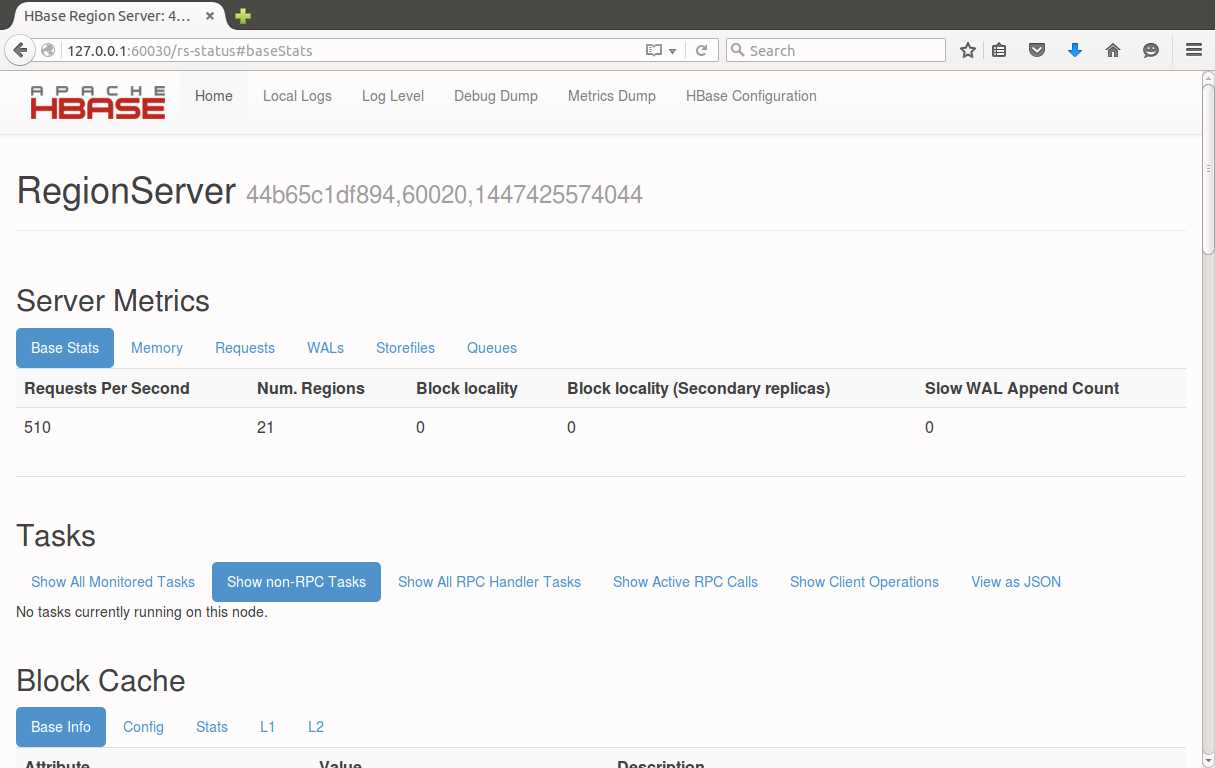
Figure 19: The Region Server Web UI
The Server Metrics section tells you how hard this one Region Server is working—how many regions it is hosting, and how many requests-per-second it is currently serving. These are requests from any of the APIs, so if you are using Java, Thrift, and Stargate clients, the total usage will show in here.
You can drill into the metrics to check the memory usage of the server and to see the breakdown of the WAL and Store Files that the regions are using. The Requests tab, shown in Figure 20, displays the cumulative requests served:
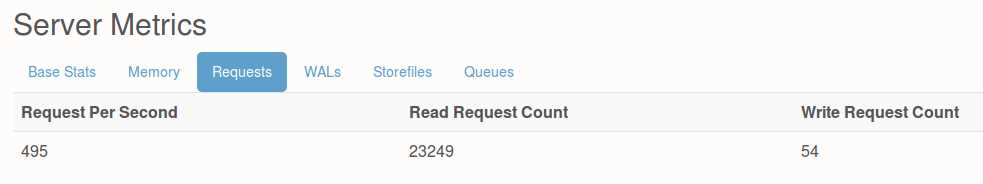
Figure 20: Server Metrics in the Region Server UI
Those stats are the combined read and write count across all regions, since the server has been running.
The home page also shows any long-running tasks, and their status. In Figure 21, the green bar highlights that the Block Cache for a region has finished flushing (in this case the metadata table, hbase:meta):
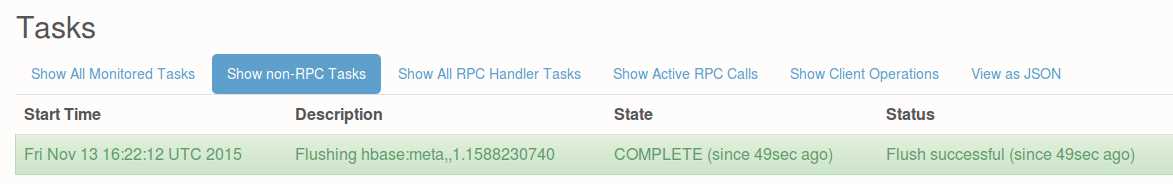
Figure 21: Task Status in the Region Server UI
The Region Server UI is worth exploring further. You can also get statistics on how well the caches are working and a breakdown of all the regions the server is hosting (with the start and end row keys), and the number of requests per region.
Those details are useful to see how your regions have been balanced across servers, and will help you detect any hot spots, as in Figure 22, where region e of the access-logs table has had 75K read requests, compared to 0 for the neighboring regions:
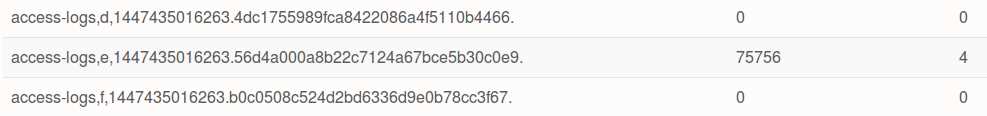
Figure 22: A Region Hot Spot in the UI
Master Server UI
Although the Region Server UI is useful, the Master Server UI runs at a higher level, displaying performance and metrics for all the Region Servers. It's the first place to look to check the health of your HBase system.
By default, the Web UI runs on port 60010 on the Master Server. If you are running multiple masters, only the active master shows any information. The home screen, shown in Figure 23, opens with a summary of all your Region Servers, stating how many regions each one is serving, and how many requests per second they are currently handling:
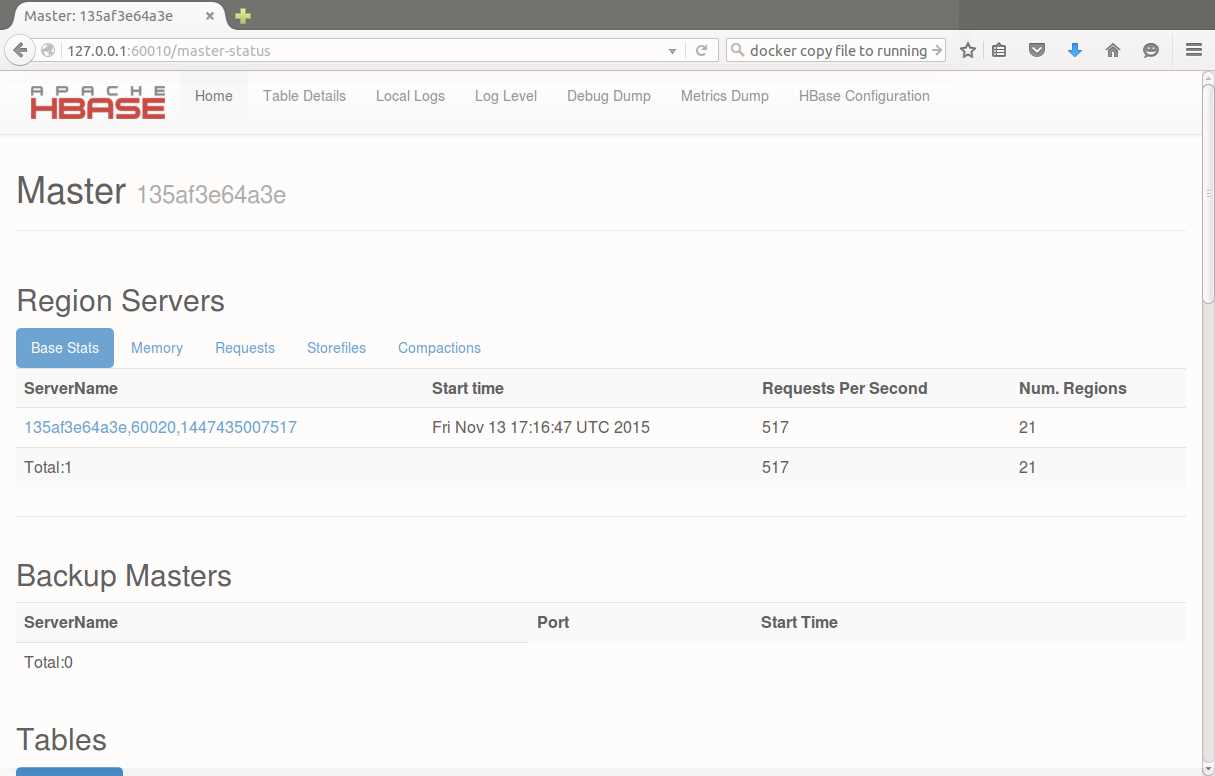
In the Region Servers section, the Master UI also surfaces the combined details from the Region Servers for their memory usage, individual region requests, and Store Files. The Compactions tab tells you if any major compactions are happening, and what status they're in.
From the top level navigation, you can access the local log files for the Master and change the log levels, as well as seeing the metrics dump and the HBase Configuration. The Debug Dump gives you very low-level detail on what the server is doing (which you rarely need unless it's misbehaving), but the Table Details link gives you the useful information shown in Figure 24:
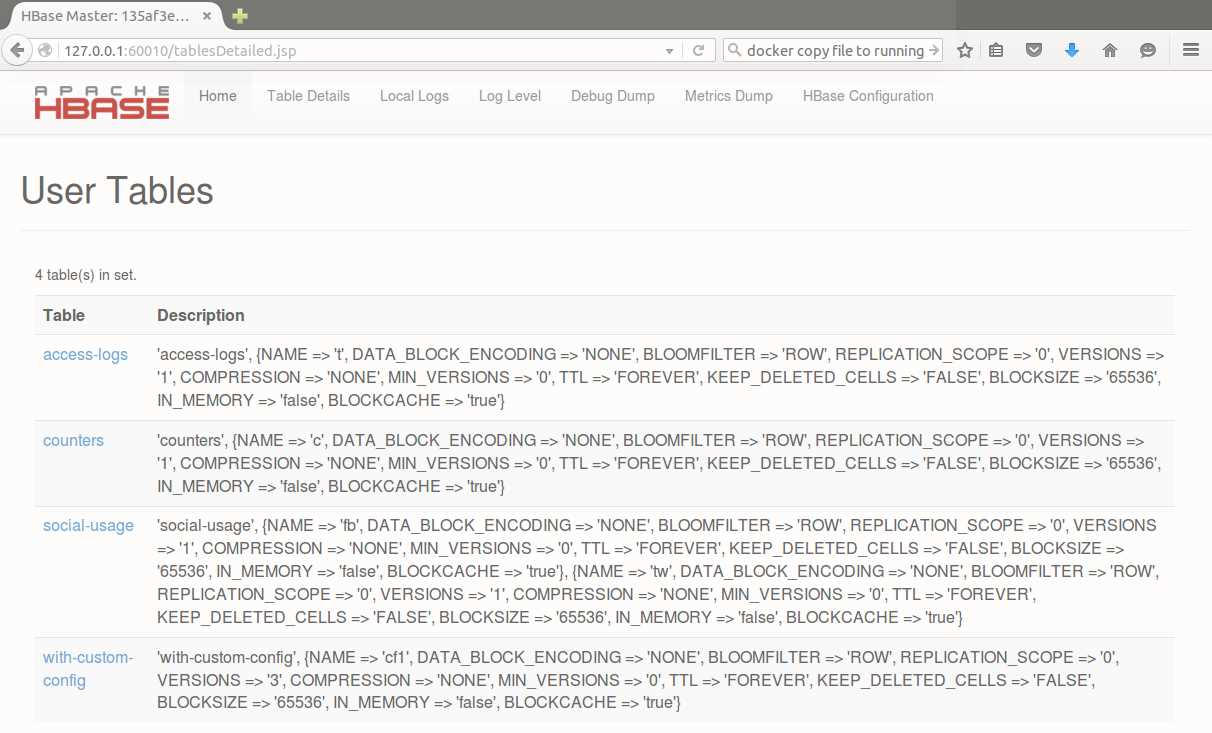
Figure 24: Table Details in the Master UI
This page shows each table defined in the database, and the full configuration (you can see the with-custom-config table from Chapter 2 has three versions specified for the column family, compared to the default of one in other tables).
Administering HBase with the Shell
All the client APIs we saw in Chapters 4, 5, and 6 have DDL features, but I prefer to keep client code free of admin work and use HBase Shell scripts for DDL and admin. There are also administrative functions that are only available from the Shell.
Typically, the admin functions you need to perform on HBase are for when your tables aren't being used in the way you had expected, and performance is suffering. Hot spots where tables have more active data in one region than others can be rectified by manually splitting the table.
The split command can be used at different levels, either splitting a named region or a named table. When you split an existing table, it's often because you're better informed on how the data is distributed, and HBase lets you provide a split key for the new region, as in Code Listing 63:
Code Listing 63: Splitting an Existing Table
hbase(main):006:0> split 'access-logs', 'ej' 0 row(s) in 0.4650 seconds |
Figure 25 shows the table details from the Master UI, after the split where the original e region is now two separate regions:
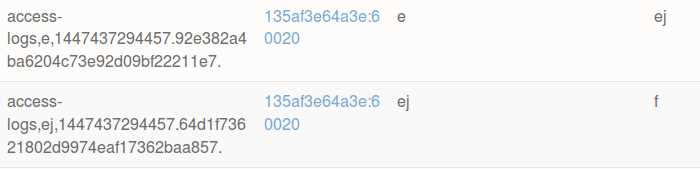
Figure 25: Region Splits in the Master UI
When a region is manually split, the new region will be on the same server as the original region. That preserves data locality, as the original data was all on the one server, but it doesn't help if you want to remove a hot spot and share the data across more servers.
Any time your regions are not well balanced (for example, if you've manually split them, or added new tables), you can force a rebalance using the balancer command, which runs with no parameters, shown in Code Listing 64:
Code Listing 64: Initiating the Load Balancer
hbase(main):007:0> balancer true 0 row(s) in 0.0680 seconds |
The balancer command returns true if it was able to start the rebalancing process. The balancer actually runs asynchronously, and will continue after command returns. If regions are already being moved by the Master from another process, you can't start a rebalance and the command will return false.
The final situation that can harm performance is if your regions are split into many Store Files, and/or you have poor data locality, due to regions being moved or servers being added to the cluster. To fix that you need a major compaction, which combines two or more store files into a single HFile for a region and column family, and ensures each HFile is local to the Region Server that is hosting it.
HBase will run major compactions on a schedule, approximately every 24 hours, which will impact performance if it happens during peak access times. If you know your data is fragmented, then it's better to run a manual compaction when the server load is low.
Compaction is started with the major_compact command, and you can compact a whole table, a column family, a region, or just one column family within a region. Code Listing 65 shows a compaction starting for the access-logs table:
Code Listing 65: Starting a Major Compaction for a Table
hbase(main):002:0> major_compact 'access-logs' 0 row(s) in 0.2990 seconds |
Compaction can take a long time, especially for large tables with many regions. The Region view in the Region Server UI shows you the compaction progress, but it all happens in the background and the compacting region(s) remain available to read and write while the compaction is running.
Summary
With embedded Web UIs in all the server processes, HBase gives you a lot of information on how the database is performing. Metrics are also collected using JMX, which makes it easy to plug them into a third-party monitoring tool like Ganglia.
The Thrift and Stargate UIs give you a basic overview to show how those servers are performing, but the Master and Region UIs give you rich insight into how your data is structured, and how it's being used. You can easily see hot spots where one Region Server is working harder than it should from the admin UIs.
With the HBase Shell you can rectify the more common performance problems, and we saw how to manually split tables, force the Master to rebalance regions across servers, and run a major compaction to optimize data at the storage level.
Next Steps
There's a lot more to HBase than I've covered in this short book, and plenty to explore if you think HBase will be a good fit for your next data store. The Docker image that accompanies this book is a good place to start if you want to try HBase out with your preferred client.
If you want to try HBase in a production environment without commissioning a suite of servers, you can run managed HBase clusters in the cloud with Elastic MapReduce on AWS, and HDInsight on Azure.
Both clouds offer a simple way to get started with a high-performance cluster, and with Azure you can sign up for a new account and try HBase on HDInsight free for one week. If you want to see how HBase works on Azure with other parts of the Hadoop ecosystem, I built a full solution in my Pluralsight course, HDInsight Deep Dive: Storm, HBase and Hive, which is out now.
83 |
- 1800+ high-performance UI components.
- Includes popular controls such as Grid, Chart, Scheduler, and more.
- 24x5 unlimited support by developers.