
Hadoop for Windows Succinctly®

CHAPTER 4
Hadoop Integration and Business Intelligence (BI) Tools in Windows
Hadoop Integration in Windows and SQL Server 2019 CTP 2.0
SQL Server 2019 v-next CTP 2.0 has the ability to read the native Hadoop Distributed File System (HDFS) in Microsoft Windows. Earlier aspirations of integrating Hadoop in Windows are now robust operational functionality. The SQL Server PolyBase Java Connector provides fully integrated querying of the HDFS, using T-SQL. Further enhancements include data virtualization, whereby the exporting of data from Hadoop to SQL Server is eliminated. Instead, you read the data live from the HDFS using SQL Server in Windows. In SQL Server 2019, fully integrated querying of Teradata and other relational and non-relational systems are also available.
PolyBase, which is at the heart of the preceding developments, supports Hortonworks Data Platform (HDP) and Cloudera Distributed Hadoop (CDH). I have tested the PolyBase functionality with the Syncfusion Hadoop distribution and can confirm it works with the Syncfusion platform in Windows. Please bear in mind that SQL Server 2019 v-next is a technology preview, so if you choose to follow along in this section, you do so at your own risk.
What do these developments mean for ETL and tools like Sqoop? Why spend time importing data if you don't need to? Microsoft has gone further with Hadoop integration in Windows and introduced big data clusters. Steps to install and configure them may seem complex at first, but you can quickly get used to them.

Figure 120: Accessing SQL Server Big Data Clusters using Azure Data Studio
Integrating Hadoop into Windows has implications for Windows BI users connecting to Hadoop data in Linux. Can the Hadoop integration used in SQL Server be taken advantage of by third-party BI tools in Windows? If the answer is “yes,” it provides an alternative for Windows users connecting Windows BI tools to Hadoop in Linux. For those who think SQL Server is not significant to Hadoop or Linux users, I'll address this directly.
The most successful SQL Server is SQL Server 2017 for Linux—it had over 7,000,000 downloads between October 2017 and September 2018.
Let's have a look at SQL Server 2019 v-next CTP 2; please bear in mind that it's a technology preview. You can download the .ISO file from www.microcrosft.com. When installing, make sure you choose the highlighted items shown in Figure 121. Ensure that the PolyBase Query Service for External Data and the Integration Services options are selected to install.
Please remember that, unlike older versions of SQL Server, SSMS (SQL Server Management Studio) is not installed during the installation—you have to install it separately yourself. SSMS v17.5 is available free from Microsoft, but includes no database engine.
We'll be connecting SQL Server 2019 with the Syncfusion Hadoop distribution we used previously. You don't need to install the machine learning options selected in the following figure; that was simply my preference. If you do choose to install them, you have to download them separately from a link provided during installation. Like SSMS, they are not included in the SQL Server 2019 installer, and the combined .cab files are quite large. After installation is complete, create a database in SQL Server called Hadoop4windows.

Figure 121: Installing SQL Server v-next 2019 CTP 2.0
Even if PolyBase is installed, you have to enable it for Syncfusion with the following code.
Code Listing 21: Enabling PolyBase for Syncfusion Hadoop distribution in SQL Server 2019
-- To enable the PolyBase feature exec sp_configure @configname = 'PolyBase enabled', @configvalue = 1; RECONFIGURE WITH OVERRIDE; -- To set Hadoop connectivity value to 7 for Syncfusion compatibility sp_configure @configname = 'hadoop connectivity', @configvalue = 7; GO RECONFIGURE; -- You MUST RESTART SQL SERVER after entering the preceding code. |
Imagine you have a Hadoop currency file that's updated as different jurisdictions trade in more and more currencies. You don't have to import it anymore; you can run it live in SQL Server. To achieve this, we'll upload worldcurrency.txt to a folder we create in Hadoop called ukproperty.

Figure 122: World currency text file in Hadoop
To access Hadoop data sources, we need to write some code in the query window in SQL Server. Connect to the Hadoop4windows database we created, and enter the code in Code Listing 22. This sets up external data sources, file formats, and tables in SQL Server.
Code Listing 22: Code to set up live connection to HDFS from SQL Server 2019
-- CREATE EXTERNAL DATA SOURCE USE Hadoop4windows GO CREATE EXTERNAL DATA SOURCE hadoop_4_windows WITH ( TYPE = HADOOP, LOCATION ='hdfs://127.0.0.1:9000' ) GO -- CREATE EXTERNAL FILE FORMAT USE Hadoop4windows GO CREATE EXTERNAL FILE FORMAT TextFileFormat WITH ( FORMAT_TYPE = DELIMITEDTEXT, FORMAT_OPTIONS
(
FIELD_TERMINATOR =',', USE_TYPE_DEFAULT = TRUE)); -- CREATE EXTERNAL TABLE USE Hadoop4windows GO CREATE EXTERNAL TABLE [dbo].[worldcurrency] ( [country] nvarchar(200) NOT NULL, [currency] nvarchar(100) NOT NULL, [alphabeticcode] nvarchar (100) NOT NULL, [numericcode] nvarchar(100) NOT NULL)
WITH (LOCATION='/ukproperty/', DATA_SOURCE = hadoop_4_windows, FILE_FORMAT = TextFileFormat ); |
Once your code has run, you should see the highlighted changes in SQL Server Object Explorer. Refresh or restart your server if you don't see them initially.

Figure 123: PolyBase and external resources enabled in SQL Server 2019
Note that you can see the dbo.worldcurrency table containing data from the worldcurrency.txt file in Hadoop under the External Tables section shown in Figure 123. It's a live connection, and you can query it live as you would any other table in SQL Server 2019. Right-click the table in SQL Server and select the built-in Select Top 1000 Rows query to see the output in the next figure. As SQL Server 2019, CTP 2.0 can read the items inside HDFS; you don't even have to create a table in Hadoop. With this way of working, you don't have to export updates to SQL Server; you just read the data live. Of course, you can still keep storing historic copies in Hadoop.
Use it like any SQL Server table; it's as fast as other tables when involved in joins, as opposed to the inherently slow joins in Hadoop.

Figure 124: Running live query against file in HDFS from SQL Server 2019 v-next CTP 2.0
You can also see the PolyBase group of objects in the Object Explorer in SQL Server, if you right-click the Scale-out Group and click the option Configure PolyBase Scale-out Group, you'll see what’s shown in Figure 125. This shows the PolyBase scale-out cluster instance head node, which is displaying Scale-out cluster server ready. You need to be running SQL Server Enterprise to designate a head node. You then set up compute nodes as desired to create a cluster.

Figure 125: PolyBase Scale-out group cluster instance
If you wanted to add clustering, you'd require multiple servers and a domain name server. You would then install instances of SQL Server on each server node. The next task is to enable PolyBase on each server and designate head nodes and worker nodes. If you click the highlighted + icon in the Configure PolyBase Scale-out Group window, you can invite another SQL Server 2019 instance into the scale-out group, as shown next.

Figure 126:Adding a worker node to a cluster scale-out group head node
For this to work, you have to designate an account you created in Active Directory as the account to run the PolyBase engine and data movement services. This is done during installation and is shown in Figure 127. You also need to install SQL Server 2019 as a compute node, and not a head node, as this will open the firewall for connectivity.
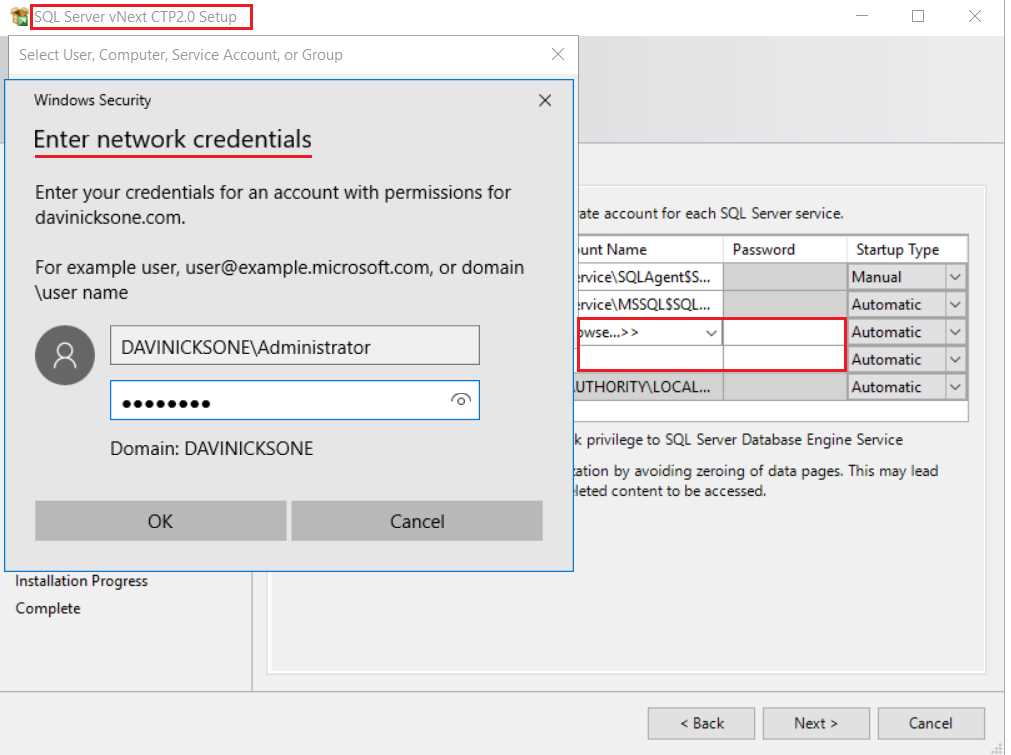
Figure 127: Designating accounts for PolyBase services in SQL Server 2019 installation
The installation will not continue unless you provide your network credentials, which you set up in Active Directory. You must use this account when installing SQL Server on each node in the cluster. The next figure shows an acceptable account setup for the PolyBase engine and data movement services.

Figure 128: Set up of accounts for PolyBase services in SQL Server 2019
The previous steps are important because the service instance I've just added to the scale-out group is now showing as compatible, as seen in Figure 129.

Figure 129: An imported server instance compatible with PolyBase scale-out groups
Had we not completed the steps outlined during installation, we would see a red icon denoting incompatibility, and the process would end here. You'd then have to reinstall the node correctly.

Figure 130: An example of an incompatible compute node instance
We can click the arrow to add the server instance to the scale-out cluster. As you can see in Figure 131, it's been added as a compute (worker) node, hence the different symbol.

Figure 131: Server instance joined to PolyBase scale-out cluster
This book is being written as these innovations from Microsoft are in technology preview. There is an emerging commitment from Microsoft to support Hadoop within Windows. It is almost as if they are compensating for the Hadoop developer community that Linux has, and Windows doesn't. The very portable and lightweight Azure Data Studio (80MB download), for example, can access Hadoop via the connection we just made in SQL Server 2019. We will look at Azure Data Studio in a bit more detail a little later. As it can connect to Hadoop, it becomes BI for Hadoop, albeit with a beautifully tiny footprint. It's also available for Linux and Mac, in keeping with Visual Studio Code, which is a small-footprint version of Visual Studio released by Microsoft.

Figure 132: The allure of Microsoft Azure, Azure Data Studio connecting to HDFS via SQL Server 2019
There could be those who take another view, namely that setting up SQL Server with PolyBase scale-out groups involves more setup time than Hadoop itself. In Windows there's also an upfront server cost, so is this setup appearing twice as expensive and complex? Remember, SQL Server is not free, just as Windows is not free. Here's a statement from a well-known Windows-based organization, summarizing why they don't use Hadoop for Windows.
"While possible, Hadoop for Windows would bring a lot of complexity."
It takes longer to set up Microsoft big dData clusters than Syncfusion Hadoop clusters or certain Linux Hadoop clusters. To be objective, we must remember that it’s only a technology preview at this stage. Also, the tiny footprint and simplicity of Azure Data Studio is a route that Microsoft is also pursuing. My hope, and I think the optimal solution, is for the two approaches to meet in the middle.
The choice of BI tools for Hadoop for Windows
In the previous section, I asked if Hadoop features integrated in SQL Server could benefit Windows BI tools. Was Microsoft's introduction of big data clusters an admission that traditional BI doesn't work well with big data? To answer these questions, we'll look at seven of the best namely:
- QlikView
- Tableau
- Power BI
- Azure Data Studio
- Arcadia
- Elasticsearch & Kibana
- Syncfusion Dashboard Designer
QlikView: http://www.qlikview.com/
QlikView at one time or another been the best selling and most popular BI tool. It has a Server and Desktop edition, and as far as big data is concerned, can connect to Hive from Windows via ODBC. There is also a Spark ODBC driver, and the software can run on a group of servers handling larger data sets.
It is recommended that QlikView be the only application running on an individual server, due to its heavy resource usage of RAM in particular. This is partly because it is an in-memory tool that relies heavily on data compression, native QVDs, and data aggregation. Direct Discovery within QlikView allows you to connect live to an external data source, but you can only work with a reduced feature set when using Direct Discovery.
Tableau: www.Tableau.com
Tableau has managed to take sizeable chunks of the BI market, and is arguably the second-biggest player behind QlikView in terms of purpose-built BI tools. Tableau comes in desktop and server editions but, unlike QlikView, is available for Linux. This is a more recent development, providing advantages like lower operating-system costs. Tableau connects to Hive via ODBC drivers, and is an in-memory application. It provides live connections to external data sources and has a wide range of data connectors, including Spark SQL. Tableau has excellent data grouping and classification tools that are part of a strong in-built feature set.
Power BI: www.microsoft.com
As we've already seen, Power BI can directly connect to the HDFS in Windows. It therefore gives deeper access to Hadoop than Hive data warehouse. It has benefitted from Hadoop integration across the Microsoft BI stack and wider Windows environment. A few years ago, I didn't use Power BI at all. Now it's indispensable, due to its native big data connectivity and tight Windows integration.
A new breed of BI for big data
Azure Data Studio: www.microsoft.com
Azure Data Studio seems like a sleek and lightweight design on the surface. Dig a little deeper, and there's a lot of power that can be tightly integrated with all Microsoft big data and database innovations. Azure Data Studio does this in part by using extensions that can be added to the application. You cannot access Microsoft big data clusters without extensions, for example. Importantly, Microsoft sees big data as a whole concept, not just Hadoop. In addition, Azure Data Studio is cross-platform: it works on the Windows, Linux, and Mac platforms. Azure Data Studio has something of a companion product in Visual Studio Code. Visual Studio Code is a lightweight take on Visual Studio, and is similar in appearance to Azure Data Studio.
Visual Studio Code has given the Windows command prompt a contemporary feel and new lease on life. It can be enhanced by using extensions in the same way Azure Data Studio does. Visual Studio Code, shown in Figure 133, looks almost identical to Azure Data Studio. Extensions for both pieces of software can be installed from the internet or downloaded for offline installation. You click on the three red dots, as shown in the following figure, to get the extensions menu. From here, click Install from VSIX, which is the file extension for the file extensions.

Figure 133: Microsoft Visual Studio Code
Arcadia: www.arcadiadata.com
Arcadia needs no help when connecting to Hadoop—there's no need to load ODBC drivers, as Arcadia connects to Hadoop natively. Arcadia also connects directly to the fast Impala query engine and runs on Windows and Mac. It's a BI tool built for big data, embracing data granularity, controlling data volumes, and accelerating processes. Join creation is automated, and connections to RDBMS and big data sources are supported. For some, it may be the only BI tool they need, because it meets requirements of scale of any BI task. It can also directly access Hadoop to run queries at very impressive speeds. Using Arcadia is like being in Hadoop itself. Add to that every visualization tool you'll ever need, and you've got Arcadia.
Elasticsearch & Kibana: https://www.elastic.co
While not originally designed to work with Hadoop, Elasticsearch can now use the HDFS as a snapshot repository. Support for the HDFS is provided via an HDFS snapshot/restore plugin. Elasticsearch and Kibana can, of course, search data in Hadoop and run just as smoothly on Windows as in Linux. Sure, the texts for these products are written around Linux, but this belies their integration with Windows. Elasticsearch 6.6.0 can be installed as a Windows service, and Kibana 6.6.0 has new features that allow the easy import of data files. The real strength of these tools is the ingestion and display of real-time and near real-time data. Their footprint is comparatively small, and installation is simple and speedy. You can also very tightly manage the resources allocated to nodes and clusters within your installation.
Cloudera and Hortonworks in Linux: hortonworks.com, cloudera.com
It's important for Windows products to compare well against their Linux counterparts. Sadly, the absence of Impala on the Windows platform is currently a problem. In a project unrelated to this publication, I have been in contact with the Impala developers on this subject.
Outside of Microsoft big data clusters, what tools are there for fast queries involving joins? What if you don't want to use SQL Server—what other choices are out there? All too often, the other choices involve using Linux products, even if it means learning a new system.
Cloudera CDH is a Hadoop release you'd struggle to create in Windows, as key functionality isn't available. If Syncfusion could put Impala in their Big Data Platform they would; currently, however, it isn't possible. I haven't mentioned it until now, but the exercises I've been doing in Windows are exercises I've duplicated in Hadoop on Linux. We'll see some of this work later on in the chapter. I did this because it's important to identify features that may benefit Hadoop in Windows. You'll recall that I mentioned cgroups and updating ecosystem elements like Hive, as new versions become available.
Cloudera and Hortonworks have features you'd be pleased to see in Windows solutions. Hadoop for Windows should take more advantage of the interactive nature of Windows. This is because the best Linux Hadoop distributions are more interactive than they used to be. The older, rather "wooden" Linux Hadoop is being replaced by sleeker, more modern designs. Microsoft has observed this and given Azure Data Studio a contemporary feel that you can change at will. You'll see some of this as we go further into this chapter.
Connecting BI tools to Hadoop in Windows
QlikView
A key benchmark for Hadoop in Windows is the ability to connect live with Hadoop. QlikView connects live to data sources with Direct Discovery, but you lose certain functionality. Direct Discovery also requires different code scripting. Some other BI tools, like Tableau, achieve it by just clicking a button.
The features unavailable with Direct Discovery include:
- Advanced calculations
- Calculated dimensions
- Comparative Analysis (Alternate State) on QlikView objects using Direct Discovery flds
- Direct Discovery fields are not supported on Global Search
- Binary load from a QlikView application with Direct Discovery table
- Section access and data reduction
- Loop and Reduce
- Table naming in script does not apply to the Direct table
- The use of * after DIRECT SELECT on a load script (DIRECT SELECT *)
To see if we can access the HDFS live without restrictions, we'll connect to SQL Server via Edit Script. Click Connect and enter the login details for SQL Server, as shown in Figure 134.

Figure 134: Connecting to SQL Server 2019 from QlikView
Click Test Connection before proceeding. You should see the Test connection succeeded message displayed, which tells you you've successfully made connection with SQL Server. The connection to SQL Server 2019 has allowed direct access to Hadoop via the external table that we created called worldcurrency. The Preview facility displays the data, as shown in the following figure.

Figure 135: Hadoop file being read live in QlikView via SQL Server 2019
The load script is then executed to load the data into the application, as shown next.

Figure 136: Script is run within QlikView to load Hadoop data into the application
Though we were able to connect to Hadoop from SQL Server, the action of loading the script ensures we can't ingest live data without the limited Direct Discovery. The way it works means you essentially work from extracts; you would need to reload data to pick up any changes. While we can create dashboards, as shown in Figure 137, we don't have the live connection to Hadoop we desire or could have. Like so many BI tools not built for big data, we're importing data due to the limits of the BI tool. Direct Discovery compensates for the fact that QlikView wasn't built for big data analysis. Sadly, the unavailability of key functionality is counterproductive. The restrictions of Direct Discovery previously listed are also not the only restrictions. You cannot use pivot charts and mini charts, for example, and there are performance-tuning issues that must be dealt with at the data source.
We could load the data into QVD files for fast load times and high data compression. You'd still be loading extracts though, albeit much faster and with functionality unavailable in Direct Discovery. Organizations I've worked at with multiple QlikView servers never considered using it for live connections.

Figure 137: Maybe it's live, maybe it's not: QlikView visualization from loaded Hadoop data extract
Tableau
Let's see if Tableau fares any better than QlikView when attempting to connect live to the HDFS. Connecting to SQL Server from Tableau is a straightforward task. You can't help but notice the large number of other connectors available.

Figure 138: Connecting to SQL Server 2019 within Tableau
After connecting to SQL Server from the preceding screen, you should see what’s shown in Figure 139. It is very different from what we saw in QlikView at the same stage.
The first thing we notice is the "Live" connection, indicated at the top-right side of the screen. Tableau has also identified the live worldcurrency table from the HDFS file data. Tableau achieves this by sending dynamic SQL to the source system rather than importing it. Advantages to this approach include less storage space, as you avoid duplicating source data in the BI system.

Figure 139: Live connection to SQL Server from Tableau connecting directly to HDFS
Live connection does not mean a reduced feature set; without being connected to the internet, you can map data from the countries listed in the Hadoop data file.

Figure 140: Features are not restricted when using live connection in Tableau
Tableau has passed the test with flying colors—there was no discernible difference in performance, and you'd never guess you were connecting to raw Hadoop. So, the work from Microsoft to integrate Hadoop into SQL Server can benefit third-party BI tools.

Figure 141: Tableau dashboard created from live connection to HDFS
Tableau perhaps reflects both sides of the story: the ability to connect live to Hadoop within Windows, and now, producing Tableau for Linux. Tableau Server for Linux has integrated well with SQL Server for Linux, which is making a big impression itself. Perhaps the lines are becoming blurred, and the future is not as black and white as Windows or Linux. The efforts of Microsoft to build the WSL (Windows Subsystem for Linux) is perhaps the strongest indicator of this. The ability to access both environments from within one environment is a noble aspiration, though the reality may be more difficult to achieve.
Power BI
We've already seen Power BI in Chapter 1, so we know what it can do. That said, I can confirm that Power BI can take advantage of the live SQL Server connection to HDFS by using Direct Query. Direct Query allows you to access data directly from your chosen data source. It's enabled by clicking the DirectQuery button highlighted in Figure 142. This eliminates the need to import data by giving you a live connection to interrogate larger data volumes.

Figure 142: Power BI live connection to SQL Server to read HDFS files live
Power BI can also access the Impala high-speed query engine in Linux. It's interesting to note that there is no Hive connector in Power BI. Microsoft has confronted the problem of slow query speed with joins in Hive, and gone straight for Impala. If you really want to use just Hive, you can use an ODBC connection.

Figure 143: Power BI live connection to Impala via the direct query mechanism
Azure Data Studio
I've commented on Azure Data Studio and how to expand its feature set by adding extensions. I didn't mention its ability to tightly monitor its own resource use and container-like nature; everything seems to fit or work in a neat, lightweight box.

Figure 144: Azure Data Studio with extensions installed
Azure Data Studio can connect to our live HDFS connection in the most versatile way. This is achieved by using the SQL Server 2019 extension highlighted in Figure 144, and deployed as shown in Figure 145.

Figure 145: Deployed Azure Data Studio extension for SQL Server 2019
One of the features within the extension is the ability to create external tables. Does it reveal the thinking of Microsoft? Why should you have to be in a system to create a table? Shouldn't there be an ability not just to exchange data, but to design the components that hold it?

Figure 146: Create external table in Azure Data Studio
Security issues have been overcome by the creation of a database master key to secure the credentials used by an external data source.

Figure 147: Creating database master key in Azure Data Studio
The following figure shows the Azure Data Studio Server dashboard. The four SQL Server extensions installed are highlighted in red. You can view and search for other databases, including our highlighted Hadoop4windows database. You simply click on each extension to access its functionality.

Figure 148: Azure Data Studio Server Dashboard
In order to connect to a server, you need to click the server symbol, as highlighted in Figure 149. You will find it on the top, left-hand side of the screen.

Figure 149: Making a connection to SQL Server 2019 in Azure Data Studio
You are then taken to the login screen, as shown in the following figure.

Figure 150: Azure Data Studio login
The two fields highlighted show the server and the individual database login fields. We then enter server name and port number, after making sure the Server is configured to accept remote connections. This includes allocating a port number for SQL Server to accept connections on. If you don't do this, you may only be able to connect to a local server. After you log in, you see the server dashboard screen we saw earlier, plus more details on the left-hand side. You see additional folders, including server objects and endpoints, as shown in the following figure.
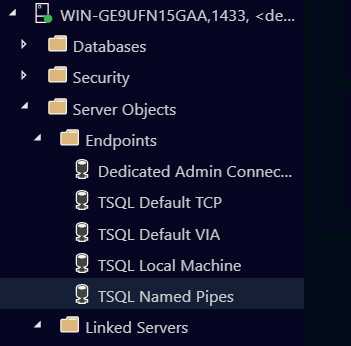
Figure 151: Azure folders showing server objects and endpoints
When you're in Azure Data Studio, you can change the look and feel of the app completely. You can also access the live Hadoop data connection we created, as shown in Figure 152.

Figure 152: Live connection to HDFS from Azure Data Studio
The problem of slow joins in Hadoop is eliminated in the Microsoft big data solution.

Figure 153: Fast execution of Hadoop queries involving joins as fast as Impala
In the preceding figure, you can see the additional table among those highlighted, called worldinformation. The tables are followed by the word external, as they are live connections to Hadoop. Running a query joining that table to our worldcurrency table was executed in 00:00:01.252 seconds. In any version of Hive in any Hadoop release, this would take at least a few minutes. This is one of the reasons why some people prefer what Microsoft is doing with big data and Hadoop. I'm able to do all this from an 80-MB app that is around 400 MB when installed, plus extensions. It's a lot of bang for your buck, or it would be if it wasn't free of charge on Mac, Linux, and Windows. The fun doesn't stop here: you can create dashboards from your live Hadoop queries. Charts are created "on the fly" and shown on the Chart tab, as highlighted in Figure 154. You can make as many charts as you wish to populate your dashboards.

Figure 154: Live charts based on the results of high speed Hadoop queries with joins
The power of the app is such that you can change the visualization types in an instant on screen. You don't have to go to a separate area or separate mode of operation—they are instant, on-screen changes.

Figure 155: Instant changes of visualizations using Azure Data Studio
Arcadia DATA
Arcadia comes with everything you need to connect to Hadoop contained within it.

Figure 156: Arcadia Data, the server is running
After installing Arcadia, click the Start button shown in Figure 156. You see a message displaying Server is running, at which point you click Go. At this point you must register the product, or you cannot proceed. You then create a Hive connection in Arcadia, as shown next.

Figure 157: Hive connection in Arcadia, requires hostname, username and password to Hive
With your connection created, the Connection Explorer locates the databases in Hadoop and lists all the tables in them.

Figure 158: Arcadia Connection Explorer
The connection to Hive is a live one, and Arcadia is an interactive experience. You drag and drop the fields from your tables into dimensions and measures to create visualizations. This is shown in Figure 159, where the fields highlighted in the red rectangle are dragged into the fields highlighted in the green rectangle.

Figure 159: Creating visualizations in Arcadia Data
Arcadia is a new breed of tool that brings high quality visualizations to live, big data systems. With tools like Arcadia, you can do everything in one system; there's no ETL, as you don't have to move the data.
At first glance, Arcadia is very capable of connecting to live Hadoop instances and creating visualizations. We have looked at Arcadia 2.4, but when we revisit it, we'll look at Arcadia 5.0. We'll see if progress has been made by this tool designed to work with big data.

Figure 160: Arcadia dashboard visualizations
Elasticsearch & Kibana
Whilst it's known that Elasticsearch now uses the HDFS as a snapshot repository, it’s less well-known that Kibana is being developed to ingest data commonly found in BI tools.
Many tools that were once the domain of Linux are now established on the Windows platform. Kibana and Elasticsearch are welcome additions to that group of products. The Windows installer may have made their installation painless, but launching both tools is still done via the command line. In Elasticsearch 6.6, the startup is automated by clicking the icon that appears after installation. You also have the option of installing it as a service with this release. You always run Elasticsearch before Kibana. After launching Elasticsearch, you'll see the following screen.
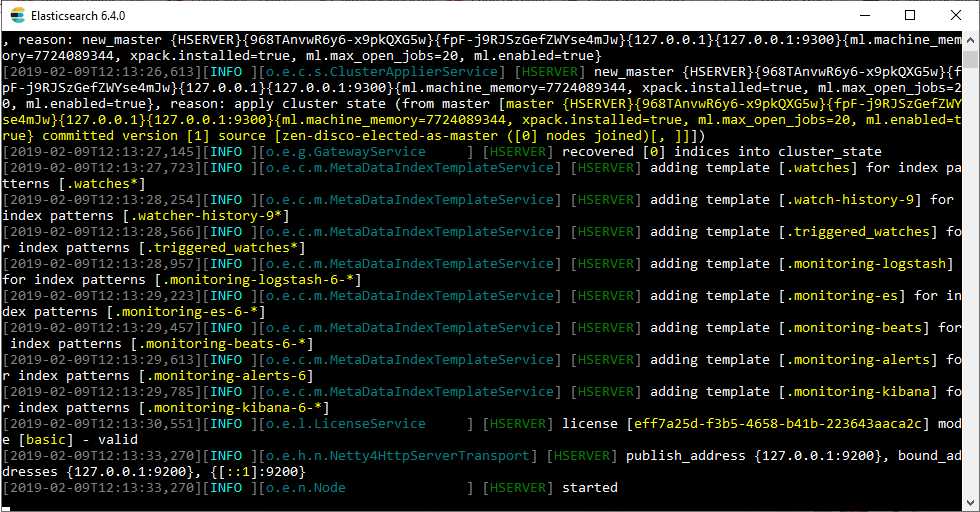
Figure 161: Elasticsearch started in Microsoft Windows
Now do the same for Kibana, but by running the .bat file in the bin folder of your installation. The next screen should then appear.

Figure 162: Kibana Server started and now active in Windows
The browser address to access Kibana is highlighted in red in Figure 162. The link shown is http://localhost:5601. After accessing the link, you'll see the screen shown in Figure 163. You're immediately invited to ingest data logs, operating system metrics, and much more. This is perhaps the Kibana and Elasticsearch sweet spot: ingesting data generated by the hour, minute, or second.

Figure 163: Kibana 6.6 main screen
You can use the experimental feature to import data outside of the JSON format. These are perhaps the first steps in not just utilizing Hadoop for snapshots, but for "front-loading" Hadoop data for BI purposes. The experimental Import feature is shown on the following screen.

Figure 164: Front loading data into Kibana, the experimental Import data feature
This allows you to easily create outputs from a wider range of custom data sources in Windows.

Figure 165: Kibana dashboard using data from experimental Import data tool
Syncfusion Dashboard Designer
The Syncfusion Dashboard Designer is made by the same company that produced the Syncfusion Big Data Platform. We'll look at Syncfusion Dashboard Designer in the final chapter, when we see how BI tools perform with larger data loads. Only the 4-GB Land Registry file we downloaded earlier will be used in the final section. First, let's look at elements of Hadoop in Linux that I'd like to see in Windows.
Three features from Hadoop in Linux I'd like to see more of
While this is a book about Hadoop for Windows, we should be aware of Hadoop on Linux developments. In Cloudera (CDH), Impala is the default query editor engine. When you use Query Editor you immediately access Impala to write queries. Figure 166 shows the same query with joins that we ran earlier; it joins the Ratings table and the Episodes table. You could run this query in any version of Hive or Pig, and it would take a good few minutes. Our figure highlights the 4.31 seconds it took in Impala. The joined tables presented no problems and near-relational database speeds were achieved.

Figure 166: Impala running in Cloudera CDH on Linux
Cloudera offers basic graph and dashboard facilities within the Hadoop environment. You don't have to leave Hadoop to produce quick graphs and tables on Hadoop data. Some companies’ tools are better than others, but it's a trend I expect to see continuing. The Cloudera offering is shown in Figure 167, and can auto-generate graphs from tables containing math elements. You can also build various visualizations from your chosen columns.

Figure 167: Basic visualization facilities in Cloudera CDH
The Hortonworks Linux platform has a function that would benefit any Hadoop distribution: automatic creation or removal of the first row as a header for data. The ability to define delimiters would also grace any Hadoop distribution.

Figure 168: Automatic creation or removal of column header and defining of delimiters
- 1800+ high-performance UI components.
- Includes popular controls such as Grid, Chart, Scheduler, and more.
- 24x5 unlimited support by developers.