
GitHub Succinctly®

CHAPTER 9
Viewing a Project
When the results of a search are displayed, there’s a lot of information included in the repository list. This information can give you an idea of how well received the project is and how actively it’s being worked on.
Search Results
The following example is from a search of JavaScript code that works with the HTML Canvas. three.js is a JavaScript library that lets you do 3D drawing and animation on the HTML 5 Canvas. It’s designed to be simple to use, yet is a pretty powerful library for 3D work.
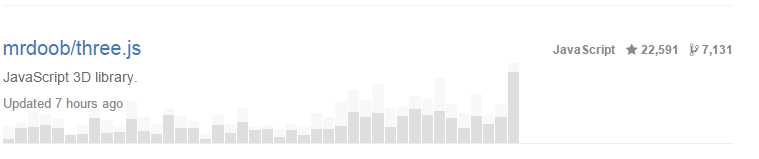
Figure 46: Search results
A look at the search results shows some information that might help get a sense of the project.
Repository Name
In Figure 46, the mrdoob/three.js is the owner and name of the repository. If you open the repository window, you will be able to click on the owner’s name to find out more about him or her, and possibly other repositories they might have. For example, opening one of my projects (KeeperSparky) will show you the two projects I’ve uploaded while working on this book.
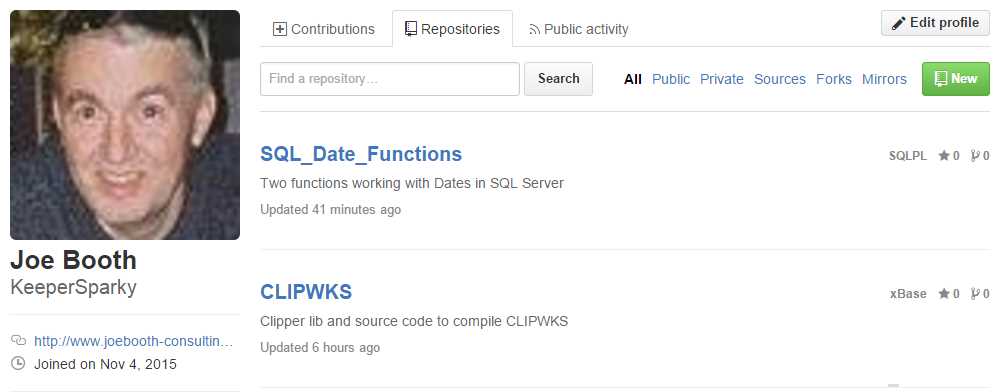
Figure 47: Owner profile
In case you’re wondering, it’s “KeeperSparky” because I play soccer goalie and had the nickname Sparky (Radar’s friend from M.A.S.H.) during my college days.
Language
In the right-hand top corner, you see three pieces of information: the language the project is written in, the number of stars (positive ratings by GitHub users), and the number of forks (people enhancing or working on the project).
Note: Forks is a historical number tracking all forks since the repository was first added (not 7,000 active forks).
Last updated
Under the repository name and description is an indication of when the repository was last updated; in our example, it was updated 7 hours ago. This is generally a good indication that the project is pretty active.
Participation graph
Below the description and last updated information is the participation graph. The graph shows activity in terms of commits to the repository, from both the owner and contributors.
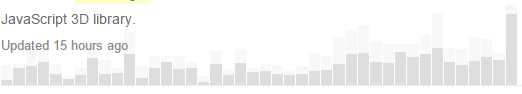
Figure 48: Participation graph
The owner and contributors making the commits are differentiated, so a project like the above shows lot of activity, both from Mr.Doob and the 519 contributors…
Repository details
Once you click on a repository, there’s a lot of information presented, and a lot of interaction you (as a registered user) can do with the repository. We will cover the various screens in this section to help guide you to the options you might be interested in.
Social interaction
The bar at the top of the page shows the repository owner and name on the left, and three buttons on the right.
![]()
Figure 49: Top bar of repository
Watch
You can watch it (be notified of all activity) it, you can ignore it (never see any notifications), or you can “not watch” (only see notifications specifically mentioning your user ID or that you are explicitly participating in).
Star
The Star is similar to the Like button in Facebook; it generally means you’ve used the project and like it. You can star or un-star at any time by toggling the Star button. The number to the right shows how many users have “starred” or “liked” the project.
Fork
The Fork option creates a copy of the repository for your user ID (it will appear with your other repositories showing the fork icon instead). A fork is generally a copy you wish to either contribute to or to start your own project based on. You can download a project if you simply want to use the code, without creating a fork.
Repository actions
Just below the repository name is a set of tabs showing various views of the project. In addition, you can see the number of commits (updates over project life), branches, releases, and contributors.
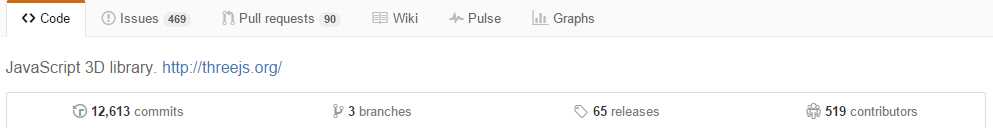
Figure 50: Repository actions
Code tab
The <> Code tab is the default selected view when you find a repository. You can see the actual files and any subfolders that exist in the repository.
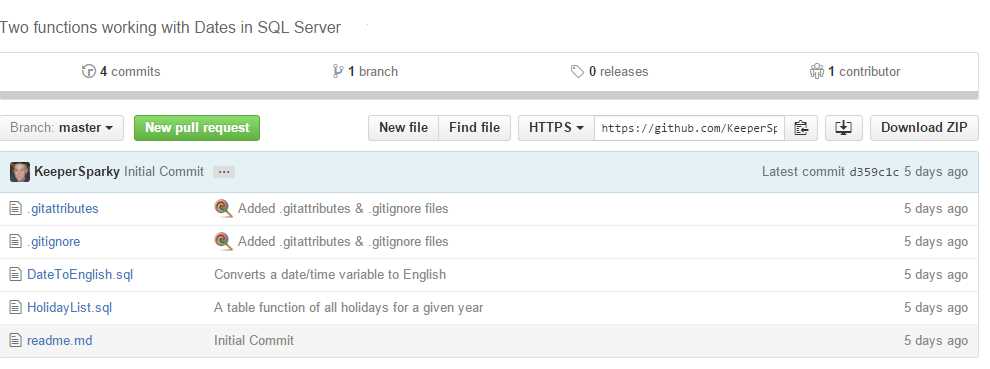
Figure 51: Code tab
The very top line shows the summary line that was added when repository was first created. If you’re the owner of the repository, you’ll be able to edit this line within GitHub.
The next line shows the activity on the code within the repository (the number of commits, branches, releases, and contributors). You can click on each item to see more details. For example, if we look at momentjs (a JavaScript time library), we find 90 contributors.

Figure 52: Contributors
The screen shot in Figure 52 only shows the top two contributors (based on number of commits) but GitHub will show all contributors (within reason; if a project has hundreds, GitHub will warn you and not show them all). Next to each person’s name is the number of commits, followed by the number of lines added (green) and the number of lines deleted (red). GitHub offers a lot of number crunching and graphs to explore.
Issues tab
Clicking on the Issues tab brings up a searchable list of issues associated with the repository. You can also create a new issue by clicking on the green New issue button.
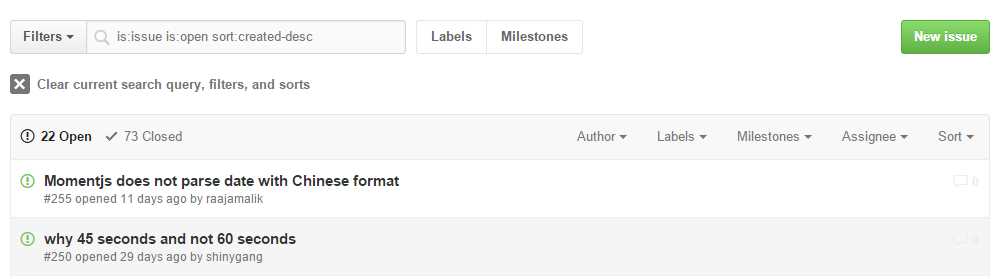
Figure 53: Issues
From this screen, you can filter the issue list by clicking on the drop-down arrows next to Author (creator of the issue), Labels (such as bug, enhancement, new icon, etc.), Milestones, and Assignee. You can also sort the list by date and number of comments added to the issue.
The left side allows you to toggle between open and closed issues.
The Filters dropdown menu lets you search the issue list for issues you’ve created, issues that have been assigned to you, issues mentioning you, etc.
When you are writing an issue, be sure to provide enough detail to make it clear what you are reporting. If it’s a bug, include steps to reproduce it. If it’s a feature request, be sure to make it clear what you want added or enhanced. The following example shows a clear issue written to the momentjs library.
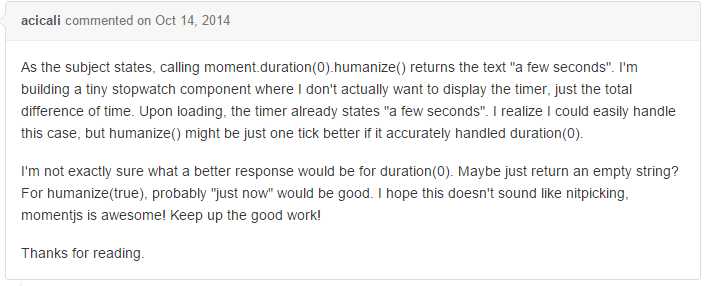
Figure 54: Example issue
Pull requests
A pull request means that a fix has been made in response to an issue, and the collaborator is requesting that the fix be merged back into one of the branches. Figure 55 shows a sample pull request list.
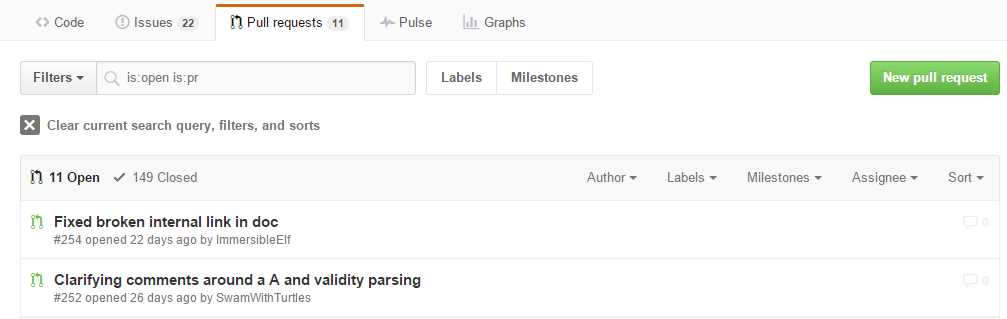
Figure 55: Pull request list
Pull requests have similar filtering and sorting options to the Issues tab (such as Author, Label, and Milestone).
When you open a pull request, the first line shows the request as a comment.
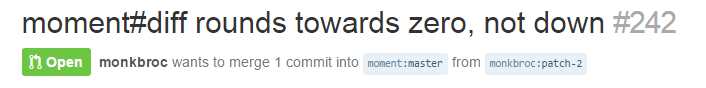
Figure 56: Pull request description
In this example, the user monkbroc has updated his forked version (monkbroc:patch-2) and is requesting that his commit to his fork be merged into the master branch for the project.
You might also see other types of descriptions with the pull request. For example, Figure 57 shows a closed pull request that was merged back into the main branch.
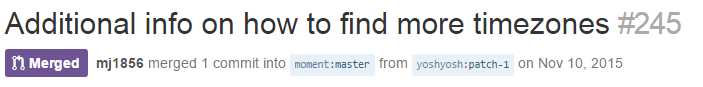
Figure 57: Merged pull request
However, not all pull requests get merged into the master branch; in Figure 58, the pull request was closed without being merged. It’s up to the repository owner to accept and apply any pull requests.
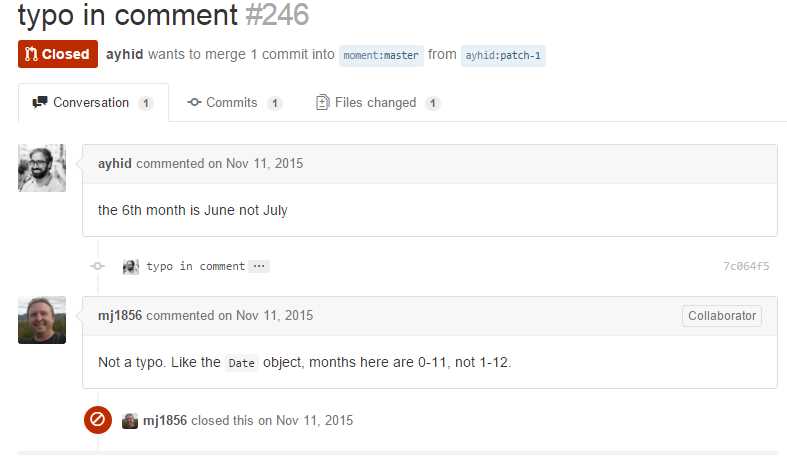
Figure 58: Example of closed pull request
On the pull request list, the different icons indicate the status of the request.
On the next line, you’ll see three tabs. The first tab, Conversation, shows the various issues and comments associated with the request.
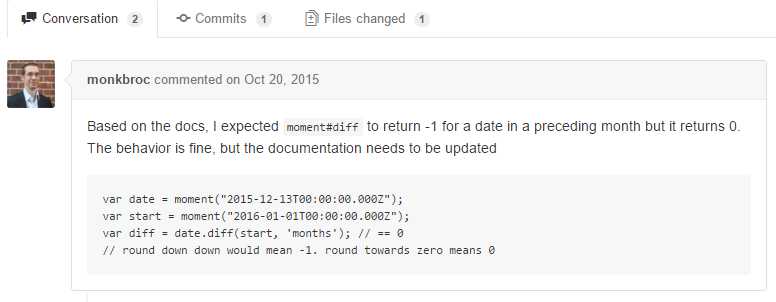
Figure 59: Pull request conversation
This tab allows you to see the original issue and subsequent comments.
The next tab, Commits, shows any commits to their forked branch that have been made by the collaborator. This shows the date and commit message from the fork.
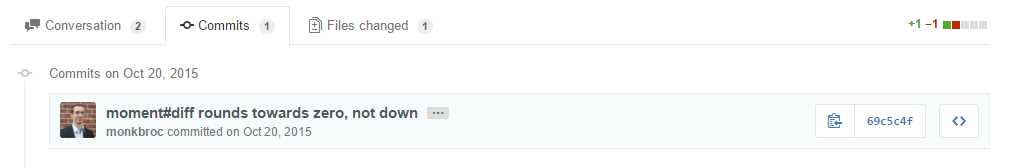
Figure 60: Commit message
The color-coded numbers show the number of lines added and removed during this commit.
The final tab, Files changed, shows the details as to exactly what was changed in the file(s) with this commit. This allows the owner to see whether or not she wants to accept the pull request.
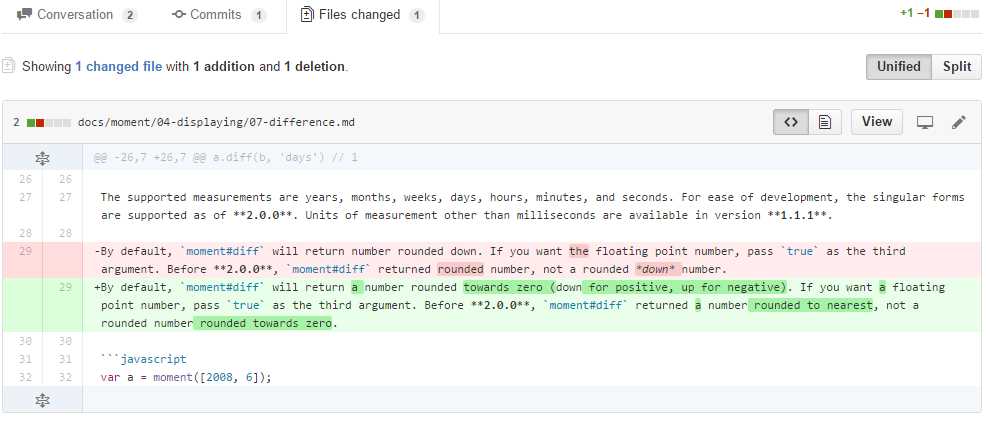
Figure 61: Change details
By default, GitHub shows a Unified view of the change, but you can click the Split button to show the two files side by side, for another way to view the change.
One nice feature that GitHub reports to assist the repository owner is a status as to whether or not the pull request conflicts with the base branch.
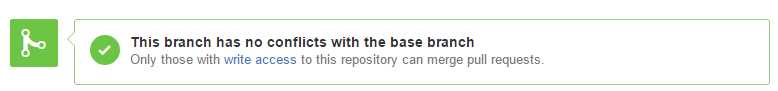
Figure 62: Conflict report
All of the information present as part of the pull request helps the repository owner decide whether or not to merge the request back to the main branch.
Wiki
GitHub allows you to create and maintain a Wiki about your repository, although this is an optional feature. If you have a Wiki, a tab will appear to let the repository viewer see the Wiki. A Wiki is a good source for ongoing documentation about a repository. The readme.md file provides a good introduction, while the Wiki can detail how to use the code in much more detail.
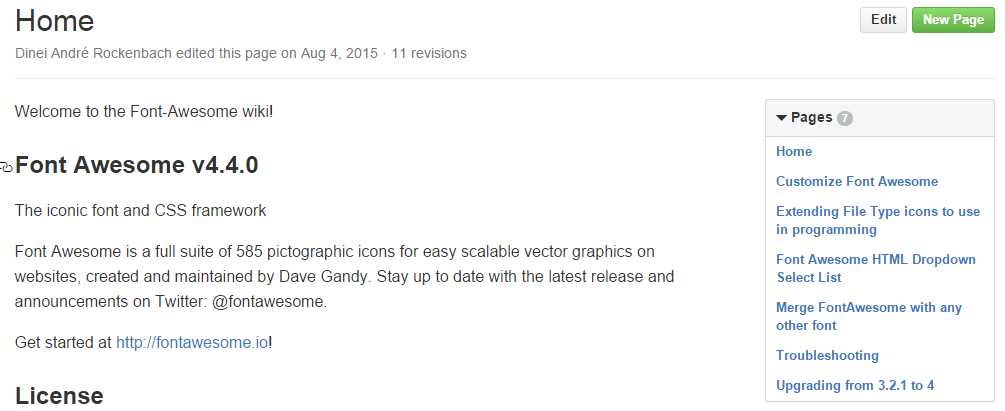
Figure 63: Font Awesome Wiki
Wiki content is tracked, so you can review revisions to see what has changed in the Wiki over time. Wiki content and be updated just like any other repository, with pull requests to merge changes back into the Wiki.
Wiki editing provides a number of different formatting options, the default being Markdown, but many other Wiki editors are supported. The screen below shows the basic editor for Wikis.
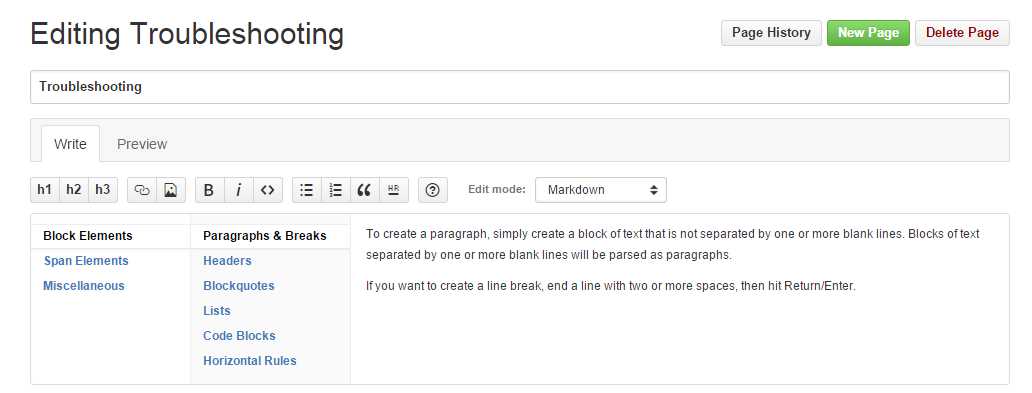
Figure 64: Wiki editing
Wiki content is collaborative, allowing multiple users to enhance the Wiki and improve the documentation on the repository.
Pulse
The Pulse tab shows an overview of activity in the repository over a period of time (the default being the last week).
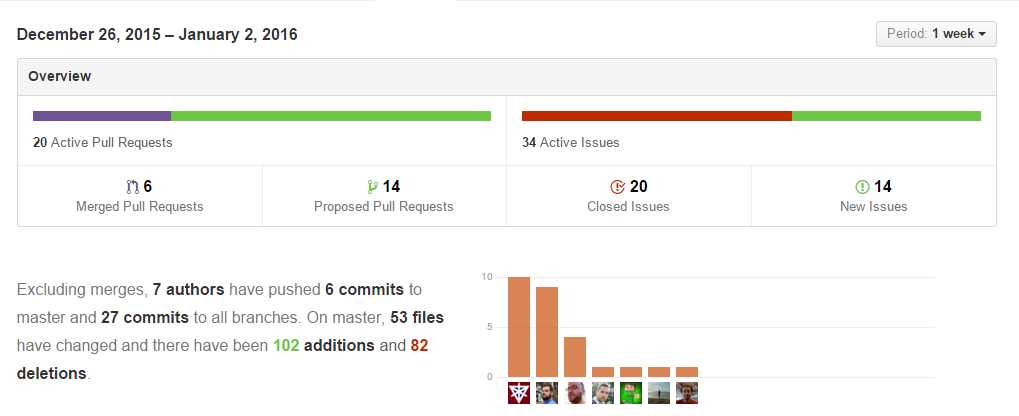
Figure 65: Pulse
The top section shows the pull requests, both merged and proposed, and the active issues, both closed and new. You can click on any of the areas to get a list of all items making up the activity.
Below the summary is the information on the collaborators involved this activity period. You can click the picture below the graph bar to see that user’s account page.
Finally, below the summary information at top is a list of all pull requests and issues within this activity period.
The Pulse tab gives you a sense of how active the repository is; this example represents one week’s activity in Bootstrap.
Graphs
The Graphs tab shows a variety of data about the repository, its contributors, activity, etc. The menu across the top shows the various graphs that can be displayed:
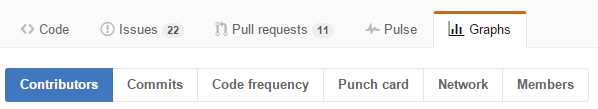
Figure 66: GitHub Graphs menu
The Contributors graph shows the most active contributors to the project and the commits they’ve made during the project’s lifespan (it’s the same page you get when you click on the contributors link while view the code).
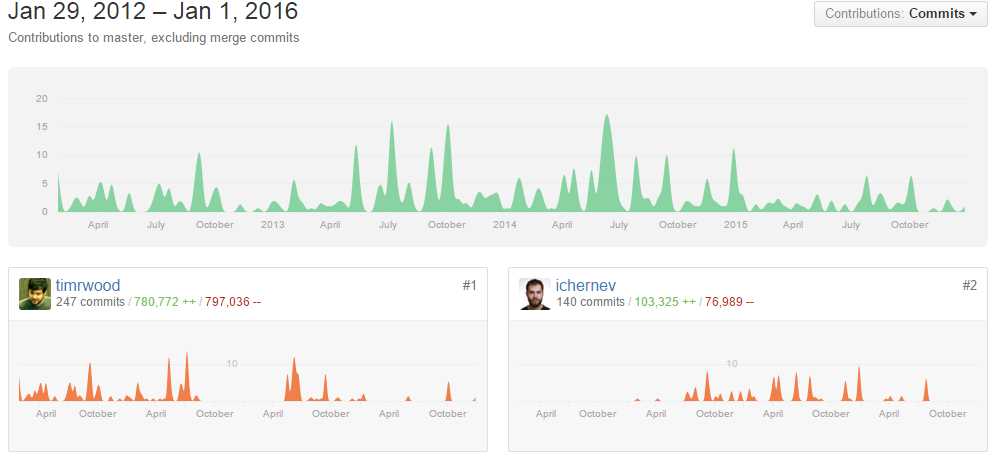
Figure 67: Contributors graph
The Commits graph shows two graphs; the top one is a bar graph of all activity to the project in the past year. The bottom graph shows the average number of commits per day.
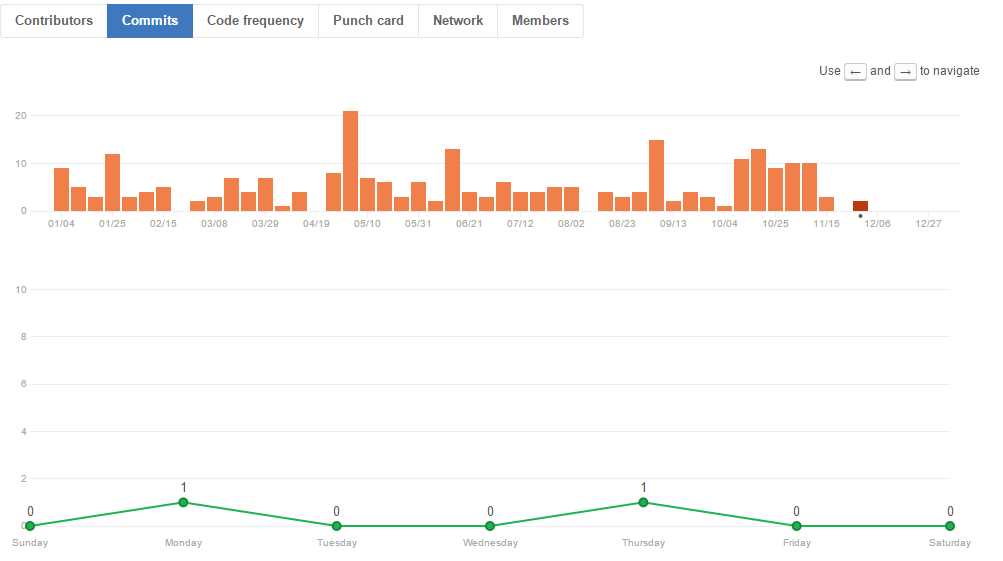
Figure 68: Commits graph
The top graph gives you a sense of how active the project is, while the bottom graph shows what days of the week get the most work done.
The Members graph shows all forks of this repository.; it shows the users and their forks. You can click on the user name to see that user’s account details. You can also click on the fork name to visit that user’s fork of the repository.
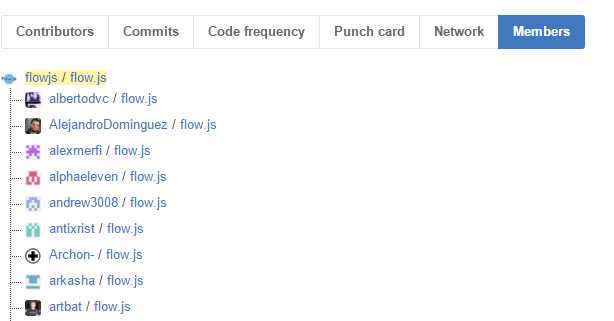
Figure 69: Members graph
Sometimes, if the fork/contributor list is too large, GitHub will show its colloquial sense of humor, and only show some of the forks.
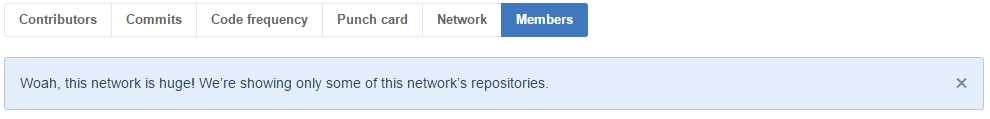
Figure 70: Bit too big
There are other graphs available to show statistics about the repository and its activity. You can visit this link to read about all of the graphs.
readme.md contents
Below the list of files in the repository is the content of the readme.md file. This file should provide a good overview of what the repository is about, how to install and use it, etc. You will find all kinds of readme files on GitHub; some are complete user manuals, while others are a couple lines telling you how to install the software.
At a minimum, I would provide a short (one-paragraph) summary of the code, and how to get it installed (minimum requirements). This at least can whet the appetite of the user. You can then either provide much more detail (in the remainder of the readme file) or as a separate documentation file in your repository.
Summary
There’s a lot of detail in this chapter about the information GitHub provides about the repositories. You should be comfortable knowing how to use this information to help decide if a particularl repository can help your application, and if you can contribute back to the code base.
In the next chapter, we will talk about how to obtain the code for either your own personal use or with the intent of getting involved with the project.
- 1800+ high-performance UI components.
- Includes popular controls such as Grid, Chart, Scheduler, and more.
- 24x5 unlimited support by developers.