
GIS Succinctly®

CHAPTER 5
Creating a GIS application in .NET
So finally we come to the part most of you have been waiting for: the creation of a small GIS-enabled desktop application in .NET.
In this chapter I use Visual Studio 2010 Ultimate for any screenshots, and my code is in C#.
For anyone who has used any of the Microsoft .NET languages and editors, it shouldn't be much of a problem for you to adapt what I show here to the environment you are working in.
Downloading SharpMap
Before we do anything, we need to download SharpMap; it is the GIS framework we'll be using. Since SharpMap is currently undergoing a lot of changes and general refactoring, it's better to download the source files from SVN and compile your own version than it is to use the pre-compiled downloads.
In your browser, navigate to http://sharpmap.codeplex.com/ and click the Source Code tab. Click Download to get the latest changeset as a zip file—it's approximately 180 MB. Or you can click Connect to get the addresses to connect to either the TFS or SVN repositories using regular clients.
Once you have the sources synced or unpacked onto your hard drive, start Visual Studio, open the trunk folder, and open the SharpMap.sln solution.
Once everything is loaded, the Solution Explorer should appear as it does in the following screenshot:
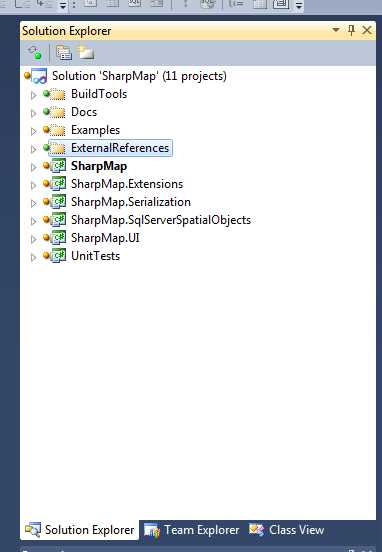
Figure 68: SharpMap Solution
If everything loaded OK, you should be able to click Build Solution to get the current binaries. I generally build all the configurations, so I select Release then Build, Debug then Build, and so on. What you choose to build is up to you though.
Once everything builds successfully, you're ready to close this project and start on your own.
Creating Our Own SharpMap Solution
Run an instance of Visual Studio or reuse the one you still have open, and create a new Windows Forms app.
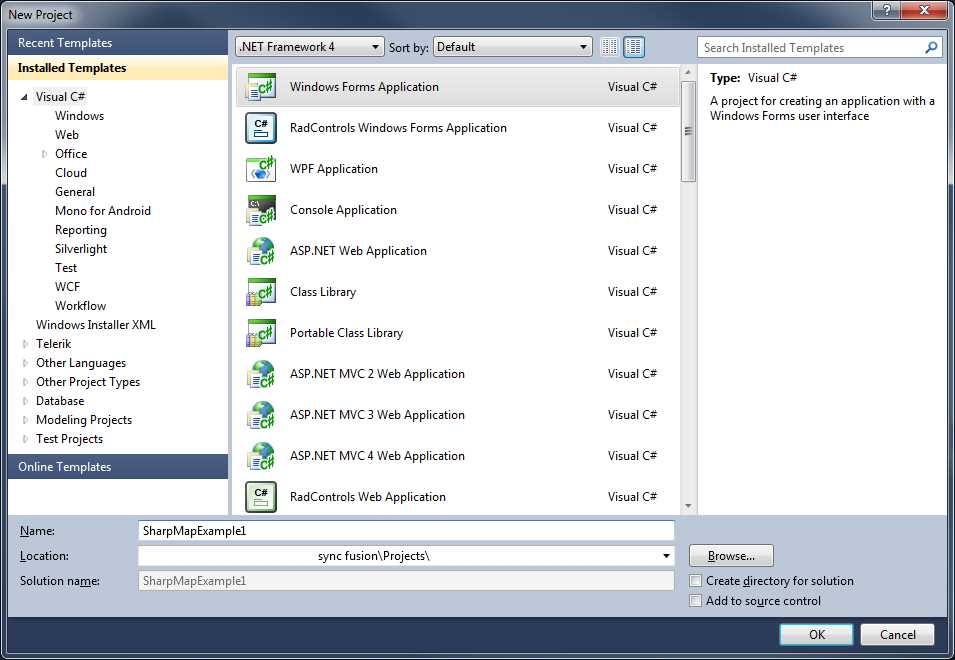
Figure 69: Starting a New Windows Forms App
Make sure you’re using .NET 4. The current version of SharpMap is targeted at .NET 4 and above.
The first thing you need to do is double-click on Properties in the Solution Explorer and change the selected Target framework from .NET Framework 4 Client Profile to the full .NET Framework 4.
|
|
Figure 70: Changing the Target Framework | |


Now we need to add the SharpMap UI components to our toolbox. Double-click Form1.cs in the Solution Explorer to load the toolbar palettes. Right-click in an open area below General and select Add Tab. Give the tab a name. In my application, I called the tab SharpMap.
Once the palette is created, expand it and right-click the Palette area. Select Choose Items from the menu that appears. The Choose Toolbox Items dialog should appear.
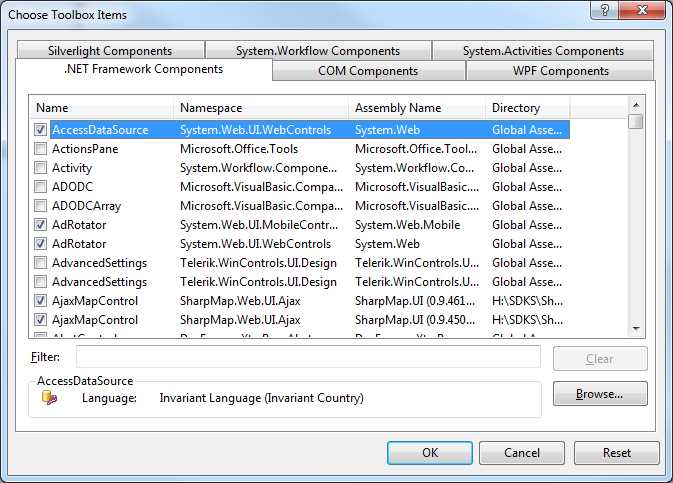
Figure 71: Choosing Toolbox Items
Click the Browse button and navigate to the location where you unpacked the SharpMap toolkit. Navigate to SharpMap.UI > bin > Debug, and then select SharpMap.UI.dll.
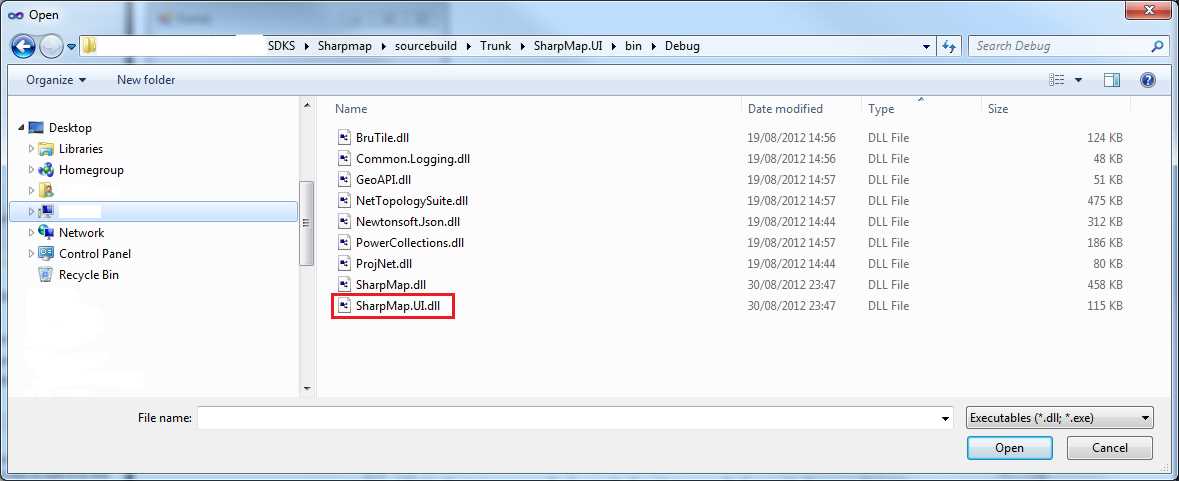
Figure 72: Adding SharpMap to the Toolbox
Click Open and then navigate back to the main Visual Studio screen. You should be greeted with the following in your toolbox:
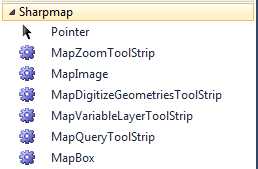
Figure 73: SharpMap and Tools in the Toolbox
You may also find that SharpMap and SharpMap.UI have been automatically added to your project references. If you started a new project and already had the tools loaded into your toolbox, then you'll need to add the references to your project manually. To do this, right-click References in your project, and then browse to the same location where you added the SharpMap.UI.dll. Add the SharpMap.dll and SharpMap.UI references. After adding these DLLs, reload the References dialog.
We need to add some more DLLs which are located in other folders in the solution.
Browse to the SharpMap.Extensions project folder, and into Bin > Debug or Release as needed. Select and add the following DLLs:
- BruTile.dll
- GeoAPI.dll
- Npgsql.dll
- SharpMap.Extensions.dll
Your project references should look something like the following screenshot:
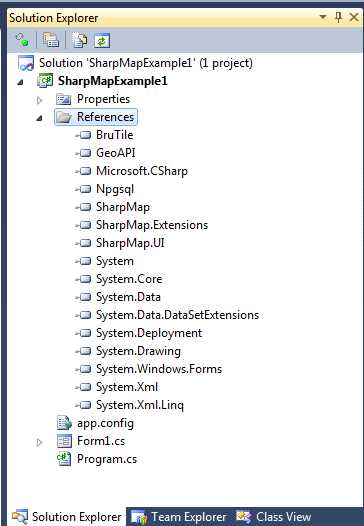
Figure 74: Added References
Now we are ready to put our GUI together.
Set the size of your form to around 1000 × 800, change the StartPosition property to CenterScreen, and change the title text to Sharp Map Example 1.
I generally rename my forms to something like formMainForm, but it's entirely up to you what name to choose. If you name your forms something different, you'll need to adjust the source accordingly when we start coding.
Now we need to drag five components onto our form in the designer. They are:
- MapBox from the SharpMap tools.
- Two Button controls and a ListBox from Common Controls.
- StatusStrip from Menus and Toolbars.
Rename the two buttons to btnZoomAndPan and btnQueryCounty. Change the display text on them to Switch to Zoom & Pan Mode and Switch to County Query Mode, respectively, and then place them in the upper left corner of your form. Resize them as needed to fit the text.
Select your StatusStrip control and rename it StatusBar. Then click on the Items - (collection) property to launch the Items Collection Editor. Click on the drop-down to the left of the status bar and add a StatusLabel. Rename the new label as lblStatusText and remove the text from the Text property.
Set the width of the ListBox control to be the same as the width of the button controls and place it beneath them. Stretch its height to just above the status bar at the bottom. Set the list box's name to lsbCountyResults, then click on its Anchor property and set it to Top, Left, Bottom.
Finally, use the rest of the space on the form for your map box. Align the bottom of it with the list box, and set its BackColor property to White. Change its name to mpbMapView, and change the Anchor to Top, Bottom, Left, and Right.
Your finished UI should look similar to the following:
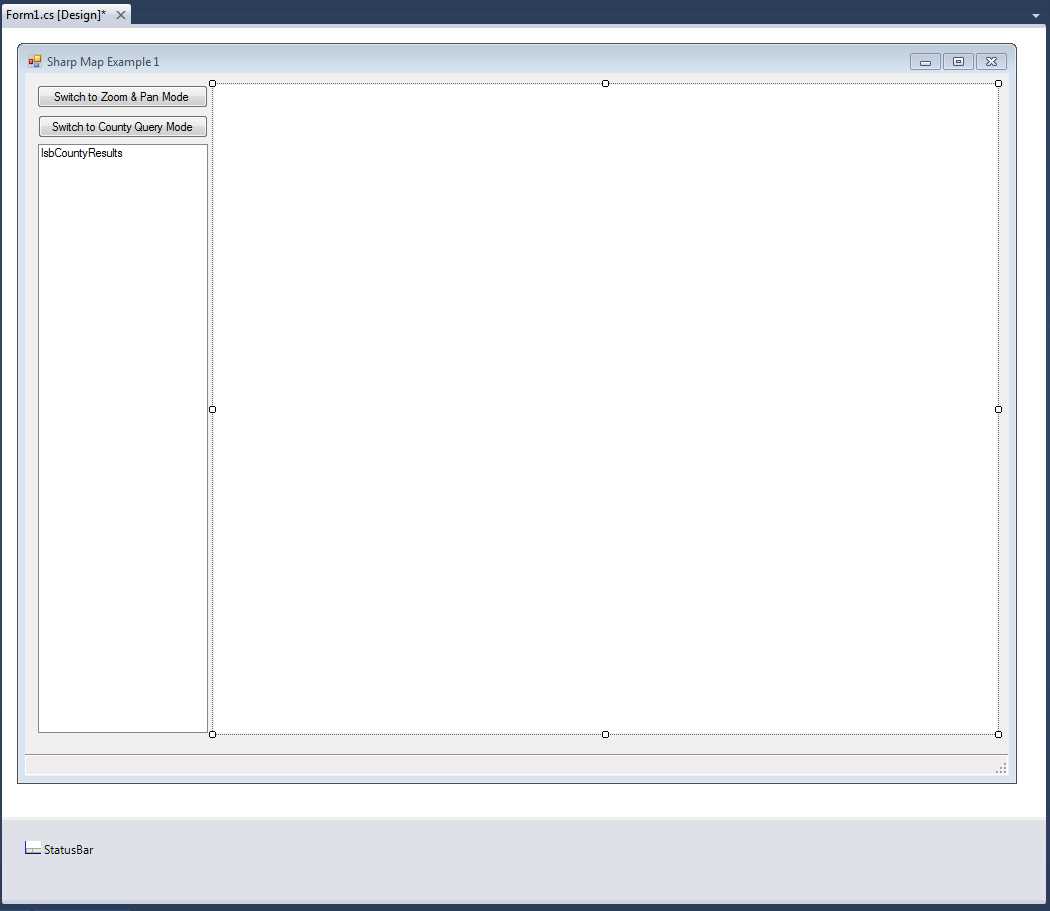
Figure 75: Completed SharpMap UI
Adding the Code
Now that we have a good-looking UI, it's time to start adding functionality to our app.
Using the MapBox control is very easy. The concept is simply to create layers, and then add those layers to the control which will then render and display them.
Each layer can have a different spatial reference and coordinate system, and the map control can re-project and convert coordinates on the fly. For this example though, we're going to let Postgres do all the work for us.
Load and run pgAdmin, and log into your database containing the data we loaded earlier. Expand the object tree until you can see all your tables and other objects.
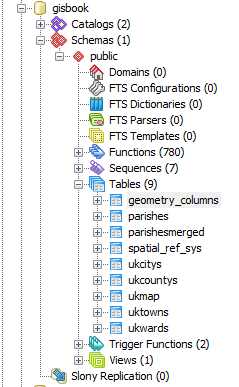
Figure 76: Object Tree in pgAdmin
As you can see in the figure, beneath the Tables node is a small green icon named Views. You may have used these before in other databases. The general idea is that they project data from other tables into a different schema, but appear to client apps as though they were an actual table.
A typical use is to take rows from different tables linked via foreign keys, and present a simple flat view of the combined data in which all the present items form a single row rather than a hierarchy.
For our demo, we are going to re-project our town and city points as WGS84 (SRID 4326) to match the coordinates of the U.K. counties layer. We'll start by right-clicking on Views and creating a new view.
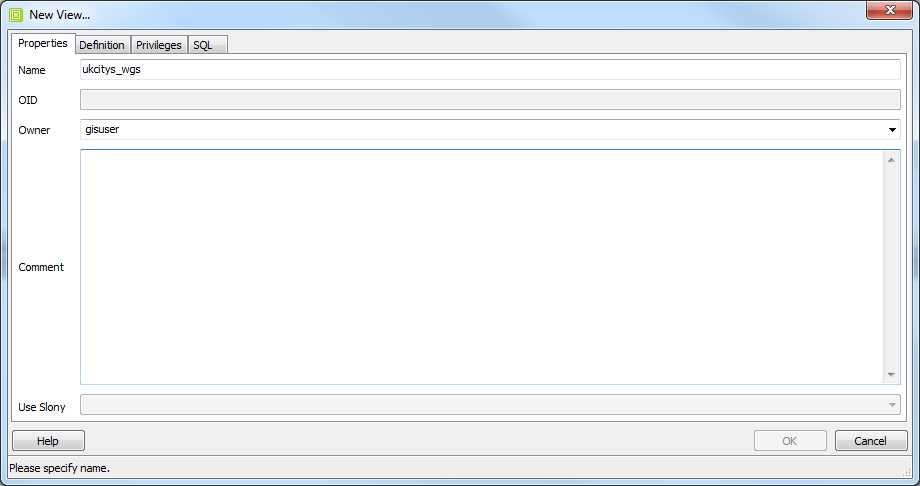
Figure 77: Creating a New View
Give the view a name—I named mine ukcitys_wgs—and set the correct user for your database login.
Switch to the Definition tab and enter the following SQL:
SELECT ukcitys.gid, ukcitys.number, ukcitys.name, ukcitys.admin_name, st_transform(ukcitys.geometry, 4326) AS geometry FROM ukcitys; |
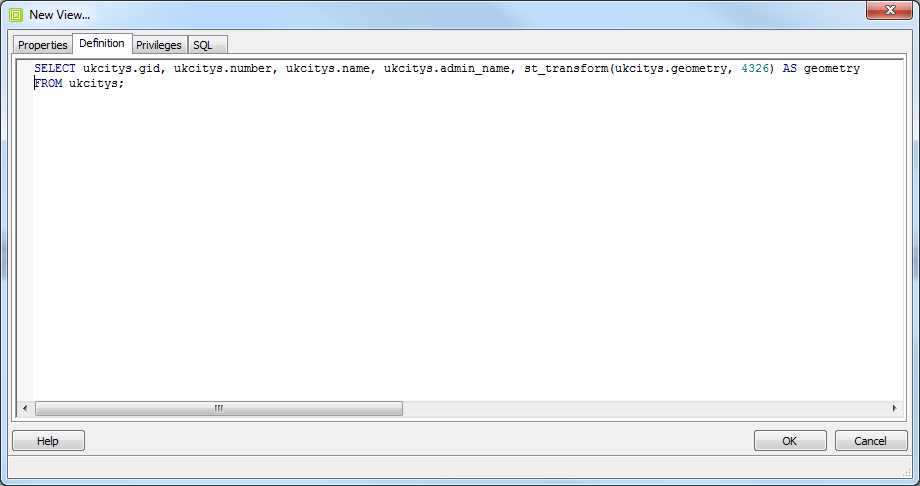
Figure 78: Setting the Database Login
As you can see in our SQL and Figure 78, we are using ST_Transform to transform our points from OSGB36 (SRID 27700) to WGS84 (SRID 4326). The result is that when a SELECT from ukcitys_wgs is performed, the table layout will be identical to ukcitys, but the geometry will be in the new coordinate system.
Views solve lots of problems like this in a GIS, and you'll tend to find that GIS databases make very extensive use of them.
Repeat these steps and create uktowns_wgs using the following SQL:
SELECT uktowns.gid, uktowns.number, uktowns.name, uktowns.admin_name, st_transform(uktowns.geometry, 4326) AS geometry FROM uktowns; |
One Small Problem...
For all that views do, they do have one small problem when it comes to using them in this way: the spatial metadata.
If you recall the beginning of the book, we discussed the geometry_columns table and its importance in the GIS database. When we create tables in the regular table space, we generally use the spatial function AddGeometryColumn to add the column that will contain the actual geometry object. You should have seen this happen when you used GeoKettle to add the county data—the SQL that was generated to create the table should have contained the AddGeometryColumn spatial function. This not only adds the column and modifies the table as needed, but it also registers the field with the required metadata tables and sets up some triggers to enforce the correct data types and SRIDs.
The problem is because a view is built from existing columns, there is no way of creating an actual geometric column on a view. This means that we have to add it manually. Fortunately, it's not a particularly difficult process; it only involves an insert.
Open up an SQL editor window and enter the following SQL:
INSERT INTO geometry_columns(f_table_catalog,f_table_schema,f_table_name,f_geometry_column,coord_dimension,srid,type) VALUES('','public','uktowns_wgs','geometry',2,4326,'MULTIPOINT') |
If you examine the rows already in geometry_columns, you'll notice that the data being inserted is identical to the row for uktowns; the only difference is the SRID.
To complete this task, perform the following to update for the city view:
INSERT INTO geometry_columns(f_table_catalog,f_table_schema,f_table_name,f_geometry_column,coord_dimension,srid,type) VALUES('','public','ukcitys_wgs','geometry',2,4326,'MULTIPOINT') |
Once you are done, you should have the following:
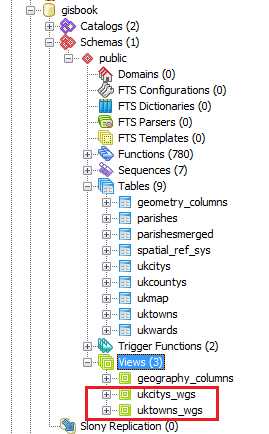
Figure 79: Adding New Views
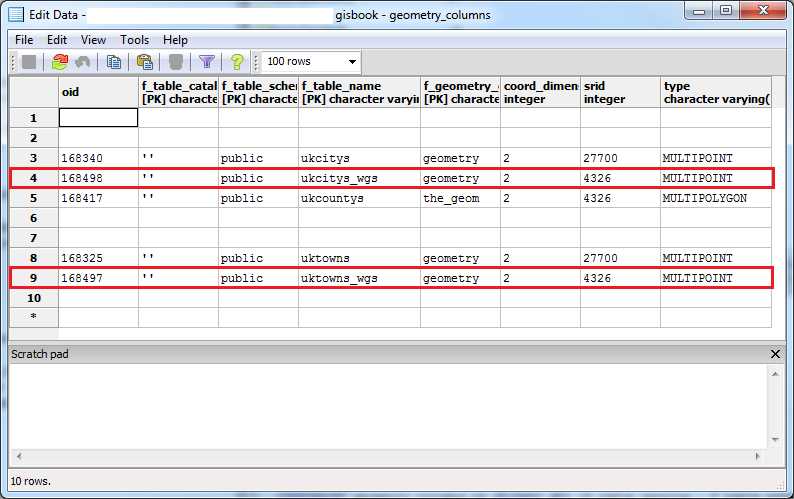
Figure 80: Table with New Views
SharpMap, like any decent implementation of an OGC-compliant GIS database client, will examine the geometry_columns table to find out the details of any layers we add. It will cancel and produce an exception if we add a view that can't be found in the geometry_columns table. Once we manually add the data, we can then load those views into our application.
Back to the Code...
Now that we have our UI, our data, and some views to project our data, it's time to add some C# to stitch it all together.
The first thing we need is a connection string for our Postgres database and a Boolean flag for the map initialization. Add the following code just before the constructor for your first form, and substitute the sever name, passwords, and user names as needed for your own connection:
private const string _connString = "Server=<server>;Port=5432;User Id=<user>;Password=<password>;Database=gisbook;CommandTimeout=300"; private bool _mapInitializing; |
Note that I set the command timeout to five minutes. If you're going to be doing a lot of server-based, long running geometry processing jobs, then this is a wise thing to do. The default command timeout is 20 seconds. When you start doing bigger jobs with this stuff, you'll end up with gigabytes of data and some lengthy run times.
Following our constructor, we need a function for initializing our map to be called from it. Your code should look like this by now:
using System.Windows.Forms; namespace SharpMapExample1 { public partial class formMainForm : Form { private const string _connString = "Server ;Port=5432;User Id= ;Password= ;Database=gisbook;CommandTimeout=300"; private bool _mapInitializing; public formMainForm() { InitializeComponent(); } public void InitializeMap() { } } } |
Initializing the map
The first thing we need to do in our map initialization function is set up and load our layers. We'll start with the county layer. The data source for the vector layer requires the names of the geometry column and the primary key—otherwise known as OID or GID in geospatial terms—which you must have in your geometry table, and the name of the table containing your layer.
The code to initialize and load the county layer, give it a green fill, and set a black border style is as follows:
const string countyTableName = "ukcountys"; const string countyGeometryColumnName = "the_geom"; const string countyGidColumnName = "gid"; VectorStyle ukCountyStyle = new VectorStyle { Fill = Brushes.Green, Outline = Pens.Black, EnableOutline = true }; VectorLayer ukCountys = new VectorLayer("ukcountys") { Style = ukCountyStyle, DataSource = new PostGIS(_connString, countyTableName, countyGeometryColumnName,countyGidColumnName), MaxVisible = 40000 }; |
We repeat this pattern two more times to load the data for our towns and cities:
const string cityTableName = "ukcitys_wgs"; const string cityGeometryColumnName = "geometry"; const string cityGidColumnName = "gid"; const string townTableName = "uktowns_wgs"; const string townGeometryColumnName = "geometry"; const string townGidColumnName = "gid"; VectorStyle ukCountyStyle = new VectorStyle { Fill = Brushes.Green, Outline = Pens.Black, EnableOutline = true }; VectorStyle ukCityStyle = new VectorStyle { PointColor = Brushes.OrangeRed }; VectorLayer ukCitys = new VectorLayer("ukcitys") { Style = ukCityStyle, DataSource = new PostGIS(_connString, cityTableName, cityGeometryColumnName, cityGidColumnName), MaxVisible = 40000 }; VectorStyle ukTownStyle = new VectorStyle { PointColor = Brushes.DodgerBlue }; VectorLayer ukTowns = new VectorLayer("uktowns") { Style = ukTownStyle, DataSource = new PostGIS(_connString, townTableName, townGeometryColumnName, townGidColumnName), MaxVisible = 40000 }; |
The only difference here is that we set the point color rather than the fill and line colors as we do for a polygon layer. We set the Style property of the layers to our VectorStyle object to give the layers their visual appearance. Next, we set the DataSource property to a connection to our Postgres server using the constants and connection string we previously defined. MaxVisible is the maximum zoom level that objects will be visible at in our map viewer. If we zoom beyond the value we specify, nothing will be drawn on the screen.
After we define the layers and their styles and connections, we then simply add these layers to the map control on our form.
mpbMapView.Map.Layers.Add(ukCountys); mpbMapView.Map.Layers.Add(ukCitys); mpbMapView.Map.Layers.Add(ukTowns); |
Then we set our default tool, zoom to the full extents of the map, and render it.
mpbMapView.ActiveTool = MapBox.Tools.Pan; mpbMapView.Map.ZoomToExtents(); mpbMapView.Refresh(); |
We'll finish by inserting the following code as the first two lines of the function; this will add a status message to our status bar while the map is initializing:
_mapInitializing = true; lblStatusText.Text = "MAP Initializing please wait"; |
Your code should now look something like the following image:
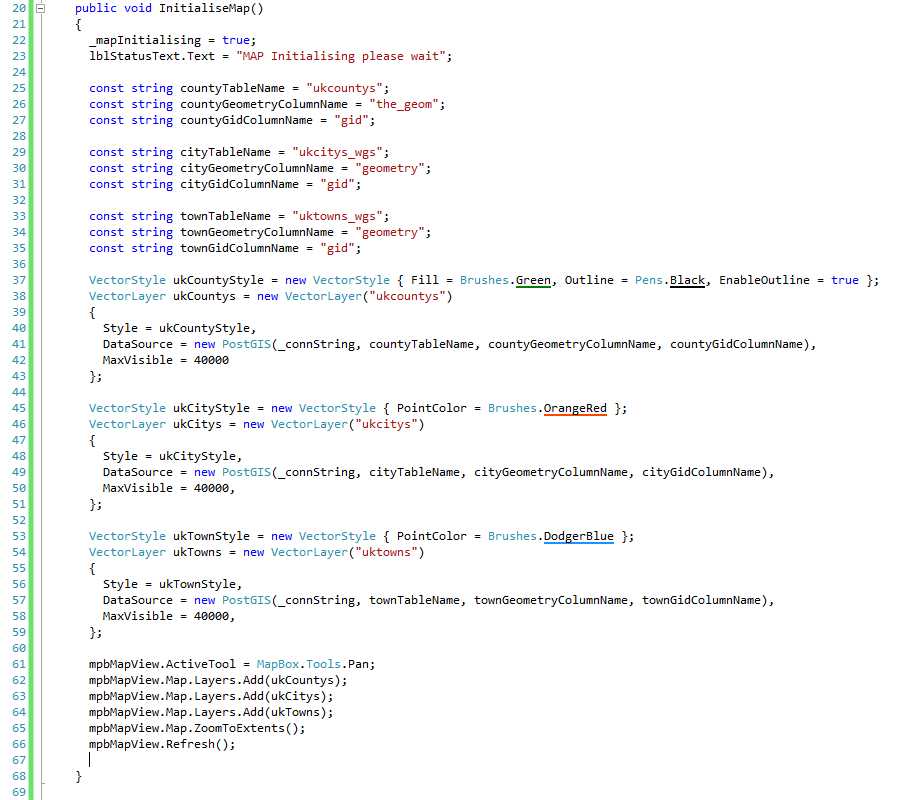
Figure 81: Nearly Completed Code
Lastly, add a call to InitializeMap() to your form constructor just below the call to InitializeComponent(), and that's all that's needed for the initialization function.
If you run your app at this point, and everything has been set up correctly, you should see your map layers appear on screen. You should be able to pan them by dragging the pointer around the map surface, and zoom using the mouse wheel.
It should look something like this:
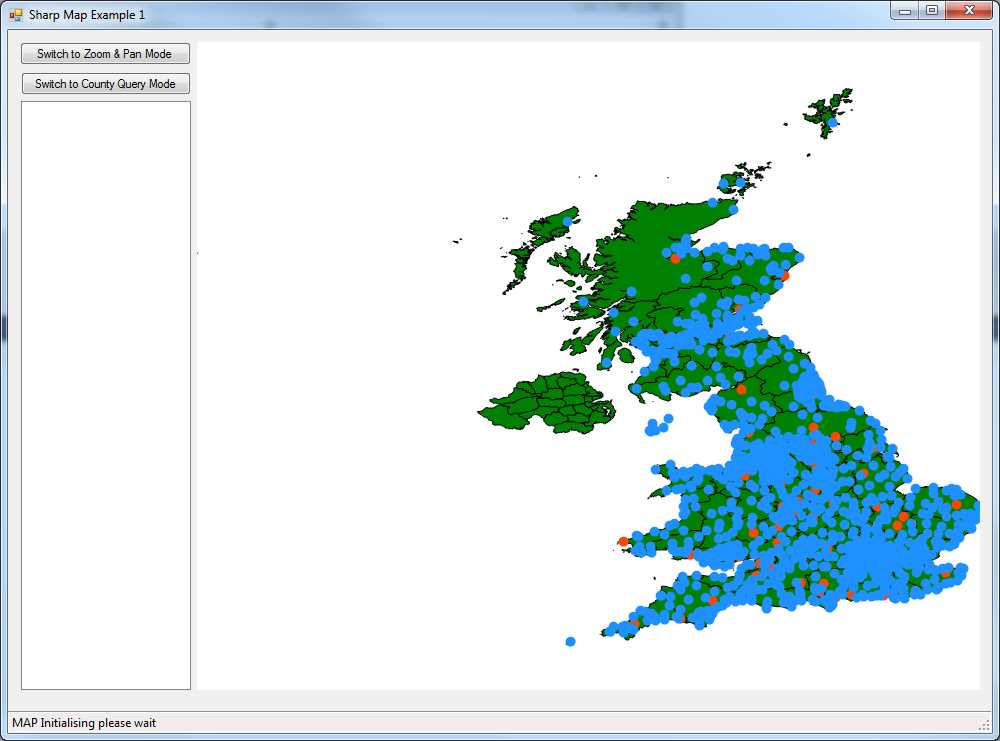
Figure 82: Completed Map
Fixing the Status Label
You'll notice that the MAP Initializing message in the status bar never changes. We'll fix that. When the map finishes rendering, it fires an event called MapRefreshed.
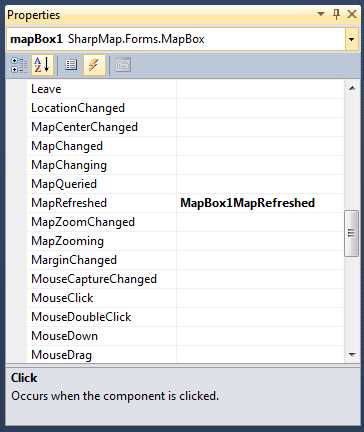
Figure 83: Map Events
We hook this event in our code and add some code to it to change the label. However, we also need to use our Boolean variable to control it as we don't want it called every time our map is refreshed (which will happen quite often).
Hook the event with the following code:
private void MapBox1MapRefreshed(object sender, EventArgs e) { if(_mapInitializing) { _mapInitializing = false; lblStatusText.Text = "MAP Initialized"; } } |
If you run it now, the status bar should update when the map has finished rendering.
Wiring up the Tool Buttons
Now we'll add the code for the two buttons that allow you to switch tools.
SharpMap has a number of different tool modes, from zooming and panning to drawing lines and polygons over the top of your loaded map.
The two tools we'll use in this app are the zoom and pan tool, which is the default, and the query tool.
Changing the tool is as simple as assigning a new value to the ActiveTool property of the MapBox control on your form. The value to assign is any of the values from the MapBox.Tools type enumeration.
Double-click on each button in turn and add the following code in each of their click handlers as follows:
private void BtnZoomAndPanClick(object sender, System.EventArgs e) { mpbMapView.ActiveTool = MapBox.Tools.Pan; } private void BtnQueryCountyClick(object sender, System.EventArgs e) { mpbMapView.ActiveTool = MapBox.Tools.Query; } |
If you run the app now, you should be able to change modes using the two buttons in the top left of the form. Zooming and panning are handled automatically. For queries, we have to respond to the click event on the map box and add some code to get the results we need.
Adding Our County Info Query Code
The first thing we need to do is make sure we are using the Query tool and go no further if we are not.
From the designer, find the Click event on the map control and add the following line to the event handler in the code:
if (mapBox1.ActiveTool != MapBox.Tools.Query) return; |
Why do it this way? That's a very good question, especially considering that the query tool actually has its own event handler that is fired when the map is clicked.
While writing this book, I originally used the dedicated handler, but found it quite difficult to narrow down its range and the items I was selecting. Instead of one polygon, I routinely received what seemed like half of the database, and had a difficult time sifting through the amount of data handed to the event handler.
After a bit of research, it appears that most of the examples and recommended ways of avoiding this problem involve trapping either the MouseUp and MouseDown events, or the Click event. I chose the Click event for simplicity.
Once we know that we're in the correct tool, we can see where we are on the map. The first thing we must do is get the actual mouse position in pixels. Then, we use ImageToWorld from the SharpMap toolkit to transform the mouse position's x and y values into a WGS84 latitude and longitude.
Next, we need to use that position to query our county layer and gather a FeatureDataSet containing any polygons that are present in the location we clicked.
FeatureDataSet selectedGeometry = new FeatureDataSet(); VectorLayer theLayer = (VectorLayer)mapBox1.Map.FindLayer("ukcountys").FirstOrDefault(); if (theLayer != null) { if (!theLayer.DataSource.IsOpen) { theLayer.DataSource.Open(); } Envelope boundingBox = new Envelope(wgs84Location.CoordinateValue); if (Math.Abs(boundingBox.Area - 0.0) < 0.01) { boundingBox.ExpandBy(0.01); } theLayer.DataSource.ExecuteIntersectionQuery(boundingBox, selectedGeometry); theLayer.DataSource.Close(); } |
This should result in our FeatureDataSet collection being filled with any geometry found at that location, which in our case should be the county that we clicked on.
Next up, we need to check if we have any data in the FeatureDataSet. If we do, grab the name of the county that was clicked on.
Each row in the FeatureDataSet is pretty much the same as a row in a normal data set, so we can look for a column with the same name as a column in the underlying table in Postgres. If no rows are found, it's better to return.
if (selectedGeometry.Tables[0].Count <= 0) return; string countyName = selectedGeometry.Tables[0].Rows[0]["name2"].ToString(); |
Once we have a county name from our U.K. counties layer, we then want to get a list of cities and towns for our county. We do this with the following two methods:
List<string> cityList = GetCitysForCounty(countyName); List<string> townList = GetTownsForCounty(countyName); |
Now that we have our data, we want to provide some visual feedback to the user. First, we'll highlight the county we clicked on.
VectorLayer highlightLayer = (VectorLayer) mpbMapView.Map.FindLayer("highlight").FirstOrDefault(); if (highlightLayer == null) { Color myColor = Color.FromArgb(64,144,238,144); Brush fillBrush = new SolidBrush(myColor); highlightLayer = new VectorLayer("highlight"); VectorStyle highlightStyle = new VectorStyle {Fill = fillBrush, Outline = Pens.White, EnableOutline = true}; highlightLayer.Style = highlightStyle; } |
We do this by first checking to see if we already have a highlight layer on our map. If one is not present, create a new one. One thing to note about setting the style on the highlight layer is the way we set the color. We use the full ARGB color call so that we can specify a transparency level to our layer—the first value in the function, 64—that allows us to see the existing map elements underneath it.
Next we take the FeatureDataSet we obtained earlier and assign it as the data source for our highlight layer so that the selected county polygon shows up with our defined semi-transparent style. Note that this will highlight multiple polygons if you select more than one on the map. Previously selected counties will be cleared.
highlightLayer.DataSource = new GeometryProvider(selectedGeometry.Tables[0]); mpbMapView.Map.Layers.Add(highlightLayer); mpbMapView.Refresh(); |
Once we add the highlight layer and refresh the map, our selected county should be visible.
The last thing to do for our country query feature is add our county info to the list box on the left of our UI, and add some code at the start and end of the method to show what's happening in our status bar.
lsbCountyResults.Items.Clear(); lsbCountyResults.Items.Add("Selected county: " + countyName.ToUpper()); lsbCountyResults.Items.Add(""); if (cityList.Count > 0) { lsbCountyResults.Items.Add("Citys in this county"); foreach (string city in cityList) { lsbCountyResults.Items.Add(city); } lsbCountyResults.Items.Add(""); } if (townList.Count > 0) { lsbCountyResults.Items.Add("Towns in this county"); foreach (string town in townList) { lsbCountyResults.Items.Add(town); } lsbCountyResults.Items.Add(""); } |
Next, we add the status bar message just after the first if statement.
lblStatusText.Text = "Querying Map... please wait for results."; Application.DoEvents(); |
And we add the completed message just before the closing brace.
lblStatusText.Text = "Query finished."; |
Before we go any further, some of you will say, "Wow, what a long method," and wonder why I'm using Application.DoEvents to make sure the label is updated in an event handler. Please remember that this is example code only; it's not supposed to be a perfect example, or simply copy and pasted verbatim to make production-quality apps. Its purpose is purely to show you how to use SharpMap to create a simple GIS application.
Conclusion
The final thing we need to do is create the two methods to retrieve our city and town lists from our GIS database.
SharpMap is perfectly capable of taking the polygon outline we found earlier and querying the other layers in the map to tell us which points fall within which area. However, as this book is primarily about using a GIS database, I'd like to conclude by letting Postgres do the heavy lifting for us once more.
The two methods are fairly similar, so I've copied both of them out and just described them as one.
private static List<string> GetTownsForCounty(string countyName) { string sql = string.Format( "SELECT t.Name FROM ukcountys c, uktowns t WHERE name2 = :county AND ST_Within(t.geometry,ST_Transform(c.the_geom,27700))"); List<string> results = new List<string>(); using (NpgsqlConnection conn = new NpgsqlConnection(_connString)) { conn.Open(); using (NpgsqlCommand command = new NpgsqlCommand(sql, conn)) { command.Parameters.Add(new NpgsqlParameter("county", NpgsqlDbType.Varchar)); command.Parameters[0].Value = countyName; using (NpgsqlDataReader dr = command.ExecuteReader()) { while (dr.Read()) { results.Add(dr.GetString(0)); } } } } return results; } private static List<string> GetCitysForCounty(string countyName) { string sql = string.Format( "SELECT t.Name FROM ukcountys c, ukcitys t WHERE name2 = :county AND ST_Within(t.geometry,ST_Transform(c.the_geom,27700))");
List<string> results = new List<string>(); using (NpgsqlConnection conn = new NpgsqlConnection(_connString)) { conn.Open(); using (NpgsqlCommand command = new NpgsqlCommand(sql, conn)) { command.Parameters.Add(new NpgsqlParameter("county", NpgsqlDbType.Varchar)); command.Parameters[0].Value = countyName; using (NpgsqlDataReader dr = command.ExecuteReader()) { while (dr.Read()) { results.Add(dr.GetString(0)); } } } } return results; } |
Anyone who has done any raw ADO.NET programming should immediately recognize what we are doing here, and may even quite reasonably ask why we're not using LINQ to SQL, or Entity Framework, or…the list goes on.
In the first place, the raw Postgres data provider doesn't provide an Entity Framework or LINQ-to-SQL data model provider. Secondly, since we're using spatial functions, it's far better to do this in ADO.NET than in a model where the SQL-level syntax is deeply hidden from view.
The first thing we do is make a constant string of the SQL we wish to run in the database, and I'd like you to pay particular attention to :county in the query string. This is one of the places where the Postgres data provider differs from the regular ADO.NET way of providing parameters to a query string.
In regular ADO.NET code, parameters are usually prefixed with @, e.g., @county. In Postgres, parameters are prefixed with a :. In code, however, adding parameters is done in the same way.
The rest is fairly self-explanatory. We open a connection using the connection string we defined previously, open the database, add the parameter, and run our SQL before finally getting a data reader object to read our results into a generic string list.
We're doing all of this in nested using statements, which means everything is IDisposable and should be freed correctly once we're done, leaving us to simply return the string list of results back to the calling method.
If everything goes according to plan, on clicking Run you should be greeted with an application that can zoom and pan around the map defined in your database, as well as switch to County Query Mode and retrieve a list of towns and cities in a selected county. Your finished app should look something like the following:
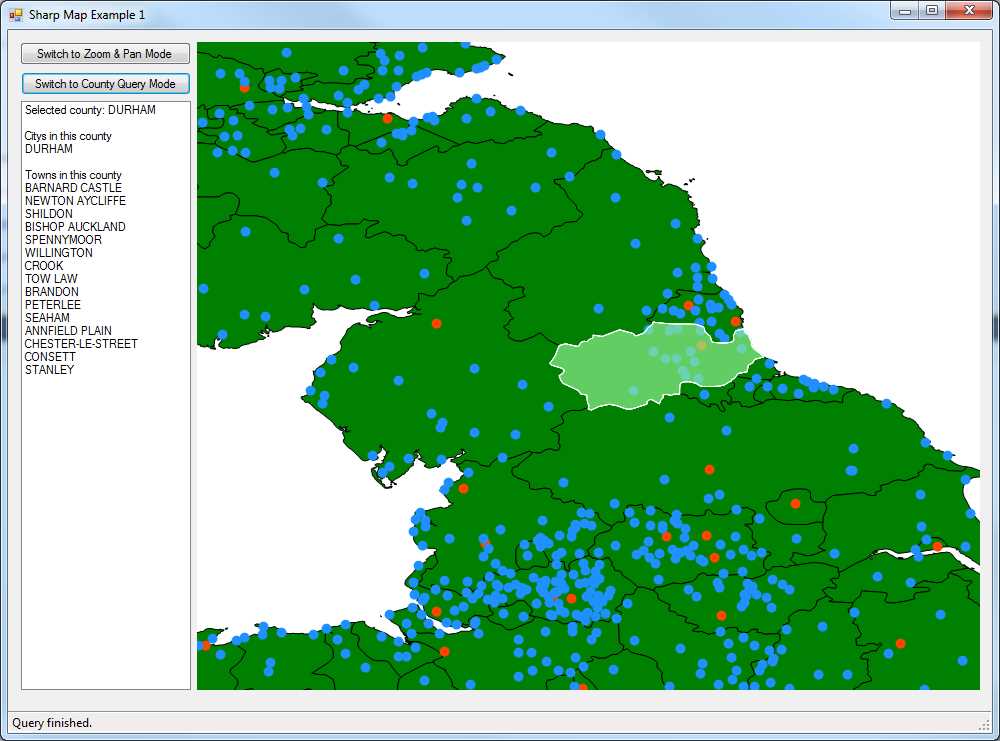
Figure 84: Completed Map Application
And there we have it. Hopefully I've whetted your appetite and shown you just a few of the many things GIS can help you with in daily life.
Remember that it's possible to buy mobile phones that have enough power to do this kind of thing on a small scale, and there are database systems to support them such as SQL Compact. SharpMap allows you to do everything from vector to raster maps and beyond. Once you start looking further, you'll find that some systems have the built-in ability to read GPS devices, enabling you to pull real-time location information into your apps. Go out there and explore the world in both its real and digital forms. It's an adventure that's only just started.
- 1800+ high-performance UI components.
- Includes popular controls such as Grid, Chart, Scheduler, and more.
- 24x5 unlimited support by developers.