
Direct2D Succinctly®

CHAPTER 14
Direct2D Geometry
Geometries allow us to specify shapes for clipping regions, hit testing, and paths for animations. They are device independent resources, and should be created outside of any tight loops. The most basic geometries are those for the primitive shapes, ellipses, rectangles, and rounded rectangles. The information in this chapter is not designed to extend the graphing application we have been working on up to this point. It is an introduction to the syntax and concepts of some more advanced topics. The following code samples could easily be added to our graphing application, but I assumed the project is a new DirectX (XAML) project and the rendering class is called SimpleTextRenderer.
Simple Geometries
To render geometries in your project, add these three member variables to your rendering class.
ID2D1RectangleGeometry *m_rectangle; ID2D1EllipseGeometry *m_ellipse; ID2D1RoundedRectangleGeometry *m_roundedRectangle; |
Call the m_d2dFactory create geometry methods in the device independent resource creation method (CreateDeviceIndependentResources() in the SimpleTextRenderer class).
m_d2dFactory->CreateRectangleGeometry( D2D1::RectF(0, 0, 100, 100), &m_rectangle); // 100 × 100 rectangle m_d2dFactory->CreateEllipseGeometry( D2D1::Ellipse(D2D1::Point2F(100, 10), 150, 100), &m_ellipse); // 150 × 100 ellipse m_d2dFactory->CreateRoundedRectangleGeometry( D2D1::RoundedRect( D2D1::RectF(-100, -100, 100, 100), 25, 25), &m_roundedRectangle); // 200 × 200 rectangle w/ rounded corners |
The creation methods for making the geometry types is almost the same as those creating the corresponding shapes. For instance, the CreateEllipseGeometry syntax is very similar to the m_d2dContext::DrawEllipse method. To render previously created geometry, call the Render Geometry method of the Context in your render method.
// I've assumed the m_blackBrush brush exists! m_d2dContext->DrawGeometry( m_rectangle, m_blackBrush.Get()); m_d2dContext->DrawGeometry( m_ellipse, m_blackBrush.Get()); m_d2dContext->DrawGeometry( m_roundedRectangle, m_blackBrush.Get()); |
As mentioned previously, geometries are very slow to render (compared to primitives). However, geometries are very flexible and can be used for more than just rendering shapes. For instance, they have many interesting methods like ComputeLength and ComputeArea, which return the length and area of the shape, and consider the transform matrices as part of the calculation. That is, they consider scaling and skew. They can also be used to build geometry sinks and hit testing with the FillContainsPoint method. All of these functions and others make the geometry a very flexible class, but one that, unless you require these particular abilities, is slower for the computer to manipulate and render.
Once you have created geometries, you can render the filled shapes with a solid color brush using the context's FillGeometry method. The context’s DrawGeometry method can be used to render only the outline of the geometry.
Transformed Geometry
Transformed geometry allows us to attach a matrix transformation to a geometry. This is useful for creating shapes that scale and translate, but the stroke thickness (the thickness of the pen) remains the same. A transformed geometry is basically just a regular geometry, but it carries its own transformation matrix. Geometrical shapes rendered with DrawGeometry are transformed using the transformation matrix in the context.
m_d2dFactory->CreateTransformedGeometry( m_rectangle, // Pointer to original geometry Matrix3x2F::Scale(1.0f, 12.0f), // Tranformation Matrix &m_transformed); // Pointer to our transformed geometry |
The code example uses the factory to create a transformed geometry with the m_rectangle from the start of the chapter. The transformation matrix supplied is a scale of 1.0f along the x-axis and 12.0f along the y-axis, so the shape will be stretched by 12 units. The important thing to note is that stroke will not be stretched when the shape is rendered, only the shape itself.
To render the transformed geometry you can use the context's regular DrawGeometry method.
m_d2dContext->DrawGeometry( m_transformed, m_blackBrush.Get()); |
Tip: In our original line chart, the line was scaled in a strange way when the x-axis and y-axis were scaled by different values. Depending on the angles of the lines, the stroke thickness was also being stretched. This produces an effect that is like a calligraphy pen, and is undesirable for a line chart. It may be better to use a TransformedGeometry for our line chart, since the line can be scaled with a static stroke width.
Complex Geometries
One of the powerful features of geometries is the fact that simple shapes can be combined together to form more complex geometries. The resulting geometries have all the abilities of the original ones, calculating the area, length, and hit testing. To combine several geometries together, use the CombineWithGeometry method of the geometries.
To create a custom geometry from a collection of lines, you can use the PathGeometry class. This allows us to specify a set of points, connect them with lines, and render the final shape. An ID2D1GeometrySink is an object which is used to describe a path built from lines, arcs, and other geometric line primitives. The path geometry uses an ID2D1GeometrySink to build the shape, and once it is built you can use the Context's DrawGeometry or FillGeometry methods to render the shape. In the following example, I have set up a collection of random points and have specified that the points create a closed shape. I have indicated that the geometry shape is filled alternatively. First, add a Path Geometry member variable to your rendering class (SimpleTextRenderer.h file).
Microsoft::WRL::ComPtr<ID2D1PathGeometry> m_pathGeometry; |
The path geometry is a device independent resource like the other geometries, so you can specify the shape in the CreateDeviceIndependentResources method of your renderer.
// Create or load some data into a points array. int count = 25; D2D1_POINT_2F * points = new D2D1_POINT_2F[count*2]; for(int i = 0; i < count; i++) { points[i].x = 50; points[i].y = i * 10; points[i+count].x = (count * 10)-(i * 10); points[i+count].y = 50; } // Create the path geometry: DX::ThrowIfFailed(m_d2dFactory->CreatePathGeometry(&m_pathGeometry)); // Use the path geometry to create a geometry sink: ID2D1GeometrySink *geometrySink; DX::ThrowIfFailed(m_pathGeometry->Open(&geometrySink)); // Set the fill mode: geometrySink->SetFillMode(D2D1_FILL_MODE::D2D1_FILL_MODE_ALTERNATE); // Set the start point and specify the figure is to be filled geometrySink->BeginFigure(points[0], D2D1_FIGURE_BEGIN_FILLED); // Add the other points for(int i = 1; i < count; i++) { // Add a line to the sink connecting the current point to the last: geometrySink->AddLine(points[i+count]); geometrySink->AddLine(points[i]); } // End the figure, connect the final point to first geometrySink->EndFigure(D2D1_FIGURE_END_CLOSED); // Release the geometry sink from RAM geometrySink->Close(); geometrySink->Release(); delete[] points; |
Note: A geometry sink is a temporary geometry building tool. It is not needed once the geometries are built, so I have used a local pointer and released it once I have finished creating the geometry with it.
Finally, the geometry can be rendered in your render method with a call to either FillGeometry or DrawGeometry.
m_d2dContext->DrawGeometry(m_pathGeometry.Get(), m_blackBrush.Get()); |

Unfilled Geometry
Figure 38 is the output of the drawn (not filled) geometry. If you render the geometry using the context's FillGeometry method you will get something like the following.

Filled Geometry
Figure 39 is the same geometric figure as the previous one, only every second shape created by the lines in the geometry has been filled in. This is due to the alternate FILL_MODE specified in the geometry sink. You can also set the fill mode to D2D1_FILL_MODE_WINDING.
The implementation of the fill mode is as follows. For the case of alternate fill mode: for each pixel in the shape, an imaginary line is drawn in an arbitrary direction (it does not matter what the direction is, the result is the same so long as the line is infinite). If this line crosses an odd number of lines in the geometry, the pixel is filled. Otherwise, it is transparent.
In the case of the Winding Fill Mode, for each pixel, an infinite line is drawn in an arbitrary direction. If there are as many lines from the geometry that cross this imaginary line from left to right (from the perspective of the imaginary line), as those that cross from right to left, the shape is not filled. Otherwise, it is.
As mentioned previously, geometries are able to do a lot more than render shapes. For instance, you could calculate the length and area, or perform a hit test with ease with the following code. This code is best called outside the Render() method because it is very slow. The scale and translation matrices used in this code could be member variables of the SimpleTextRenderer class.
// Compute the area of the geometry float area; m_pathGeometry->ComputeArea(scale * translation * m_orientationTransform2D, &area); // Compute the length of the geometry float length; m_pathGeometry->ComputeLength(scale * translation * m_orientationTransform2D, &length); // Specify a point for hit test: D2D1_POINT_2F point = D2D1::Point2F(120.0f, 150.0f); BOOL result = false; m_pathGeometry->FillContainsPoint(point, scale * translation * m_orientationTransform2D, &result); |
Note: The way Direct2D uses points and a geometry sink to create a collection of lines is very similar to the way that Direct3D uses vertices and index buffers. The points are specified in an array, and then lines can be created between any two points using their indices within the array. Make sure you have a good grasp of this concept before you examine the vertex and index buffers; it is simpler in 2-D than it is in 3-D, but it is exactly the same concept.
Tip: In these examples, I have assumed there are translation, scale, and orientation matrices which have transformed the geometry, and these are considered in the calculations. For instance, if the current scale matrix is 3.0f in the x-axis and y-axis, then the length reported by the calculate length method will be three times the original length of the shape. If you want to get the area or length of the shape without the scaling or other transformations, you can use the Matrix3x2F::Identity() as the transform matrix.
In the previous example we looked at rendering straight lines. Although we used a geometry sink, we could have used a simplified geometry sink since there are no curves in the path we rendered. If you require adding Bézier curves or arc segments to your path, you can use the AddBezier, AddQuadraticBezier, and AddArc methods of the geometry sink.
In the following example, a set of marching shapes is rendered from a collection of points loaded into the geometry using the AddBezier method. This example assumes the code from the last example. For example, there is a member variable called m_pathGeometry and a black brush from the SimpleTextRenderer sample, and so on.
// Create or load some data into a points array. int count = 50; D2D1_POINT_2F * points = new D2D1_POINT_2F[count]; for(int i = 0; i < count; i++) { points[i].x = (i*i); points[i].y = (i%2)*(i*10+i*10); } |
Add Bézier curves to the geometry using the points.
// Set the fill mode: geometrySink->SetFillMode(D2D1_FILL_MODE::D2D1_FILL_MODE_ALTERNATE); // Set the start point and specify the figure is to be filled geometrySink->BeginFigure(points[0], D2D1_FIGURE_BEGIN_FILLED); // Add the other points for(int i = 1; i < count-1; i++) { // Create Beziers from the points: geometrySink->AddBezier(D2D1::BezierSegment( points[i-1],points[i], points[i+1])); } |
And render the geometry in the render method.
m_d2dContext->FillGeometry(m_pathGeometry.Get(), m_blackBrush.Get()); |
Tip: Curves can be a simple way to approximate intermediate values in a line chart. Instead of connecting the nodes in a line chart with straight lines, they can be rendered as curves. Any point between nodes could be approximated by the curves, and in addition, a curved line looks much more appealing than the jagged straight lines that are normally employed to render charts. The actual intermediate values may be no closer to a curve than the straight lines, but (particularly with highly correlated or otherwise well-behaved data sets) the curve may be a closer approximation.
Upon running the application you should see something like Figure 40.
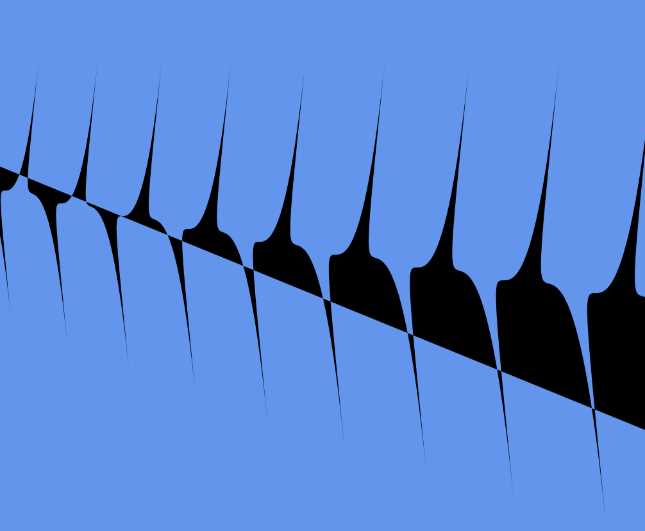
- Curved Geometry
- 1800+ high-performance UI components.
- Includes popular controls such as Grid, Chart, Scheduler, and more.
- 24x5 unlimited support by developers.