
Direct2D Succinctly®

CHAPTER 5
2-D Data Plots
We will now move on to rendering some shapes in Direct2D by examining how to plot some data. This will be a small introduction to rendering vector graphics in Direct2D. In the interest of keeping the sample code simple, I will use arrays of randomly generated values for the data that will be plotted. When used in a real application, this data will probably come from a database or some other real data source.
Graph Variable Base Class
We will create scatter plots and line charts in the following sections. Both the scatter plot and the line chart share many characteristics, so we will implement a small class hierarchy. Both the scatter plot and the line chart will inherit from the following base class, which is called the GraphVariable class. Add two files to your project to define this base class, GraphVariable.h and GraphVariable.cpp.
// GraphVariable.h #pragma once #include "DirectXBase.h" // This class represents a generic plottable variable // It is the base class for the ScatterPlot and the LineChart // classes. class GraphVariable abstract { protected: D2D1_POINT_2F* m_points; // These are the x and y values of each node int m_nodeCount; // This is a record of the total number of nodes // Record of smallest point float m_minX, m_minY; // Used to auto pan public: // Getters for min values float GetMinX() { return m_minX; } float GetMinY() { return m_minY; } GraphVariable(float* x, float* y, int count); virtual void CreateDeviceDependentResources (Microsoft::WRL::ComPtr<ID2D1DeviceContext> context) = 0; virtual void Render(Microsoft::WRL::ComPtr<ID2D1DeviceContext> context) = 0; }; |
The class consists of the nodes as an array of D2D1_POINT_2F structures, as well as a count and a record of the smallest x and y values in the node collection. The reason we are taking note of the smallest x and y values is to automatically pan the data later on, so that some data is visible in the initial view of our charts.
// GraphVariable.cpp #include "pch.h" #include "GraphVariable.h" GraphVariable::GraphVariable(float* x, float* y, int count) { this->m_nodeCount = count; // Assume the minimum is the first value m_minX = x[0]; m_minY = y[0]; // Create an array of points from the *x and *y. // We can't assume that the *x and *y are permanent so // allocate seperate heap space for a copy of the data // as D2D1::Point2F's: m_points = new D2D1_POINT_2F[count]; for(int i = 0; i < count; i++) { m_points[i] = D2D1::Point2F(x[i], y[i]); // Check if the point is lower than the current minimum if(x[i] < m_minX) m_minX = x[i]; if(y[i] < m_minY) m_minY = y[i]; } } |
The only method defined for this base class is a constructor that copies the two float arrays (*x and *y) to the member variable m_points. It also finds and records the smallest values in both the *x and the *y arrays, to be used for automatically panning later.
Scatter Plot
The scatter plot is one of the most common and useful depictions of 2-D data. It is usually represented on a chart as a collection of nodes, each drawn as a primitive shape such as a circle, square, or a triangle. Each node represents some point in 2-D space and each has various properties including its position, color, and size. Scatter plots are usually employed to represent data with two dimensions where each of the dimensions is parametric (such as weight and height). The values are not ordered by the x-axis and they do not show continuation in the same way that a line chart does. Two variables are needed for a scatter plot: the values in one variable determine how far left or right a node is, while the values in the other variable determine how far up or down a node is. Scatter plots are excellent for displaying data that may be correlated since correlated data appears to collect around a straight line or as a spray of nodes.
If you do not need to maintain a steady 60 frames per second as dictated by the V-sync, you can change the SwapChain's sync interval to 2, 3, or 4. By default, the swap chain will try to present after the V-sync at 60 fps. Change the value of the first parameter of the call to the following:
HRESULT hr = m_swapChain->Present1(1, 0, ¶meters);
Changing the value of the first parameter of the call in the DirectXBase.cpp file to 2, 3, or 4 will cause the swap chain to sleep the application for up to 4 V-syncs, instead of the usual 1. This will result in far better power consumption at the cost of a smooth frame rate. The input 1 means 60 fps, 2 means 30 fps, 3 means 20 fps, and 4 means 15 fps. The frames per second required to adequately graph data are not usually 60 fps. 30 fps or 20 fps should be fine for most applications. Even 15 fps will look fairly smooth in a charting application.
The following scatter plot inherits from the previously defined GraphVariable base class. Add two files to your project, ScatterPlot.h and ScatterPlot.cpp.
// ScatterPlot.h #pragma once #include "DirectXBase.h" #include "GraphVariable.h" // Two different example shapes enum NodeShape { Circle, Square }; // This class represents data to be drawn as a scatter plot class ScatterPlot: public GraphVariable { float m_HalfNodeSize;// Half size of the nodes D2D1::ColorF m_NodeColor; // The color of the nodes ID2D1SolidColorBrush* m_brush; // Solid brush for painting nodes NodeShape m_NodeShape; // The shape of the nodes
public: // Public constructor ScatterPlot(float* x, float* y, float nodeSize, D2D1::ColorF nodeColor, NodeShape nodeShape, int count);
virtual void CreateDeviceDependentResources(Microsoft::WRL::ComPtr<ID2D1DeviceContext> context) override; virtual void Render(Microsoft::WRL::ComPtr<ID2D1DeviceContext> context) override; }; |
// ScatterPlot.cpp #include "pch.h" #include "ScatterPlot.h" using namespace D2D1; using namespace DirectX; ScatterPlot::ScatterPlot(float* x, float* y, float nodeSize, D2D1::ColorF nodeColor, NodeShape nodeShape, int count): m_NodeColor(0), GraphVariable(x, y, count) { // Save half the node size. The nodes are drawn with // the point they're representing at the middle of the shape. this->m_HalfNodeSize = nodeSize / 2; this->m_NodeShape = nodeShape; this->m_NodeColor = nodeColor; } void ScatterPlot::Render( Microsoft::WRL::ComPtr<ID2D1DeviceContext> context) { switch(m_NodeShape) { // Draw as circle nodes case NodeShape::Circle: for(int i = 0; i < m_nodeCount; i++) { context->FillEllipse(D2D1::Ellipse(m_points[i], m_HalfNodeSize, m_HalfNodeSize), m_brush); } break;
// Draw as square nodes case NodeShape::Square: for(int i = 0; i < m_nodeCount; i++) { context->FillRectangle(D2D1::RectF(m_points[i].x - m_HalfNodeSize, m_points[i].y - m_HalfNodeSize, m_points[i].x + m_HalfNodeSize, m_points[i].y + m_HalfNodeSize), m_brush); } break; // Additional shapes could follow default: break; } } void ScatterPlot::CreateDeviceDependentResources (Microsoft::WRL::ComPtr<ID2D1DeviceContext> context) { // Create a brush of the specified color for painting the nodes DX::ThrowIfFailed(context->CreateSolidColorBrush(ColorF(m_NodeColor), &m_brush)); } |
The constructor saves the color and node shape settings to member variables. The Render method of this class shows how to render two basic shapes, the ellipse and the rectangle. The shapes are drawn with the context’s FillXXX methods, where the XXX is some primitive shape. These methods require a brush (created in the CreateDeviceDependentResources method), as well as the shape to draw.
The FillEllipse method takes an ellipse as its first parameter. This could be generated previously or calculated on the fly. Ellipses have a position and x and y radius. For instance, to create an ellipse whose center is at pixel (100, 150), is 60 DIPs wide, and twice as tall, you could use D2D1::Ellipse(100, 150, 60, 120). I have created circles by specifying the x and y radius as the same value.
The FillRectangle method takes a Rectangle as its first parameter. This requires specifying the x-coordinate and y-coordinate of the upper left corner of the rectangle, as well as the width and height.
The ID2D1DeviceContext interface has two versions of each of the primitive drawing methods; one fills shapes (FillEllipse, FillRectangle, etc.) and the other renders only the outline of an empty shape (the context’s DrawEllipse or DrawRectangle methods).
We will now add a scatter plot to our GraphRenderer, but there are some big problems with our charting application that will become apparent as a result and will lead nicely to the next section.
Add the #include to the top of the GraphRenderer.h file (I have also included a gradient background).
// // Additional headers for graph objects here // #include "GradientBackground.h" #include "ScatterPlot.h" |
Add a GraphVariable pointer member to the graph renderer class. This will be used as the ScatterPlot in this chapter, but it will also be used as the LineChart later.
private: // Global pan value for moving the chart with the mouse Windows::Foundation::Point m_pan; // Background GradientBackground *m_gradientBackground; // Plottable data GraphVariable* m_graphVariable; |
Call the constructors for the GradientBackground and the new ScatterPlot in the GraphRenderer's constructor in the GraphRenderer.cpp file.
GraphRenderer::GraphRenderer() { // Create the gradient background: D2D1_COLOR_F colors[] = { D2D1::ColorF(ColorF::PaleGoldenrod), D2D1::ColorF(ColorF::PaleTurquoise), D2D1::ColorF(0.7f, 0.7f, 1.0f, 1.0f) }; float stops[] = { 0.0f, 0.5f, 1.0f }; m_gradientBackground = new GradientBackground(colors, stops, 3); // Create the scatter plot: const int count = 500; // Create 500 nodes float* x = new float[count]; float* y = new float[count]; // Create random points to plot, these // would usually be read from some data source: for(int i = 0; i < count; i++) { x[i] = (float)(rand() % 2000); y[i] = (float)(rand() % 1000); } m_graphVariable = new ScatterPlot(x, y, 10.0f, D2D1::ColorF::Chocolate, NodeShape::Circle, count); delete[] x; delete[] y; } |
Call the ScatterPlot’s CreateDeviceDependentResources method and the GradientBackground’s CreateWindowSizeDependentResources methods. In the following code I have also set the initial values for the m_pan member variable so the data will be visible when the application starts. Otherwise the data would be plotted off the screen.
void GraphRenderer::CreateDeviceResources() { DirectXBase::CreateDeviceResources(); // Call the create device resources for our graph variable m_graphVariable->CreateDeviceDependentResources(m_d2dContext); } void GraphRenderer::CreateWindowSizeDependentResources() { DirectXBase::CreateWindowSizeDependentResources(); // Create window size resources for gradient background m_gradientBackground->CreateWindowSizeDependentResources(m_d2dContext); // Set the initial pan value so the lowest node is visible in the corner m_pan.X = -m_graphVariable->GetMinX(); m_pan.Y = -m_d2dContext->GetSize().height - m_graphVariable->GetMinY(); } |
And finally, render the GradientBackground and the ScatterPlot in the GraphRenderer::Render method.
void GraphRenderer::Render() { m_d2dContext->BeginDraw(); // Reset the transform matrix so our background does not pan m_d2dContext->SetTransform(m_orientationTransform2D); // Render the background m_gradientBackground->Render(m_d2dContext); // Pan the chart Matrix3x2F panMatrix = Matrix3x2F::Translation(m_pan.X, m_pan.Y + m_d2dContext->GetSize().height); m_d2dContext->SetTransform(panMatrix*m_orientationTransform2D); // // Draw objects here // // Render the graph variable m_graphVariable->Render(m_d2dContext); // Ignore D2DERR_RECREATE_TARGET error HRESULT hr = m_d2dContext->EndDraw(); if (hr != D2DERR_RECREATE_TARGET) DX::ThrowIfFailed(hr); } |
Upon running the application, you should see something similar to Figure 17.
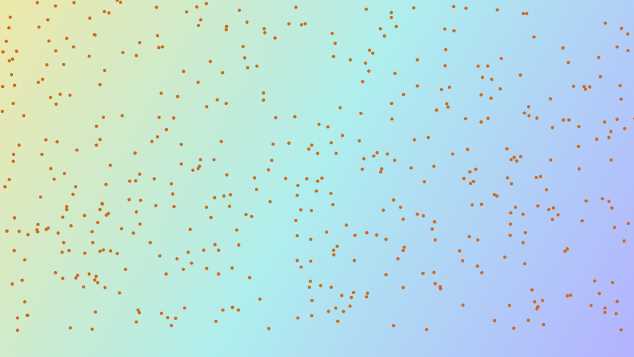
- Scatter Plot Screenshot
The problem with our chart is that this looks like a scatter plot, but actually the y-axis is reversed. In computer graphics, the point (0, 0) refers to the pixel at the top left corner of the screen. Y values increase down the screen, while x values increase across the screen to the right. This behavior in the y-axis is the exact opposite of the way charts are normally rendered. Usually the point at the lower left corner is used to represent the origin (0, 0). If the data is changed from being random to increasing coordinates in both the x-axis and y-axis, you will see a diagonal line of nodes running from the top left toward the lower right.
// Create the scatter plot: const int count = 500; // Create 500 nodes float* x = new float[count]; float* y = new float[count]; // Create random points to plot, these // would usually be read from some data source: for(int i = 0; i < count; i++) { x[i] = i; //(float)(rand() % 2000); y[i] = i; //(float)(rand() % 1000); } m_graphVariable = new ScatterPlot(x, y, 10.0f, D2D1::ColorF::Chocolate, NodeShape::Circle, count); |
Upon running the application, you should see something like Figure 18.

- Scatter Plots Rendered in a Line
This is an image of 500 nodes all in a line, so close together that there are no gaps at all. The problem is that the whole y-axis needs to be flipped. We could do this fairly easily by multiplying each y value for the scatter plot by -1 and accounting for the screen's height. We could do this either when we create the scatter plot's data or when we render the nodes. However, there is a far better way. The GPU can easily flip the y-axis for us with just a few lines of code by applying a transform.
2-D Transformations
The movement, rotation, zooming, and many other aspects of DirectX scenes can be implemented using transformation matrices. Transformations are applied by creating matrices that can control almost all aspects of rendering: from an object's size and rotation settings, to its position and eventual pixels on the screen.
Note: The graphics card is specifically built to perform this type of operation. It applies matrix transforms to a collection of points or vertices far more efficiently than a CPU. It is an inherently parallel device, having many low powered execution units (perhaps hundreds of cores), as opposed to the multicore CPU, which has only a few high powered cores.
Matrices make graphics programming much easier. Matrix multiplication is cumulative, such that if you multiply a translation matrix by a rotation matrix, it will result in a single matrix that both translates and rotates. This is exactly the way the various transforms are applied to our objects when we render with DirectX.
Graphics programming is an excellent way to introduce matrix operations. It is very easy to see the effect of multiplying matrices when a scene is drawn using the results. The matrices used in 2-D and 3-D graphics are usually very small, consisting of perhaps 3 to 16 components. The steps to multiplying matrices can be found in many places on the Internet, and will not be examined in this book.
I will not describe matrix multiplication in detail, but one of the most important differences between matrix multiplication and regular arithmetic is that matrix multiplication is not commutative. If we have two matrices, one for translation and another for rotation, the order that they are multiplied is very important:
- Translation*Rotation ← Translate first then rotate
- Rotation*Translation ← Rotate first then translate
The top product translates first, and then rotates about the translated points. The lower product will rotate about the origin, and then translate the points in the direction of the rotation. Also, when two matrices are multiplied together, the result is a single matrix which does what both of the original two matrices did.
There are static helper functions in the Matrix3x2F class that can be used to create common transformations. The functions are Translation, Rotation, Scale, Skew, and Identity. To apply a collection of transformation matrices, create the matrices with the appropriate helper functions, multiply them together, and supply the resulting matrix as a parameter to the SetTransform method. SetTransform is a method belonging to the ID2D1DeviceContext, which is used to set the context’s current transformation matrix. For example, to pan and translate, or scale and rotate, create three matrices for each transformation. Multiply the three matrices together in the call to the SetTranform method. The multiplication results in a single matrix that does all three jobs, panning, scaling, and rotating.
// Define each of the transformations Matrix3x2F pan = Matrix3x2F::Translation(10.0f, 15.0f); // Pan 10 × 15 pixels Matrix3x2F scale = Matrix3x2F::Scale(10.0f, 10.0f); // Scale 10 times the size Matrix3x2F rotate = Matrix3x2F::Rotation(25.0f);// Rotate 25 degrees // Apply them all by multiplying together m_d2dContext->SetTransform(pan * scale * rotate); |
For the following discussion I will use a new Direct2D (XAML) template project for illustration. We will apply transformation to our charting application afterward. The code being altered is in the SimpleTextRenderer::Render method. The lines we are interested in have been highlighted in the following code:
void SimpleTextRenderer::Render() { m_d2dContext->BeginDraw(); m_d2dContext->Clear(ColorF(BackgroundColors[m_backgroundColorIndex])); // Position the rendered text. Matrix3x2F translation = Matrix3x2F::Translation( m_windowBounds.Width / 2.0f - m_textMetrics.widthIncludingTrailingWhitespace / 2.0f + m_textPosition.X, m_windowBounds.Height / 2.0f - m_textMetrics.height / 2.0f + m_textPosition.Y ); // Note that the m_orientationTransform2D matrix is post-multiplied here // in order to correctly orient the text to match the display orientation. // This post-multiplication step is required for any draw calls that are // made to the swap chain's target bitmap. For draw calls to other targets, // this transform should not be applied. m_d2dContext->SetTransform(translation * m_orientationTransform2D); m_d2dContext->DrawTextLayout( Point2F(0.0f, 0.0f), m_textLayout.Get(), m_blackBrush.Get(), D2D1_DRAW_TEXT_OPTIONS_NO_SNAP ); // Ignore D2DERR_RECREATE_TARGET. This error indicates that the device // is lost. It will be handled during the next call to Present. HRESULT hr = m_d2dContext->EndDraw(); if (hr != D2DERR_RECREATE_TARGET) { DX::ThrowIfFailed(hr); } m_renderNeeded = false; } |
Translation Transform
The translation transform is applied to a matrix, and the matrix is used to transform a set of points. This is a movement transform that can be used to pan our chart. Open a new Direct2D (XAML) project, and open the SimpleTextRenderer.cpp file. Scroll down to the Render method, and at line 103 you will see a translation matrix being created. This particular matrix calculates the x and y values for the text, such that it begins centered and can be dragged around with the pointer. The DirectX XAML page captures the pointer movements, recording the x and y position in the m_textPosition member variable.
// Position the rendered text. Matrix3x2F translation = Matrix3x2F::Translation( m_windowBounds.Width / 2.0f - m_textMetrics.widthIncludingTrailingWhitespace / 2.0f + m_textPosition.X, m_windowBounds.Height / 2.0f - m_textMetrics.height / 2.0f + m_textPosition.Y ); |
The matrix is comprised of two components, the amount to translate in the x or horizontal axis, and the amount to translate in the y or vertical axis.
Matrix3x2F translation = Matrix3x2F::Translation ( amountToMoveInHorizontal, // X-axis 0 is far left amountToMoveInVertical // Y-axis 0 is top of screen ); |
To place the text at the top left corner of the screen, you could set both these values to 0.0f. This would mean do not translate the axis at all.
// Position the rendered text. Matrix3x2F translation = Matrix3x2F::Translation( 0.0f, 0.0f ); |
This will produce something like Figure 19, and the text will no longer move around with the pointer.

No Translation
In this particular program we also see that the matrix defined previously is multiplied by a matrix called m_orientationTransform2D (in the context’s call to SetTransform). The orientation matrix is updated when the program is run on a WinRT device, such that if the user turns the screen, the text can correct itself and always be displayed upright. The values for the orientation matrix are set up in the DirectXBase class. Remember that two or more matrices can be multiplied together to produce a single matrix that contains all the transformations of the original matrices.
Rotation Transform
The rotation transform in Direct2D allows objects to rotate clockwise or counterclockwise around some defined point. If you define a rotation transform just after the translation matrix, and then multiply the translation and orientation matrices by this new matrix, you will see the text has been rotated by 45 degrees in a clockwise direction.
// Position the rendered text. Matrix3x2F translation = Matrix3x2F::Translation( m_windowBounds.Width / 2.0f - m_textMetrics.widthIncludingTrailingWhitespace / 2.0f + m_textPosition.X, m_windowBounds.Height / 2.0f - m_textMetrics.height / 2.0f + m_textPosition.Y ); // Rotate text about the middle Matrix3x2F rotation = Matrix3x2F::Rotation ( 45.0f, // Angle to rotate in degrees, clockwise is positive D2D1::Point2F ( m_textMetrics.widthIncludingTrailingWhitespace / 2.0f, // X position of origin m_textMetrics.height / 2.0f // Y position of origin ) ); // Apply the rotation, then the translation, and then the orientation matrix m_d2dContext->SetTransform(rotation * translation * m_orientationTransform2D); |

Rotation
The text in Figure 20 has been rotated about its center point since this was the origin specified in the rotation matrix. The origin specified in the matrix is the point about which the rotation is to occur; it is the point that will remain static. If instead we specify the origin to rotate as the point (0, 0), the text will be rotated about its top left corner (the output of this will look like Figure 21).
// Position the rendered text. Matrix3x2F translation = Matrix3x2F::Translation( m_windowBounds.Width / 2.0f - m_textMetrics.widthIncludingTrailingWhitespace / 2.0f + m_textPosition.X, m_windowBounds.Height / 2.0f - m_textMetrics.height / 2.0f + m_textPosition.Y ); // Rotate text about the middle Matrix3x2F rotation = Matrix3x2F::Rotation ( 45.0f, // Angle to rotate in degrees D2D1::Point2F ( 0.0f, // X position of origin 0.0f // Y position of origin ) ); // Apply the rotation, then the translation, and then the orientation matrix m_d2dContext->SetTransform(rotation * translation * m_orientationTransform2D); |

Rotation
The other extremely important point to reiterate is that matrix multiplication is not commutative. If we apply the rotation after the translation by placing it as the second operand in the string of matrix multiplications in the call to SetTransform, we see that the effect is very different.
m_d2dContext->SetTransform(translation * rotation * m_orientationTransform2D); |

Rotation

Order of Transforms
In Figure 22 the text is almost rotated off the screen altogether. The origin of the rotation is (0, 0), the top left corner of the screen (the second parameter in the call to create the matrix). Figure 23 is an illustration of the order of transformations that lead to the text appearing half rotated off the screen:
Scale Transform
Scaling applies a multiplier to one or both of the axes in order to shrink or enlarge the rendered shapes. The scale transform requires three parameters, an X multiplier, a Y multiplier and an origin about which to scale. The output from this code should look like Figure 24.
// Position the rendered text. Matrix3x2F translation = Matrix3x2F::Translation( m_windowBounds.Width / 2.0f - m_textMetrics.widthIncludingTrailingWhitespace / 2.0f + m_textPosition.X, m_windowBounds.Height / 2.0f - m_textMetrics.height / 2.0f + m_textPosition.Y ); // This will make the text 3 times wider and half as high! Matrix3x2F scale = Matrix3x2F::Scale ( 3.0f, // Multiply x by 3 0.5f, // Halve the y values D2D1::Point2F( // Make the origin the middle of the text m_textMetrics.widthIncludingTrailingWhitespace / 2.0f, m_textMetrics.height / 2.0f) ); // Apply the scale, then the translation, and then the orientation m_d2dContext->SetTransform(scale * translation * m_orientationTransform2D); |

Scaling
The scale’s origin was calculated such that the text grows and shrinks from its center point, the letter D. I have marked the code which calculates the origin in blue. Moving the text first, and then applying the scale produces very different results, similar to rotation and translation:
// Position the rendered text. Matrix3x2F translation = Matrix3x2F::Translation( m_windowBounds.Width / 2.0f - m_textMetrics.widthIncludingTrailingWhitespace / 2.0f + m_textPosition.X, m_windowBounds.Height / 2.0f - m_textMetrics.height / 2.0f + m_textPosition.Y ); // This will make the text 3 times wider and half as high! Matrix3x2F scale = Matrix3x2F::Scale ( 3.0f, // Multiply x by 3 0.5f, // Halve the y values D2D1::Point2F( // Make the origin the middle of the text m_textMetrics.widthIncludingTrailingWhitespace / 2.0f, m_textMetrics.height / 2.0f) );
m_d2dContext->SetTransform(translation * scale * m_orientationTransform2D); |
The text is first translated to the center of the screen using the translation matrix. When the scale matrix is applied, the current position of the text is multiplied by 3.0f in the x-axis and halved (multiplied by 0.5f) in the y-axis. This leads to the text being off the screen altogether. I have depicted the area outside the right side of the screen as a dark blue color in Figure 25, so we can see where our text has gone.

Order of Transforms 2
Like the rotation matrix, the scale matrix requires the specification of an origin point. The origin point is the point that will remain static throughout the growing and shrinking. In the previous example it was the center of the text, but it can be any point, even points well outside the bounds of the text. For instance, if we change the origin to the top right corner of the text, we can see that it no longer grows and shrinks from the center, but leftwards and downwards instead.
// Position the rendered text. Matrix3x2F translation = Matrix3x2F::Translation( m_windowBounds.Width / 2.0f - m_textMetrics.widthIncludingTrailingWhitespace / 2.0f + m_textPosition.X, m_windowBounds.Height / 2.0f - m_textMetrics.height / 2.0f + m_textPosition.Y ); // This will make the text 3 times wider and half as high! Matrix3x2F scale = Matrix3x2F::Scale ( 3.0f, // Multiply x by 3 0.5f, // Halve the y values D2D1::Point2F( // Make the origin the top right corner m_textMetrics.widthIncludingTrailingWhitespace, 0.0f) ); // Apply the scale, then the transform, and then the orientation m_d2dContext->SetTransform(scale * translation * m_orientationTransform2D); |

Scaling
The origin remains fixed in Figure 26. The text is squashed along the y-axis and stretched along the x-axis. If you apply the scale after the translation, then the translation will also be scaled.
Note: There are other transformations in Direct2D that can be used to produce a variety of effects. Matrix3x2F::Identity() is a matrix with the original or default values. It can be used to reset the transformations. The Skew matrix is also interesting; it can be used to produce some simple perspective transformations on 2-D data.
Translating the Scatter Plot
Now that we have looked at how to transform the objects we are drawing, we can fix our scatter plot. By default, the computer will assume the top left corner is the origin, and the y-axis increases downwards and to the right. We want our origin to be in the lower left corner of the screen, and we want the y-axis values to increase up the screen.
To fix our scatter plot, we can apply two matrices, a scale matrix and a translation. The scale matrix multiplies all the y values by -1.0f, thereby inverting the y-axis. In flipping the y-axis, we have flipped all the data upwards above the screen. The translation matrix can be used to add the screen's height, so we are once again looking at the data.
void GraphRenderer::Render() { m_d2dContext->BeginDraw(); // Reset the transform matrix so our background does not pan m_d2dContext->SetTransform(m_orientationTransform2D); // Render the background m_gradientBackground->Render(m_d2dContext); // The scale matrix inverts the y-axis Matrix3x2F scale = Matrix3x2F::Scale(1.0f, -1.0f, D2D1::Point2F(0.0f, 0.0f)); // The pan matrix still pans but it also adds the height of the screen Matrix3x2F panMatrix = Matrix3x2F::Translation(m_pan.X, m_pan.Y + m_d2dContext->GetSize().height); // Apply the scale first m_d2dContext->SetTransform(scale*panMatrix*m_orientationTransform2D); // // Draw objects here // // Render the graph variable m_graphVariable->Render(m_d2dContext); // Ignore D2DERR_RECREATE_TARGET error HRESULT hr = m_d2dContext->EndDraw(); if (hr != D2DERR_RECREATE_TARGET) DX::ThrowIfFailed(hr); } |
Before we run the application, we also need to adjust the initial starting position for the m_pan member variable. This is specified in the GraphRenderer:CreateWindowSizeDependentResources method, the x value can stay the same but the y value must be changed since we flipped the axis.
void GraphRenderer::CreateWindowSizeDependentResources() { DirectXBase::CreateWindowSizeDependentResources(); // Create window size resources for gradient background m_gradientBackground->CreateWindowSizeDependentResources(m_d2dContext); // Set the initial pan value so the lowest node is visible in the corner m_pan.X = -m_graphVariable->GetMinX(); m_pan.Y = m_graphVariable->GetMinY(); } |
Upon running the application, you should now see that the origin is in the lower left corner and the y-axis increases upwards, exactly the same as a regular graph.

Scatter Plot with Flipped Y-Axis
- 1800+ high-performance UI components.
- Includes popular controls such as Grid, Chart, Scheduler, and more.
- 24x5 unlimited support by developers.