
Database Design Succinctly®

CHAPTER 3
Conceptual Model
In this chapter, we will explore how to create a conceptual model.This is the start of the requirements-gathering phase. Although gathering might be too gentle of a description; it is more like hunting the requirements down. Often, you will need to work with multiple people to get an overview of the business, which is how the conceptual model will get created.
As you work through the business process documentation, you should keep an ongoing list of entities (people and things) and relationships among the entities (usually derived by understanding the actions that occur among the entities). I generally include these items when reviewing the business processes:
- Entity: Person or thing to be modeled.
- Relationship type: Relationship to another entity (one-to-one, one-to-many, many-to-many).
- Related entity: Other entity related to the first entity.
- Action: Short, descriptive text of relationship.
- Source: Person or department that provided the information.
- System: System (HR, order, finance, and so on). Entities are part of this higher system.
One key idea is to keep your conceptual model simple, but thorough. The goal is to produce a quick, easy-to-use overview. It is better to have several smaller conceptual models than one large model that quickly becomes difficult to follow.
It is also a good idea to know where the information came from. The warehouse model starts with the order, and while at the warehouse they know the order is associated with a customer, they most likely are not familiar with any credit checking that gets done before the order is placed. Just as likely, the finance department generally does not know the details of the warehouse and shipping department.
Use cases
A use case is a written description of actors and actions they perform. It often includes a name, description, and diagram. It includes the actor (role acting), any necessary preconditions, and the workflow. For example, a customer placing an order might look like Figure 11.
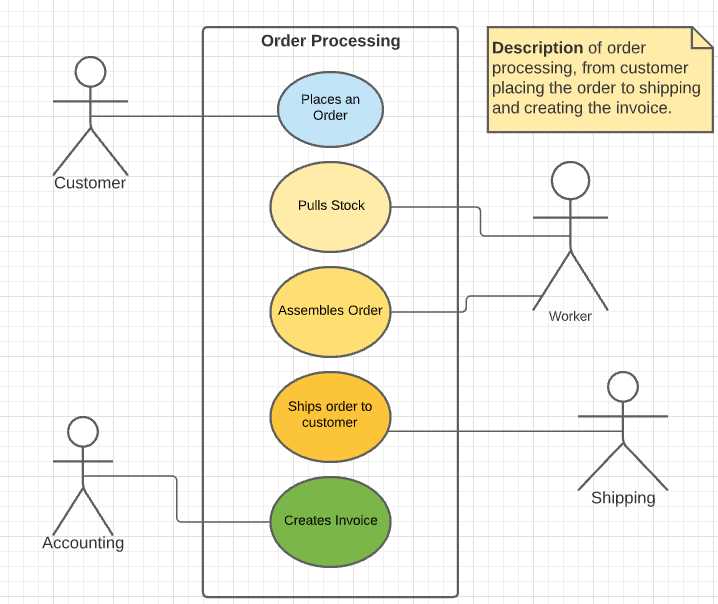
Figure 11: Order use case
From this diagram, we can extract entities (people and things). We see a customer, some employees, an order, stock, and invoice entity. Not all entities need to be modeled; for example, we might not need employees, but rather departments.
We can determine a relationship between the customer and the order, the order and both the warehouse (worker) and shipping department (shipping). There is also a relationship between the invoice and the accounting department.
Note that what doesn’t appear in the diagram, but might be implied, is a relationship between the invoice and the customer (or the invoice and the order itself, depending upon whether an invoice can cover multiple orders).
Implied entities
While the use case appears complete, you should ask questions. For example, does the shipment always go to the same location? If the answer is no, then there is an implied shipping address associated with the customer with a one-to-many relationship (one customer to many shipping addresses) between the two entities.
SIPOC diagram
Another tool to consider is the SIPOC diagram. This is a Six Sigma tool used to document business processes. The acronym stands for suppliers, inputs, process, outputs, and customers.
The Suppliers column shows the people, departments, etc., that create an input. For an ordering system, the suppliers are the customer, who creates the order input; the warehouse workers, who will pick and assemble the order; and finally, the finance department, who will create the invoice.
Table 2: A sample SIPOC diagram for ordering
Suppliers | Inputs | Process | Outputs | Customers |
Client | Order | Calls or places order via the website. | Items ordered | Warehouse |
Warehouse | Items ordered | Gather items ordered. Place in shipping boxes. Add shipping label. | Assembled shipment | Shipping |
Shipping | Shipment | Create invoice for items. Mail invoice to the customer. | Invoice | Finance |
From this chart, we see the client or customer entity, the order entity, and the invoice entity. We can also see a list of items on the order that needs to be generated, both for the shipping and the finance departments.
We can also see relationships, such as the client being associated with the order, and the order line items being linked to the order entity. The invoice is tied to the order and a customer.
Flow charts
A flow chart is a series of symbols and connecting lines that describes a process. The processes are defined as rectangles, and the decision is a diamond with Yes and No pathways. The user can follow the flowchart steps to determine the process. In Figure 12, we have an example of the process flow to determine if a customer has a good credit rating before placing an order.
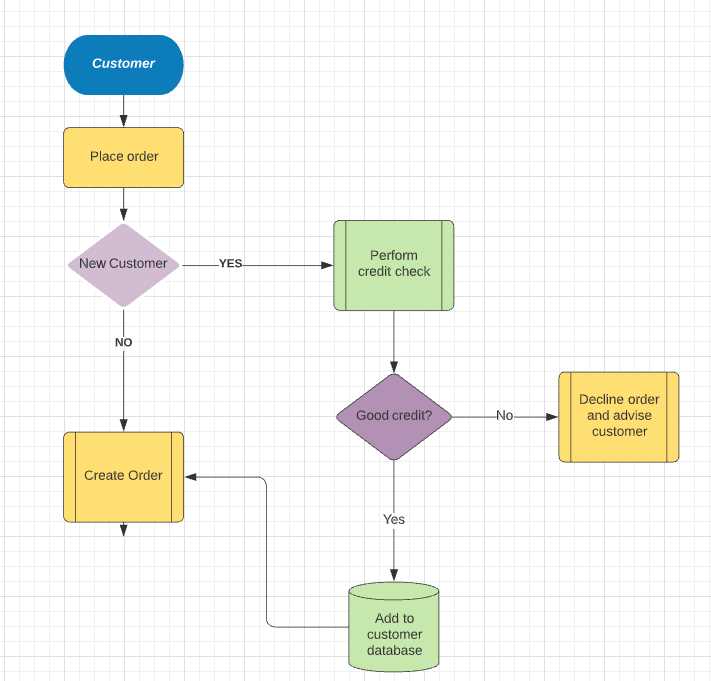
Figure 12: Credit check flowchart
The customer and order entities are defined on the flowchart, and the finance or accounting department is implied (someone needs to perform the credit check). We can also see that the customers are saved in a database. This is done from the accounting department.
Workflow diagrams
A workflow diagram is a graphic image depicting the departments, artifacts, and steps that define a business process. They show a linear flow, with some Yes/No or True/False branching as needed. Microsoft Visio allows users to define their business processes as workflow diagrams.
Figure 13 shows a sample of a workflow diagram, showing a customer placing an order via a website, and the order being sent to the finance department for approval (courtesy of Erica Quigley from her business process book).
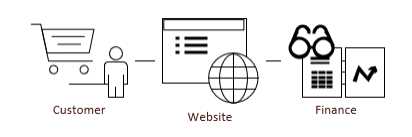
Figure 13: Workflow diagram
From the workflow diagram, we have identified the customer and finance department entities, and the website entity is where the order entity is defined.
Whiteboard
Sometimes you might need to have a meeting with various departments and sketch out the steps in the process on a whiteboard. Often in these types of meetings, a lot of the “steps” the departments just do, get spelled out. For example, when describing the process of assembling an order, a good facilitator might drill down and discuss what to do when an item being requested is backordered. If it happens infrequently, the employees might not even think about it, but it is still an important piece of information to determine.

Figure 14: A whiteboard session
Back of the napkin
Let’s say you encounter a person who has been doing their work a long time, but they’ve never written the actual process down. In this case, you will likely sketch the process learned from that conversation onto a napkin, rather than formal documentation for the process.
Summary
You will likely encounter a variety of different ways that business processes are documented, and just as likely, find processes without documentation. The gathering-of-requirements phase will likely be a mishmash of documents, diagrams, and conversations. As you understand the businesses processes, the components of the conceptual model should become clear.
It is important not to skip or gloss over the conceptual model. Some business processes occur infrequently and can be easily missed if you jump directly to the logical model. Be sure to understand all the processes you need to create the database for, not just the most common processes.
Once you’ve determined all the entities and relationships from your gatherings, you can build your conceptual model. Place the entities on a diagram, with simply an entity name. Draw lines between the entities, thinking in terms of one-to-one or one-to-many links between them. Typically, you will label the line with a brief word or two explaining how they are linked.
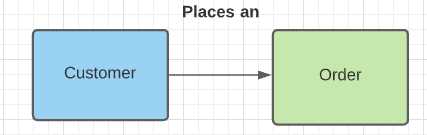
Figure 15: Two entities linked together
Do not create a large conceptual model; it is difficult to understand. It is better to have two separate models when the systems are not related, than one monolithic model that will be very difficult to grasp quickly.
Note: If you’d like to learn more about business process modeling, check out Erica Quigley’s book, Business Flow Process Mapping Succinctly, on the Syncfusion site.
- 1800+ high-performance UI components.
- Includes popular controls such as Grid, Chart, Scheduler, and more.
- 24x5 unlimited support by developers.