
CUDA Succinctly®

CHAPTER 9
Nsight
This chapter is mostly relevant to readers who use Visual Studio Professional. The Nsight debugger is a free download from the NVIDIA website. Unfortunately the Express editions of Visual Studio do not allow extensions such as Nsight to be installed.
If you are using the Express edition of Visual Studio, this chapter still may offer some insight into how the device works, but you will not be able to work along with the examples I present.
The Nsight debugger is useful for debugging graphics APIs like DirectX and OpenGL as well as compute APIs. The debugger is available from the following website:
https://developer.nvidia.com/nvidia-nsight-visual-studio-edition
To download Nsight from the previous link, you will need to register as an NVIDIA developer and log in to your account. To register as a CUDA developer, visit the following website:
https://developer.nvidia.com/programs/cuda/register
The registration and download procedure for Nsight changes over time, and you may need to provide additional details to NVIDIA’s staff before you are allowed access the Nsight debugger download.
The download comes with an automatic installer, so to add the extension to Visual Studio you only need to double-click the downloaded file. Once Nsight is installed, you should be able to run Visual Studio Professional and see the Nsight option in the menu bar.
Generating Profiling Reports
Nsight can generate very detailed reports including all the information that the profiler (NVVP) generates, and a lot more. Choose Nsight > Start Performance Analysis from the menu bar. You should see a window that looks like Figure 10.1.
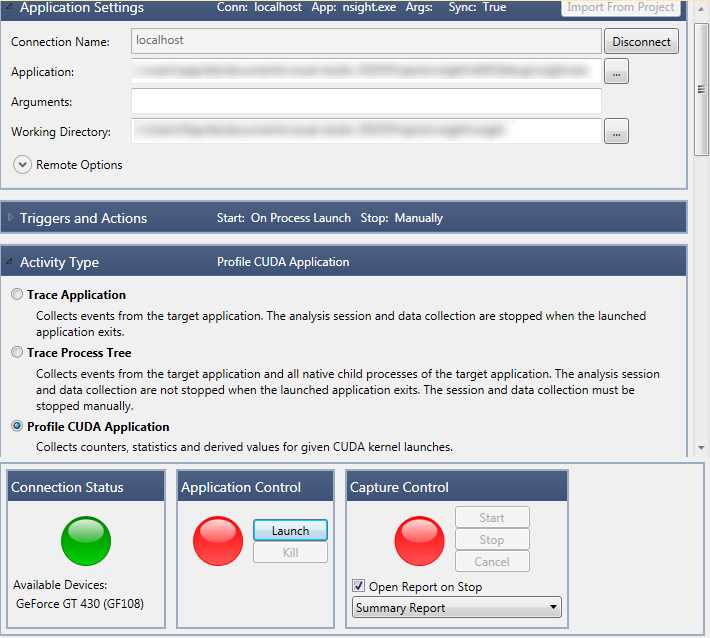
Figure 10.1: Profiling with Nsight
Select Profile CUDA Application and click the Launch button to run the application and collect metrics just like those from the NVVP. Once the application closes, you will see the Reports tab pictured in Figure 10.2. The CUDA Launches selection will show similar data to the NVVP reports.
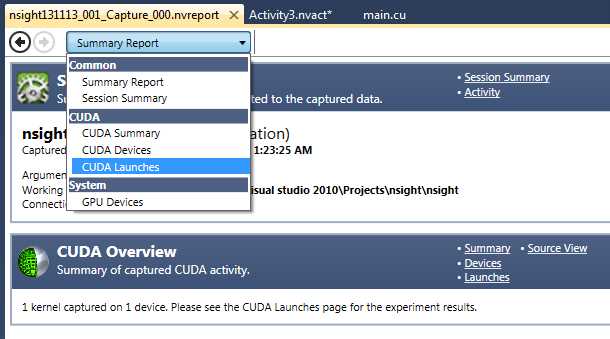
Figure 10.2: Reports from Nsight Profiler
Selecting the CUDA Devices or GPU Devices reports shows information about the device used in the application. This information is similar to that of Device Query, but much more detailed. There is also a very large number of other reports that can be generated, and which I encourage you to explore.
Debugging
Using Nsight, we can break into the code of a kernel just as we can in regular application code. To do this, set a breakpoint by clicking in the left margin of the Visual Studio code window, in exactly the same way you would set a host breakpoint. To debug CUDA code, the Nsight monitor must be running. Instead of debugging with the Start Debugging option in the menu bar, you have to select Start CUDA Debugging from the Nsight menu.
The application will run until the breakpoint is hit; then it will pause and pass control back to Visual Studio. When the program pauses at a breakpoint, you can open two very interesting windows. In the menu bar under the Nsight item, select Windows > CUDA Info. This will open the CUDA Info window. Or you can open a Warp Watch window by selecting Window > Warp Watch. The CUDA Info and Warp Watch windows are only available from the menu bar when the application hits a breakpoint.
Tip: You can freeze the warps that you aren’t interested in debugging by choosing Nsight > Freeze and either Freeze all except current block or Freeze all except current warp. This will prevent the other warps or blocks from proceeding. When you resume from a break point, the device will break again at the next warp or block, depending on the setting. In this way you can examine each warp or block in turn.
CUDA Info Window
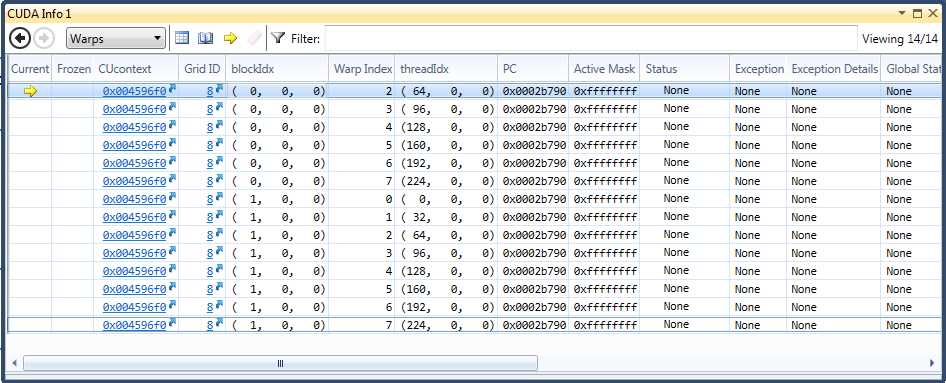
Figure 10.3: CUDA Info Window
From the CUDA Info window, you can view information on many aspects of the application by clicking the drop-down list in the upper-left corner, including warps (the default), textures, and memory allocations. The screenshot in Figure 10.3 displays the warps information. Clicking the values highlighted in blue will take you to the info pages for those items.
When CUDA is debugging you can, as expected, press F11 to step into and F10 to step over the code. Figure 10.4 shows more details in the Warp Info window. You can see which line in the code the warp is up to, and whether a warp is active in the device or not.
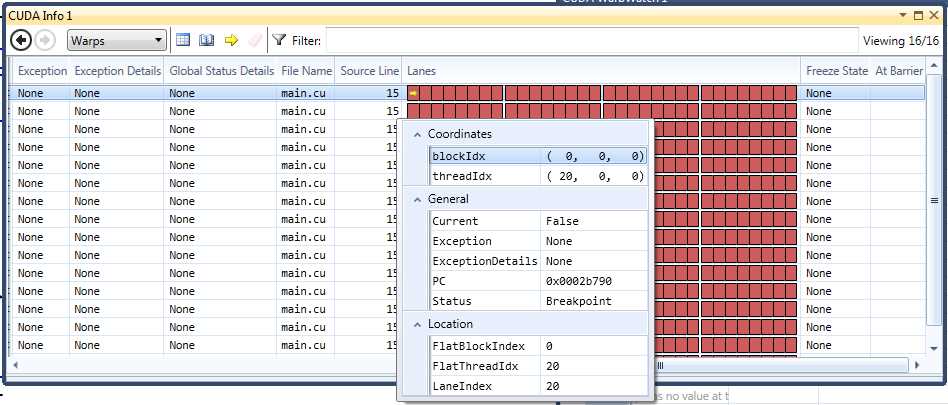
Figure 10.4: Lanes, source lines, and status
Tip: If you double-click on a warp in the CUDA Info window, it will cause all open Warp Watch windows to display the known information for the selected warp.
You can get a good idea of the way branching splits up your warps by examining the Lanes view of the CUDA Info window. When a warp is split into one or more groups, some threads become inactive while a single branch is executed. After each branch's code is executed, the threads re-join each other and continue as a collection of 32. Figure 10.5 illustrates a warp of threads that has been split into two, giving us even threads and odd threads.
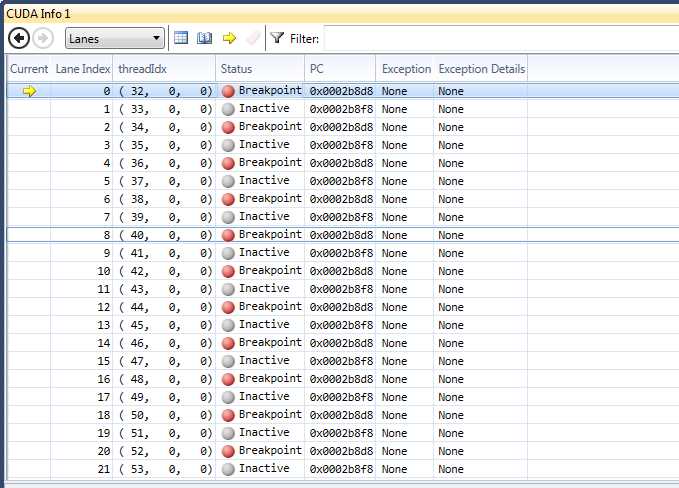
Figure 10.5: Lanes and Branching
Warp Watch Window
We can set a watch on a variable to track how it changes as a warp executes. Since 32 threads of a warp all execute in step, it is more useful to watch 32 copies of the same variable, one for each thread of a warp. You can open up to four Warp Watch windows from the menu bar under Nsight > Windows > CUDA Warp Watch. Set a break point in your code and use Start CUDA Debugging to debug your program. Figure 10.6 shows an example Warp Watch window.
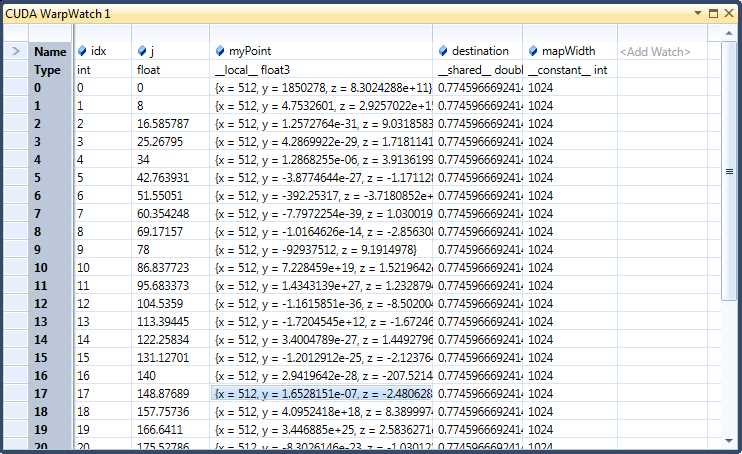
Figure 10.6: Warp Watch
To add a watch to the Warp Watch window, at the point a program breaks, click on the gray <Add Watch> cell shown in the upper-right corner of Figure 10.6 and type the name of the variable you would like to observe. You can step through the code line by line using F10 (step over) or F11 (step into) and see how the 32 warps’ variables change. If you have a CUDA Info window open, you can double-click on any currently displayed warp (each line in the warp’s view represents a different warp). The Warp Watch windows will switch to the variables for the selected warp. To load the first warp of a block into the open CUDA warp watches, double-click a block in the Blocks view of the CUDA Info window.
Tip: To set a watch on variables in shared memory, you should turn on Verbose PTAXS Output. This option can be found in the project properties in the CUDA C/C++ section.
Tip: To set a watch on variables in shared memory, you should turn on Verbose PTAXS Output. This option can be found in the project properties in the CUDA C/C++ section.
Be sure to rebuild your application before starting the Nsight debugger (Ctrl+Shift+B). The debugger may not rebuild prior to running the application, so if you have made changes to your code, the project must be rebuilt.
Tip: You might notice the variables in a warp window not changing with the cursor. To better match the change of variables with the cursor, navigate to Nsight > Options and set the value for the Default Timeline Axis Mode to Relative to Cursor.
When the application uses the Nsight debugger, it runs on the host. You can use cout to quickly write to the console window. If you use printf, the Nsight debugger will print to the screen, and you can also debug with the standard Visual Studio debugger. When you debug with Visual Studio, all calls to printf are ignored, and calls to cout in kernels will result in a compilation error. Remove all cout and printf calls in production code.
- 1800+ high-performance UI components.
- Includes popular controls such as Grid, Chart, Scheduler, and more.
- 24x5 unlimited support by developers.