
Business Process Flow Mapping Succinctly®

CHAPTER 7
Workflow Diagrams
Beginning
In Microsoft Visio, create a new document by choosing Work Flow Diagram.

Figure 44: Creating a New Work Flow Diagram
Next, choose a template or a blank page. In the following example, we start with a blank page.
Since the workflow diagram is an overview of the departments, objects, and steps that are involved in a process within a company, the beginning point is the department, object, or step that begins the process. Remember that this is a high-level diagram. So, let’s say we are mapping the customer ordering a product from the company’s website, and we want to show the management team the steps that occur. In this instance, we would start with the “Customer” as the first step.
Click the Customer icon and drag it onto the blank page. Repeat this by dragging the next icon for the Website onto the blank page.
![]()
Figure 45: Drag an Icon onto the Work Flow Diagram
To add descriptive text, double-click the icon, and a text box will appear. Once the desired icons are on the page, connect them by clicking Insert > Connector.

Figure 46: Insert Connector onto Work Flow Diagram
Next, hover the pointer over the icon to be connected; selection dots will appear on the icon’s sides. Choose the dot on the side you want to connect, and then drag it over to the next icon. The two will connect.
![]()
Figure 47: Connect Icons on Work Flow Diagram

Figure 48: Workflow Diagram
For simplicity, Figure 48 shows a three-step process where the customer goes to the website to place their order. The order is then sent to the finance department.
Split paths
The workflow diagram is high-level and illustrates the involvement of different departments and people in the company. A split path occurs if a department or individual has multiple outputs.
The following figure was created by dragging additional icons and adding connectors in the same manner as described previously.

Figure 49: Workflow Diagram with Split Path
Figure 49 shows that the website sends the order information to the finance department, but it also sends a confirmation email back to the customer stating that the order has been successfully received. Both of those outputs should be connected to the Website icon.
Decision points
A decision point is when a department or individual must make a decision that affects the path of the process flow. Continuing along the same example, Figure 49 illustrates the process if the finance department cannot find the customer’s information in their system and needs to escalate to management.

Figure 50: Workflow Diagram with Decision Point
Figure 50 shows two paths that the finance department can take. Either the customer does or does not exist within their database. It is clear in this process flow what action should be taken in either situation, and the workflow diagram is labeled so that the audience can understand that this split represents two different outcomes: The customer information is in the database, or it is not.
This clarity makes it easy for the finance department to complete their tasks without questions, and for the audience to understand why the finance department makes the decisions they do.
To add text to show decision options, double-click the connector where text is to be displayed, and then type a short description of the option into the text box.
Decision points need to show the outcomes of the respective paths. The customer order example shows that management reviews the order if the customer does not exist in the database. If management cannot resolve the issue, they then send the order to the legal department, as shown in Figure 50. If management does resolve the issue, then the process flows back to finance.
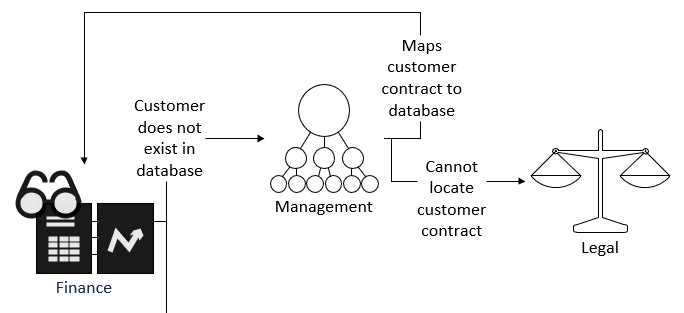
Figure 51: Workflow Diagram with Decision Point
- 1800+ high-performance UI components.
- Includes popular controls such as Grid, Chart, Scheduler, and more.
- 24x5 unlimited support by developers.