
Business Process Flow Mapping Succinctly®

CHAPTER 6
Rules of Engagement
Starting point
A workflow diagram begins with the first department, object, or step in a process. However, if you’re using a basic or cross-functional diagram, the starting point should always be an ellipse, since that shape specifically indicates a start.
The starting point should be the beginning of the process scope being documented. Remember to take your audience into consideration, and make sure that the starting point makes logical sense to them. The audience should not wonder about preceding steps; they should understand why the starting point is what it is.
Connections
Each shape should connect to the previous and next shapes to show their relations. The connections can be straight, curved, or right-angle.
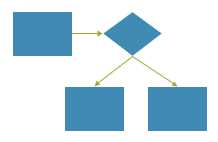
Figure 36: Straight Connections
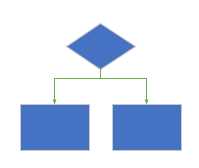
Figure 37: Right-Angle Connections
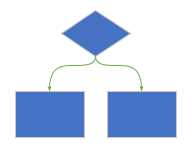
Figure 38: Curved Connections
Tip: Read more about creating connections in the “Beginning” section of Chapter 7.
Arrows
As shown in the previous connections’ figures, arrows guide the viewer through the chart to make it easier and quicker to understand. When connections are added for a basic or cross-functional flowchart, they will default to show arrows pointing in the direction the connections were applied.
Split paths
A split path, shown in Figure 39, occurs when there are multiple outputs or actions that occur as a result of one process step. For example, if a shipping department receives tracking information, there are often multiple departments or people and subsequent steps that need the information. This results in the shipping department sending multiple outputs. In other words, the information is sent to multiple places or systems.
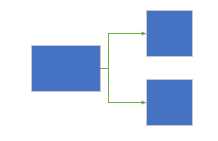
Figure 39: Split Path
Split paths often result in notifications. Or, the path could go to another department that then takes a path outside the scope of the process. In that case, it is acceptable to create a notation saying the process continues elsewhere.
Continuing with the previous tracking information example, a physical product is shipped as a package. The package is picked up by the carrier and scanned. This results in the information being tracked in the carrier’s system, as well as an automated email notification being sent to the package recipient. The notification to the package recipient does not have any further steps within the company, but it’s good to note on the flowchart that the step occurs.
Note: Split paths are created by attaching multiple connectors (see Figure 47: Connect Icons on Work Flow Diagram) to the beginning selection dot and guiding the connectors to ending selection dots on separate objects.
Decision points
At first glance, a decision point, shown in Figure 40, appears to look like a split path because there are multiple connections off the shape. However, rather than both paths occurring, the user chooses and follows only one of the paths.
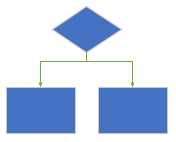
Figure 40: Decision Point
A decision point is any place in the process where a decision has to be made that would cause the process to proceed differently, depending on the outcome of the decision. As mentioned previously, the diamond is the basic shape for a decision point, which easily lends itself to multiple outputs off its edges.
Decision points take a little more diligence because each subsequent path for the various possible decisions needs to be understood and mapped. For this reason, a common mistake is to not recognize decision points and instead assume that the process will always continue forward when, in reality, the process could revert back to a previous step. This mistake of not documenting decision points causes uncertainty around the process because the various possible decisions are not recognized, and therefore, no process to address them is created.
For example, if a vendor submits a partnership agreement, the legal team does not automatically accept it; they review it and decide whether it is accepted or not. In the process map, two paths should be shown: one path if the agreement is accepted, and one if it is rejected. The rejected path would likely go back to the vendor for review and correction, and then re-enter the submission step.
Mapping a decision point is commonly omitted because of the lack of extra thought needed to capture all the scenarios.
Supporting text
Text indications on headers and process steps should be clear and concise. If there are further supporting rules or guidelines that need to be followed, it is best to make an off-page reference, as shown in Figure 41, and then use that to list the rules and guidelines for the process step.
The purpose of an off-page reference is to make the flowchart more concise and easier to understand. For example, let’s say there are three customers who are exempt from the standard process. In this instance, we will say that the flowchart process shows the customer invoices being sent via email, but the three specific customers require their invoices be sent via postal service mail. When invoices are printed and mailed, the process is much different than when the invoices are emailed.
Figure 41 shows how this is mapped. There is a decision point that asks if the customer is X, Y, or Z. These are the customers who require their invoices to be printed and therefore follow a different subprocess. If the answer is “yes,” then the off-page reference document indicates Ref: A. On page 2, the rest of the process steps for Ref: A show that a printed invoice is sent in the mail. When that subprocess is complete, that part of the process ends.
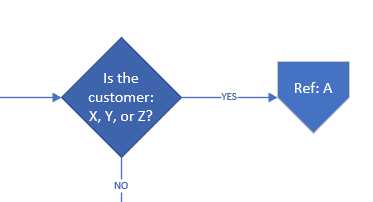
Figure 41: Off-Page Reference Object
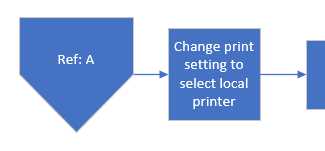
Figure 42: Off-Page Reference on Separate Page
Colors
Unlike shapes, colors in a flowchart do not have specific industry-standard meanings. Some colors are used to:
- Create cohesive branding for the company.[11]
- Show unique values, such as each department having its own color.[12]
- Show a range of values, such as the amount of time each step in the process takes.[13]
Capturing the entire process scope
Just as important as process-mapping on a whiteboard is including the entire process scope in the documented process map. This means to begin the physical process map document at the same point as it was during the whiteboard session. This allows the ultimate consumer of the document to entirely understand where the process begins and how it fits into the company overall.
Output files
Process flow mapping programs are not generally included or installed on a typical user’s computer, usually resulting in a file type that cannot be opened. When sharing a process flow, it should be printed to PDF.
To perform this action, click on the Print icon and then:
- Change the printer selection to Print to PDF.
- Select which pages of the Visio file to print.
- Click Print.
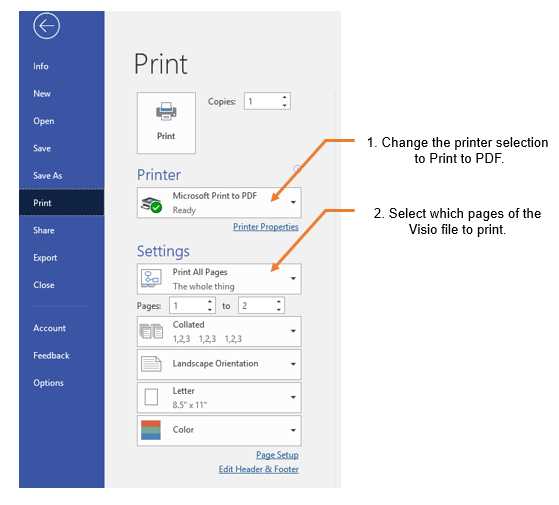
Figure 43: Printing a Visio File as a PDF
- 1800+ high-performance UI components.
- Includes popular controls such as Grid, Chart, Scheduler, and more.
- 24x5 unlimited support by developers.