
Business Process Flow Mapping Succinctly®

CHAPTER 9
Cross-Functional Flowchart
Beginning
The information inputted on the cross-functional flowchart is essentially the same as a basic flowchart, but now it’s divided by which department does the activity.
Begin by creating a new Cross-Functional Flowchart document.
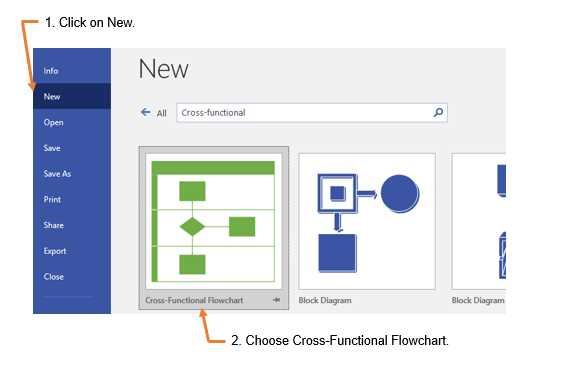
Figure 61: Create New Cross-Functional Flowchart
Next, choose to start with a template or a blank page. In this example, we will begin with a blank page. The following figure shows the prompt to choose either a horizontal or vertical swim lane orientation.
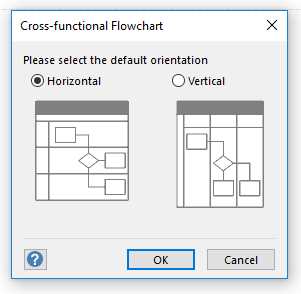
Figure 62: Swim Lane Orientation
Swim lane orientation is a preference. In this example, we use a horizontal orientation.
Swim lanes
When you’re starting to create a cross-functional flowchart, it is best to first write down the different categories that will be used. They could be departments, people, or companies, depending on the scope and level of the flowchart.
Once you determine the categories, you’ll know the number of swim lanes. Next, set up the swim lanes on the flowchart.
The following figure shows that the swim lanes are added by clicking on the desired swim lane from the bar on the left, and then dragging it into position on the page where you want to add it.
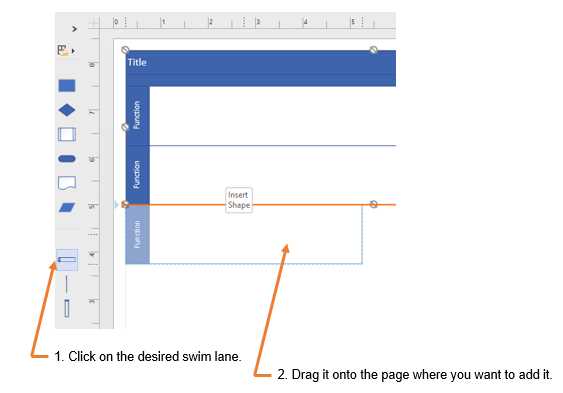
Figure 63: Add Swim Lanes to Cross-Functional Flow Chart
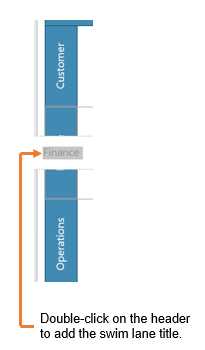
Figure 64: Adding Titles to Swim Lanes
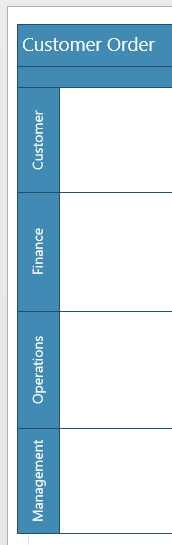
Figure 65: Cross-functional Swim Lanes
Don’t worry if you realize later that either additional swim lanes need to be added, or too many were included in the beginning. It is easy to add and delete them, and most software will adjust the process shapes into the remaining swim lanes in the same manner they were originally created.
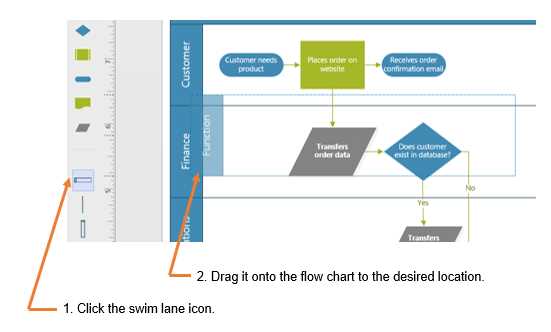
Figure 66: Inserting a Swim Lane by Dragging
Figure 66 shows that a swim lane can be added by dragging the picture of the swim lane from the shapes menu. Figure 67 shows that a swim lane can be added by selecting a swim lane and then right-clicking to insert another lane.
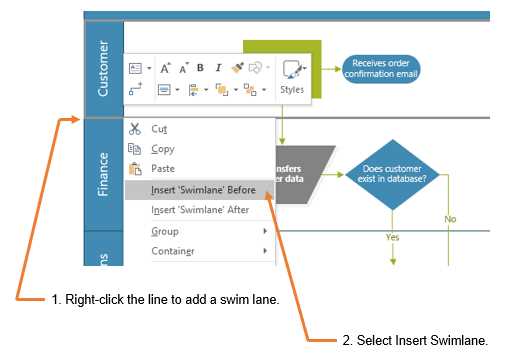
Figure 67: Inserting a Swim Lane by Clicking
Similar to a basic flowchart, the cross-functional flowchart should begin with an ellipse. Process shapes are dragged onto the diagram in the same manner. The only difference is that you drag the shapes into the swim lane that owns the process step.
You can add connections and descriptive text in the same manner as with the basic flowchart. You can also change the shapes in the same way.
The example in Figure 68 clearly shows that the customer places the order on the website, and when the data is transferred, it goes to the finance department.
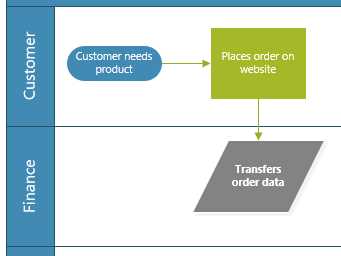
Figure 68: Cross-functional Flowchart
Split paths
When creating a split path in a cross-functional flowchart, be sure to add the process steps into the swim lane that shows which departments receive the outputs of the split path.
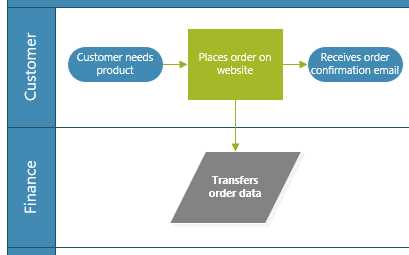
Figure 69: Cross-functional Flowchart with Split Path
For example, Figure 69 shows that when the customer enters the order into the website, order data is transferred to the finance department, and then the customer receives an order confirmation email. The path is split between two swim lanes because two different areas have ownership over those steps.
The customer has no further action to take with the order confirmation email, so the last shape in the swim lane is an ellipse to indicate that there are no further steps connecting off that one.
Note: Remember that the ellipse can be either a start or an end point.
Decision points
A decision point in a cross-functional flowchart follows the same guidelines as a basic flowchart, but it may be confusing since there are multiple swim lanes to consider in a cross-functional flowchart.
It is possible that the steps following the decision could be within the same swim lane or in different swim lanes. In some situations, a decision point could determine if the process remains within the same department or is escalated to a different department.
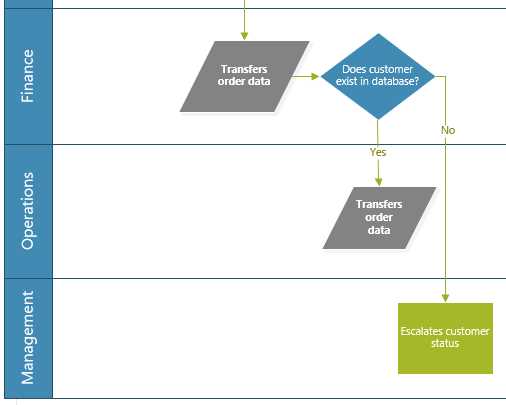
Figure 70: Cross-functional Flowchart with Decision Point
Figure 70 shows that if the customer exists in the database, then the finance department transfers the order data to the operations department. If the customer does not exist in the database, then the finance department escalates the order to management.
Two decisions going to different swim lanes is a common occurrence.
Inter-departmental business process handoffs
When process steps frequently transfer among departments, there is a larger opportunity for errors or missing information, especially if different departments run different systems to support their work.
Here are some common ways to ensure data isn’t inputted improperly when transferred between departments and systems:
- Integrate specific system fields to reduce manual entry. In other words, if there is an opportunity to transfer the output data of one department directly into a system field that serves as an input for another department, then linking those fields would reduce manual entry.
- Establish a confirmation process to notify the previous team that the information was received.
- Create a queue that is reviewed at regular intervals by an assigned employee.
Note: Each output will continue its own process until it goes to an endpoint. There should not be any place in a basic or cross-functional diagram where a process step is left unresolved or hanging open.
- 1800+ high-performance UI components.
- Includes popular controls such as Grid, Chart, Scheduler, and more.
- 24x5 unlimited support by developers.