
Business Process Flow Mapping Succinctly®

CHAPTER 5
Business Process Chart Types
Between whiteboard meetings, a member of the team should create an official process map document. Because creating the document in a software program takes some effort, it forces the map to look cleaner and less cluttered. Completing this in tandem with the mapping sessions allows the team to see a cleaner summary of the process they’re creating and allows the facilitator to spot any possible gaps.
After each project team mapping session, the software document should be updated to reflect what was covered in the session. The document should be reviewed at the beginning of the next session to ensure that everyone is aligned with the updates. Any possible gaps or misunderstandings can be addressed at this point.
There are standard types of programs to accomplish this, but here we will use Microsoft Visio. The examples shown are generally accepted as standard no matter the program used.
Although there are dozens of different formats and templates for flowcharts, diagrams, and business charts, there are three general types of diagrams that can be used to easily depict business process steps.[9] These are:
- Workflow diagrams
- Basic flowcharts
- Cross-functional flowcharts
The following sections go into more depth regarding each chart type.
Workflow diagrams
The workflow diagram has pictorial icons that represent the process. These pictures indicate departments, objects, and steps. The workflow diagram is best used for a general audience that is not entirely familiar with the business operations. It is an attractive way to allow the audience to visualize the general process steps easily.
For a process improvement project, the workflow diagram is best utilized as an initial overview for a managerial or executive audience. This allows the project team to illustrate the general part of the process they are focusing on.
The following figure shows the most commonly used templates in Microsoft Visio for completing a workflow diagram.
Tip: To find workflow templates in Visio, select File > New > Welcome to Visio, and then browse the template types.

Figure 4: Screenshot of Common Workflow Diagram Templates in Visio
As shown in Figure 4, the workflow diagram shows pictures that illustrate each process step in a chart that is easy to understand and visualize without having to completely understand the specifics of each step. It is also possible to create a workflow diagram freeform without a template, which is indicated by the top-left pane.
Workflow diagram shapes
Since the workflow diagram is high-level, there are three general types of shapes to use. These are:
- Departments
- Objects
- Steps
The most general type of workflow diagram shouldn’t be too detailed. Even one that shows just the flow of information among departments can convey the message.
Remember that the diagram depends entirely on the intended audience and method of delivery. An in-person presentation to executives using the workflow diagram as a supporting illustration would likely be created differently than a workflow diagram that is sent over email to department managers. If a workflow is being presented in a room to executives, not only would it be difficult to show a step-by-step document, but the executives would not know or necessarily care about all the details. They would be more concerned with the general direction of the process and any changes that process would cause for the organization. Conversely, a department manager would be very interested in the details, and likely would not be able to do much with a high-level directional chart.
Workflow diagram icons should have descriptive text under them to help the audience understand exactly what is happening in the process.
Departments
While there are dozens of different workflow department icons, the following figures are screenshots of the Visio icons that are most commonly used.
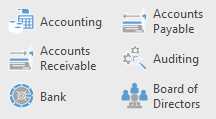
Figure 5: Accounting Workflow Departments
Figure 5 shows accounting-related departments. “Accounting” can be used generically, or “Accounts Receivable” and “Accounts Payable” can be used to illustrate specific activities within accounting.
![]()
Figure 6: Bank Workflow Department
The Bank icon is used to show when an accounting department interacts with a bank, such as depositing funds from customers.
![]()
Figure 7: Finance Workflow Department
“Finance” is a broader department than accounting. It indicates an overall view of the financial activities of the organization rather than the daily activities of accounting.
![]()
Figure 8: Customer Service Workflow Department
The Customer Service icon can be used to indicate either a call center or the account management system where the customer is being serviced.
![]()
Figure 9: Engineering Workflow Department
The Engineering icon indicates the engineering department.
![]()
Figure 10: Headquarters Workflow Department
If a company has various offices, the Headquarters workflow icon helps distinguish when the process needs to include the company’s headquarters, particularly when the workflow involves a step that needs to be reviewed.
![]()
Figure 11: Legal Workflow Department
The Legal Department icon shows when a step needs to include the legal department to review or create a document or contract.
![]()
Figure 12: Management Workflow Department
The Management icon distinguishes whether the process is happening between executives, management, or staff.
![]()
Figure 13: Operations Workflow Department
Operations is a generic department icon that can indicate anything within the operations sector. This generic icon can be used, or specific department icons can be used in its place.
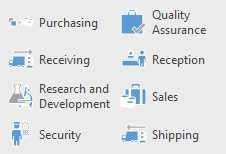
Figure 14: Purchasing and Receiving Workflow Departments
The Purchasing and Receiving icons are examples of specific operations departments. The Purchasing icon is used to indicate when the operations department places an order, whether to replenish physical stock or to drop-ship an item.
Receiving is therefore used when the company has a warehouse or area to keep inventory in stock and a specific department is responsible for receiving the materials and ensuring the correct materials are received.
![]()
Figure 15: Sales Workflow Department
The Sales icon is used when the sales department is involved.
Objects
Workflow diagram objects are people, places, or things involved in the business process.
Figure 16: Data Workflow Object
The Data workflow object indicates the point when information, or data, is passed from one department, person, or system to another.
![]()
Figure 17: Customer and User Workflow Objects
While the Customer icon is self-explanatory and shows when a customer is involved in the process, the User icon can indicate any user of the system or data.
![]()
Figure 18: Product Workflow Objects
The Product icon indicates the product that is being sold.
![]()
Figure 19: Contract Workflow Object
The Contract icon specifically indicates a contract between either a customer, vendor, or partner and the company.
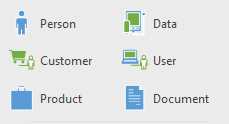
Figure 20: Document Workflow Object
While the Contract icon is specific, the Document icon is generic, and can be used whenever documents pass between departments or people.
![]()
Figure 21: Employee Workflow Object
The Employee icon refers to a person who is employed at the company. It could be used to indicate when an employee needs to complete a specific task. If it is being used in reference to a department, then the assumption is that the employee is a member of that department.
![]()
Figure 22: Manager Workflow Object
Similar to the Employee icon, the Manager icon shows any time a manager is involved. This could be either as part of the work, oversight, or approval, and it could be used in tandem with other workflow objects.
If the Manager icon is used in reference to a department, then the assumption is that the manager is the manager of that department.
![]()
Figure 23: Vendor Workflow Object
The Vendor object shows when the process goes to a vendor. This could be for purchasing or shipping. It serves as a good reference object when the process transfers to a third party that is outside the company.
![]()
Figure 24: Web Page Workflow Object
The Web Page object can be used to show when a customer enters the process flow from the company’s website. It can also be used to show when a webpage is used to collect information, documents, or data from a customer or from within the company itself, such as when a staff member accesses the company’s intranet.
Steps
Workflow diagram steps provide granular detail. They can be used in conjunction with departments and objects to show specific actions or steps that occur within the process.
![]()
Figure 25: Task Workflow Step
The Task workflow step would be used if a department or person has a specific task they need to complete in order to move to the next step in the process. The specific task should be noted.
![]()
Figure 26: Issue Workflow Step
The Issue icon indicates a path that is followed when a department or person has a problem in their process. The issue step can then be routed back to show the corrective steps that would occur after the issue happens.
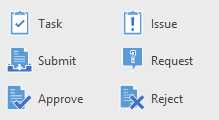
Figure 27: Submission Workflow Steps
The submission workflow steps show when a department or person submits, or requests to submit, something in order to proceed to the next step.
Consequently, the Approve and Reject steps show whether the approving party (most likely the quality department or a manager) either approves or rejects the item. An approval would allow the workflow to continue, while a rejection would show the steps that have to occur in order to submit for approval again.
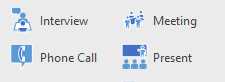
Figure 28: Interaction Workflow Steps
The preceding interaction steps in Figure 28 represent a different, but similar, path to using the approve and reject steps. For example, when onboarding a vendor, perhaps an Interview or Meeting step would be required. The Phone Call icon could indicate when a call needs to be placed to gain approval or to place an order. Present could indicate when an employee or department needs to present to their management, executives, or board of directors.
Basic and cross-functional flowcharts
While the workflow diagram is more illustrative and shows process steps with images, a basic flowchart must contain a title or summary of each process step inside each shape so that the audience understands what each shape indicates in the process.
Basic flowchart
As shown in Figure 29, the style of each template is different; however, the various shapes for the templates are the same. In process mapping, the shapes have standard implications, which will be outlined in the next section. It is also possible to create a flowchart freeform without a template, which is indicated by the top-left pane.
Tip: To find flowchart templates in Visio, select File > New > Welcome to Visio, and then browse the template types.
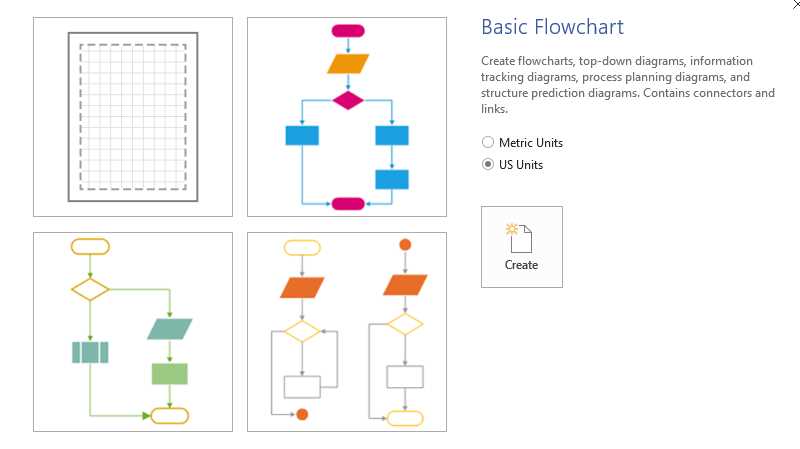
Figure 29: Common Basic Flowchart Templates
A basic flowchart can be created vertically or horizontally and is a good choice to show a simple process. That could be either a high-level process or overview, or a process that remains with one person or department for completion.[10]
Cross-functional flowchart
The cross-functional flowchart uses the same foundational idea as a basic flowchart, but also uses columns or rows, known as swim lanes, within the flowchart. The swim lanes are used to show the separation of different individuals or departments to illustrate the movement of steps between functions. The swim lanes can be vertical or horizontal. Examples of both horizontal and vertical swim lanes are shown in Figure 30.
A title or summary of the process step is typed inside the shape, and the department or individual name is typed in each header of the swim lane.
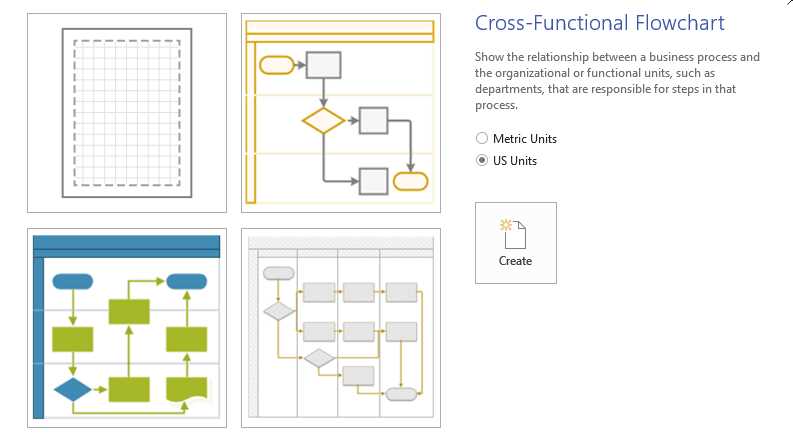
Figure 30: Examples of Cross-Functional Flowchart Templates
Just like a basic flowchart, the screenshot in Figure 30 shows that there are different styles of cross-functional flowcharts, but the basic shapes within them are standard and carry the same implications. Again, it is also possible to create a cross-functional flowchart freeform without a template, which is indicated by the top-left pane.
Shapes
There are shapes in process flow mapping that have industry-standard connotations and are typically used in basic and cross-functional diagrams. Unlike workflow diagram shapes, which are self-explanatory, depending on the illustration, flowchart diagrams require background knowledge to completely understand the implications of the shapes.
There are dozens of different shapes with different meanings, but luckily, there are only a few standard shapes that you need to know to understand the basics. The screenshots in the following figures provide the basic background knowledge necessary to interpret a flowchart diagram.
Ellipse
The ellipse signifies the starting and ending points of a process.
![]()
Figure 31: Ellipse
Square/rectangle
Squares signify a process step. Depending on the size of the text inside, it is acceptable to resize a square into a rectangle.

Figure 32: Rectangle
Square/rectangle with wavy base
A square or rectangle with a wavy base signifies a process step with a document.

Figure 33: Rectangle with Wavy Base
Diamond
The diamond signifies a decision point or a step in the process that can result in multiple paths based on a decision that needs to happen.

Figure 34: Diamond
Parallelogram
A parallelogram signifies a process step that has data transfer within a system. An example of this would be an automated step, such as when data automatically transfers from one system to another.

Figure 35: Parallelogram
- 1800+ high-performance UI components.
- Includes popular controls such as Grid, Chart, Scheduler, and more.
- 24x5 unlimited support by developers.