
Business Process Flow Mapping Succinctly®

CHAPTER 8
Basic Flowchart
Beginning
In Microsoft Visio, create a new document by choosing Basic Flowchart.
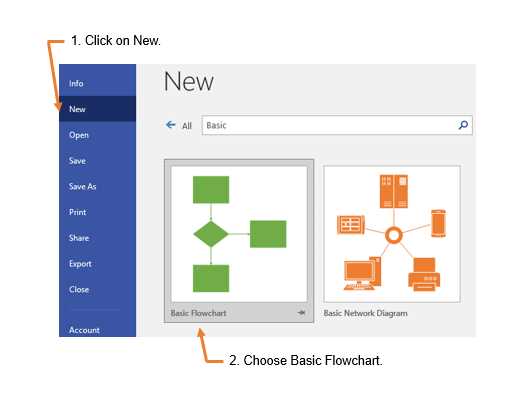
Figure 52: Create New Basic Flowchart
Next, choose to start with a template or a blank page. In this example, we will begin with a blank page.
The basic flowchart is often a high-level or simple process overview of one department. Regardless, the basic flowchart starts with the beginning of the scope of the process and uses an ellipse as the shape to signify that it is the starting point.
Choose the ellipse from the shapes on the left and drag it onto the page. Then repeat the same process with either a rectangle for the next process step, or a diamond if the next process step is a decision point.

Figure 53: Drag a Shape onto the Basic Flowchart
As you work, add descriptive text to the shapes. This is done by double-clicking the shape so a text box will appear.

Figure 54: Adding Description Text to Workflow Shape

Figure 55: Insert Connector in Basic Flowchart
Next, hover the pointer over the shape to connect. Selection dots will appear on the sides. Choose the dot on the side you want to connect, and then drag it to the next shape. The two will then connect.

Figure 56: Connect Shapes in Basic Flowchart
Repeat the same steps to connect the remaining shapes.

Figure 57: Basic Flowchart
Using the same example as the workflow diagram, the same process is shown. However, in a basic flowchart format, the appearance is much different.
Note: Remember that the parallelogram indicates the automatic transfer of data.
Split paths
Continuing with the same example, the following figure illustrates the appearance of a basic flowchart with a split path. The split path is created with the same connections as previously shown. The connections are simply dragged to the desired shapes.

Figure 58: Basic Flowchart with Split Path
Note: Remember that the rectangle indicates a process step with a split path. If there were a diamond instead, that would indicate a decision point.
Decision points
Figure 59 shows that after data is transferred to the finance department, there is a decision point: either the customer exists in the database or not. The diamond shape is used to indicate a decision and the paths are labeled so that the audience understands what actions the finance department will take.

Figure 59: Basic Workflow with Decision Point
Just like the workflow diagram, the decision point paths need to follow through to completion. This often means that the path loops through additional steps and then enters back into a previous step in the process to be reviewed again.
If an incorrect shape was used when creating the flowchart, it is simple to fix. The following figure shows that you click on the shape, and then right-click for a menu to appear. Next, select the drop-down shapes menu, and the menu of additional shapes will appear. Select the desired shape, and the chart will be updated.

Figure 60: Changing Shape in a Basic Flowchart
- 1800+ high-performance UI components.
- Includes popular controls such as Grid, Chart, Scheduler, and more.
- 24x5 unlimited support by developers.