
BI Solutions Using SSAS Tabular Model Succinctly®

CHAPTER 1
Introduction to the Microsoft BI Stack
Before developing any business intelligence (BI) solution, it is important to understand the intention or the use case for the solution, what the end user or the analyst wants to derive using the solution, whether the solution will be used for dynamic ad hoc analytics or enterprise reporting, whether the end user prefers the report to be delivered to them (push), or whether they like to browse the report on demand (pull) and change the measures or dimensions based on their requirements (ad hoc).
The choice of analytics and reporting tool in our BI solution is dependent on this set of questions and other criteria. To ensure that we choose the best available tool that suits the requirements of the end users, it is important that we as BI developers understand all the tools available to us with their strengths and weaknesses. Sometimes a single tool may not fulfill all the requirements, in which case, we need to use a combination of tools.
In this chapter, I would like to introduce you to the Microsoft BI stack so that when we develop a BI solution for end users, we choose the right tool to best fit the user’s requirements.
The rest of the book dives deep into developing SQL Server 2012 Analysis Services tabular data models for analytics and using Power View for data exploration and reporting, which are the new analytics and reporting tools introduced in the SQL Server 2012 Microsoft BI (MSBI) stack.
What is business intelligence?
Business intelligence is the process of converting data into information so that business decision makers or analysts can make informed decisions better and faster.
Although the term business intelligence is used more in the modern days of big data and analytics, the concept is not new to the world. The same concept was previously known as executive information systems (EIS) and later known as decision support systems (DSS).
The source of data can be anything ranging from flat files to a normalized online transaction processing (OLTP) database system, while the end products are reports that allow end users to derive meaningful information by slicing and dicing the facts.

- Business intelligence solution
Figure 1 depicts how a typical business intelligence solution looks sand what actions it performs. Let us briefly examine each component.
Extract-transform-load (ETL)
The raw data for the BI solution may be available from varied data sources, and it may not be available in a relational format. For example, some location data might be available from Excel worksheets, and some measures from applications may be in CSV or XML format which cannot be consumed as is.
The job of the ETL layer is to extract the data from varied data sources and transform it into normalized structured data that can be further loaded in a dimension model (the data warehouse).
If the source of the data is a structured OLTP system, the transformation required is minimal and is basically an extract and load operation.
With the introduction of new tools such as PowerPivot, Power Query, and SSAS tabular model, the raw data from data sources can be directly loaded in the cube without the need of ETL or even data warehouse layers.
Data warehouse (DW)
The data warehouse layer of the BI solution is typically an RDBMS database (things have changed with the introduction of big data and NoSQL), which is designed using dimension modeling techniques (the Ralph Kimball approach or Bill Inmon approach).
In the DW layer, data is classified as dimensions or facts based on its characteristics. A dimension gives the context to slice the data, while facts are measures of interest.
The dimension modeling techniques and detailed discussion on dimensions and facts are outside the scope of this book.
In the traditional data warehousing methods with multidimensional cubes, it was important to have a well-designed data warehouse using dimension modeling techniques. With the introduction of PowerPivot and tabular cubes, data no longer needs to be classified as dimensions and facts, which makes data modeling much easier in tabular cubes compared to traditional cubes.
Nevertheless, it is still recommended to have a data warehouse database designed to store data in a form suitable for reporting, aggregation, and cube processing.
Cube
The information available from BI solutions should allow end users to dynamically slice and dice measures (or facts) across different dimensions and further at different levels of the dimension hierarchy.
The DW stores the dimensions and fact data, which allows us to fetch static reports directly from the DW itself. However, the DW may not be able to handle the flexibility of dynamically slicing and dicing by different dimensions or various levels of the dimension hierarchy.
Thus we have cubes, which virtually store the aggregated data for each measure, level of dimension hierarchy, and dimension.
The cubes are data models which virtually appear to store pre-aggregated measures data across different levels of the dimension hierarchy, thereby giving end users the flexibility to dynamically slice and dice the measures at different levels.
The cube may not be required in a BI solution if the solution requires only static canned reports that are consumed by end users directly without any need for dynamic ad hoc reporting.
Reporting
The final layer of the BI solution is the reporting layer where users derive meaningful information from reported data.
The reports might be in the form of dashboard reports that display highly summarized data for executive users along with key performance indicators (KPIs) and visual indicators, or detailed reports that display each transaction that occurred as required by information workers.
The reports can also be classified as static reports, which are designed and developed by developers from the data warehouse, and are consumed by end users as is. Dynamic ad hoc reports, on the other hand, are exposed to end users via cubes, allowing them to dynamically slice and dice the data.
The reports might have to be delivered to end users via an email (push), or users might browse the report on demand (pull).
The reporting solution should be able to cater to all types of reports needed.
Understanding the Microsoft business intelligence stack
Now that we understand the basics of business intelligence, we next dive into the Microsoft BI stack to understand which products are available at various layers.

- Microsoft BI stack
As shown in the previous figure, the Microsoft BI stack includes the following products:
SQL Server Integration Services (SSIS)
SSIS forms the ETL layer in the MSBI stack. SSIS packages accept data from various data sources like Excel, Oracle, SAP, and flat files, and inject the data into data flow streams where it undergoes various transformations available (union, merge, lookup, data flow, and execute SQL task, for example). The transformed data is loaded in the data warehouse hosted in the SQL Database Engine.
SQL Server DBMS
A SQL Server Database Engine instance forms the platform to host the data warehouse in the MSBI Stack.
SQL Server Analysis Services
SSAS forms the platform for hosting cubes in the MSBI stack. Until SQL Server 2008 R2, there was only one type of SSAS instance: a multidimensional SSAS cube. However, with the introduction of the new SQL Server 2012 xVelocity engine, we have new type of SSAS instance: the tabular data model. The tabular model is the primary focus of this book.
We will compare the traditional multi-dimensional SSAS with the tabular model, and look at how to choose the right SSAS instance later in this chapter.
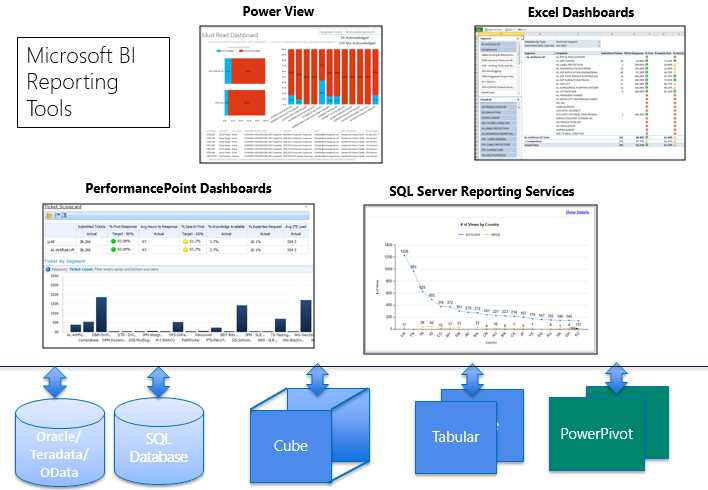
Microsoft BI reporting platform
With the Microsoft BI stack, we have the following tools for reporting:

- Reporting tools in the Microsoft BI stack
SQL Server Reporting Services (SSRS)
SSRS is a great tool for BI developers to build canned static reports for end users. SSRS is the most flexible reporting platform with vast set of visualizations such as gauges, indicators, and maps. SSRS allows reports to be exported to various formats including PDF, Excel, Word, and HTML. Further, the reports can be delivered by a subscription to file share, SharePoint list, or email.
PerformancePoint Services (PPS)
PPS is a great ad hoc dashboard and scorecard reporting tool for BI developers to build dynamic reports on SSAS cubes. PPS reports use SSAS cubes as data sources and allow end users to dynamically slice and dice measures across various dimensions defined in the cube. PPS reports expose the actions, perspectives, and more, defined in the cube.
Excel
Traditionally, Excel has provided the preferred reporting tools for most business users. Excel pivot tables and pivot charts can be used to explore the cube and perform ad hoc reporting.
Power View
Power View is the new Silverlight-based ad hoc reporting tool introduced in SQL Server 2012. The tool exposes the data model from PowerPivot, tabular models, and multidimensional cubes, thereby allowing users to dynamically handle the data. Power View provides a rich set of visualization tools that enhance the interactivity and experience for business users.
SharePoint BI dashboards
SharePoint 2010 and 2013 provide a platform to host all of the previously mentioned reporting tools on a single site, allowing developers to build rich dashboards. SharePoint is useful for team BI and enterprise BI solutions where all reports can be connected to build a single view dashboard for end users.
Later in this chapter we will compare all Microsoft BI reporting tools to choose the right ones based on our solution requirements.
What’s new in the SQL Server 2012 business intelligence stack?
Microsoft made some heavy investments in the BI space with its SQL Server 2012 release, and some of the investments, such as the BI semantic model (BISM) and Power View, have put Microsoft in the leader’s quadrant of BI and analytics platforms evaluated by Gartner.
BI semantic model
With the introduction of SQL Server 2012, Microsoft created the concept of the BI semantic model, or BISM. Many people have used this term interchangeably with the SSAS 2012 tabular model, which is not accurate. Let’s try to understand what this new term means.

- BI semantic model
As mentioned previously, with SQL Server 2012 we can now have two instances of SSAS: a traditional multidimensional model and a tabular model. From a developer perspective, designing and developing a cube in a multidimensional instance is completely different from a tabular model, the latter one being relatively easier. There is no migration path available to migrate a multidimensional cube to a tabular cube and vice versa. Further, the query language designed for multidimensional cubes is Multidimensional Expressions (MDX), while the language for tabular model cubes is Data Analysis Expressions (DAX). The design and development strategies for each model are completely different. However, the cube models can consume the same set of data sources and process the data.
The key feature introduced in these cubes is that a multidimensional cube can support DAX queries (this was introduced very late with SQL Server 2012 SP1 CU4), and a tabular model cube can support MDX queries.
This flexibility allows all reporting tools discussed previously (Excel, SSRS, PPS, Power View) to query either type of cube transparently with similar reporting features. For example, using Excel pivot tables and charts which produce only MDX queries, we can query either cube model (multidimensional or tabular) to build the same report with the same functionality.
From the end user perspective, both models provide the same functionality transparently. Hence, this new concept of the BI semantic model represents a transparent data model layer in SQL Server 2012 for all the reporting tools.
Choosing the right Microsoft analytics tool
With the SQL Server 2012 release, we now have three analytical tools that can be used to design a data model for reporting in PowerPivot for Excel, PowerPivot for SharePoint, and SSAS.
The following figure released by the Microsoft product team best explains the use case for each analytical tool.

- Uses and benefits of Microsoft analytics tools
Based on the target audience, a BI solution can be classified as personal BI, team BI, or corporate BI.
Personal BI
Personal BI is for individual business users or power users who like to create data models, KPIs, and measures for their own consumption and analysis. PowerPivot, which is now natively integrated with Excel 2013 and is available as an add-in with Excel 2010, caters to personal BI users.
Users can fetch data from various data sources (SQL Server, Oracle, flat files, OData feed, etc.) and load it in the PowerPivot data model in Excel. Further, they can define their measures, KPIs, and derived columns using DAX formulas within the PowerPivot data model and use them in the pivot table or pivot chart reports in Excel.
Team BI
Team BI is for groups of individuals who like to create, view, and share data models and reports. Over the years, SharePoint has evolved as the most preferred document library for organizations, and with the introduction of Office 365 (SharePoint Online), even small and medium businesses have adopted SharePoint as a document library. The Microsoft product team has designed and integrated PowerPivot with SharePoint so that PowerPivot workbooks uploaded in the SharePoint library can be viewed online using Excel Services. With SharePoint 2013, the Excel Services application natively loads the PowerPivot workbooks embedded within Excel.
PowerPivot for SharePoint serves well for team BI users due to its ability to provide scheduled data refreshes automatically, which is difficult to achieve with personal BI.
Corporate BI
Corporate BI is also referred to as enterprise BI or organizational BI. It’s made for large groups of users with large volumes of data and varied requirements of data, security, KPIs, and measures. Data models defined in SQL Server Analysis Services specifically addresses the needs of corporate BI.
SSAS provides features such as calculated measures, KPIs, perspectives, role-based security, Kerberos-integrated security, and is capable of handling large volumes of data. A practical case study is Yahoo’s data mart used for analytics and reporting. It is around 24 TB in size and is hosted on SSAS multidimensional cubes.
With the introduction of SSAS tabular model in SQL Server 2012, BI developers can choose between the traditional multidimensional approach and the new tabular model approach. In the next section we will compare these approaches to help you choose the right model for your BI solution.
Multidimensional approach versus tabular approach
Multidimensional approach

- Process for multidimensional cube approach
Designing a multidimensional cube requires the data mart to be designed with a star or snowflake schema where the data is classified as dimension attributes or facts. The data from the dimension tables forms the attribute and attribute hierarchies in the cube, while the fact table forms the measure groups with individual measure columns forming the facts.
Since the data in the data mart needs to be in a star or snowflake schema, an SSIS package is required to extract data from various data sources, transform it, and load it in the data mart. The multidimensional approach requires an ETL solution to transform the data into a star schema in the data mart.
The multidimensional cube can handle role-playing dimensions, many-to-many dimensions, and parent/child dimensions out of the box, which gives us great flexibility in designing complex data models.
The multidimensional approach requires MDX knowledge for scripting and querying, which might be difficult for novices, but is one of the most flexible querying languages for experienced developers.
The multidimensional approach supports three different storage options: MOLAP, HOLAP, and ROLAP. MOLAP is the preferred option, as it provides the best performance at the expense of data redundancy.
From the resource (CPU, memory, or IO) and scalability perspective, the multidimensional cube consumes less memory than the tabular model and can scale well with partitioning and partition processing.
Tabular approach

- Process for tabular approach
The tabular approach uses relational modeling constructs such as tables and relationships for modeling data, and the xVelocity in-memory analytics engine for storing and calculating data. Unlike the multidimensional approach, the tabular approach doesn’t require data to be organized in a star or snowflake schema, as it relies on compressed columnar storage of data. This makes data modeling pretty much easier with the tabular approach.
The tabular model may not be able to handle complex relationships (role playing dimensions, many-to-many-dimensions, parent/child dimensions) out of the box, which can make it less useful for complex data models.
The tabular model uses DAX for querying and defining calculations, which is relatively easier to learn and master compared to MDX.
The tabular model supports the in-memory xVelocity mode and DirectQuery mode (equivalent to ROLAP in the multidimensional approach). However, DirectQuery mode only supports data marts hosted on SQL Server. It currently does not support any other data sources.
From the resource consumption perspective, the in-memory mode for the tabular model is memory intensive with the amount of memory required proportional to the cardinality of the data, so it may not scale well in memory-limited environments. In some cases, the tabular model can perform better than the multidimensional model, depending on the data.
Decision matrix
The following figure outlines a decision matrix for developers choosing between the multidimensional approach and the tabular approach.

- Selecting a multidimensional or tabular model
Choosing the right Microsoft BI reporting tool
- Reporting tools in the Microsoft BI stack
PerformancePoint Services scorecards and dashboards
- Interactivity: Scorecards and dashboards allow drill down and drill through capabilities, allowing users to perform ad-hoc reporting and analytics.
- Visualization: Compared to other tools, limited visualization and charts are available.
- Self-service BI: Users may not be able to develop dashboards by themselves.
- Export to Excel or other formats: Export to Excel is possible but other formats are not possible.
- Email subscriptions: Users may not be able to receive the report via email subscriptions out of the box.
Overall, PPS is a great tool for dashboards and analytics, but it doesn’t support self-service BI.
SQL Server Reporting Services
- Interactivity: SSRS dashboards allow drill down and drill through, but don’t support dynamic slicing and dicing. SSRS is primarily useful for static reports with limited interactivity and ad hoc capabilities.
- Visualization: Provides a rich set of visualizations including maps, gauges, sparklines, etc.
- Self-service BI: Users may not be able to develop dashboards by themselves.
- Export to Excel and other formats: Exporting to Excel and other formats such as PDF, Word, and HTML is possible.
- Email subscriptions: Users can create email subscriptions to have the reports delivered to their mailbox.
Overall, SSRS is a good reporting tool for static reports but may not be useful for ad hoc analytics and self-service BI.
Power View
- Interactivity: Power View dashboards allow dynamic slicing, which makes it a highly interactive tool for analytics and dashboarding. It is the preferred tool for ad hoc reporting.
- Visualization: Includes a rich set of visualizations, such as maps, scatter plot graphs, cards, tiles, etc.
- Self-service BI: Users should be able to develop dashboards by themselves.
- Export to Excel and other formats: Export to PowerPoint is possible but other formats are not supported.
- Email subscriptions: Users may not be able to create email subscriptions to have reports delivered to their inbox.
Overall, Power View is a good tool for self-service BI and ad hoc analytics wherein users can dynamically slice and dice information, but it doesn’t support exporting data to a format other than PowerPoint.
Excel dashboards
- Interactivity: Excel dashboards in SharePoint via Excel Services provide limited interactivity with no drill-through action support. However, Excel workbooks downloaded from SharePoint support drill through.
- Visualization: Provides a limited set of visualizations, including tables and charts.
- Self-service BI: Users should be able to develop dashboards by themselves.
- Export to Excel and other formats: Export to Excel is possible.
- Email subscriptions: Users may not be able to create email subscriptions to have reports delivered to their inbox out of the box.
Overall, Excel dashboards are a good tool for self-service BI and analytics for Excel users, but have limited interactivity compared to other tools.
Decision matrix
The following figure outlines the decision matrix for developers choosing reporting tools for their BI solutions.

- Selecting the right reporting tool
Developing an MSBI solution
The following diagram outlines the steps involved in developing an MSBI solution:

- Procedure for developing an MSBI solution
Like in any software development lifecycle (SDLC), the first step of development is the requirement-gathering phase. Here we sort out from our customers or end users which measures they would like to analyze against which dimensions or attributes, and whether they require the capability for ad hoc reporting or need static reports created by the developer.
Once we have the requirements in place, the next step is to choose the Microsoft reporting tools that best suit the end user’s needs based on the desired interactivity, visualization, self-service BI, export to Excel or other formats, and email delivery. For varied user requirements, we might want to choose a combination of reporting tools.
The next step is to choose the right Microsoft analytical tools (PowerPivot, PowerPivot on SharePoint, SSAS multidimensional or SSAS tabular). Depending upon the personal BI, team BI, or corporate BI requirements, we can choose the best analytical tool which suits the end user’s needs. For a corporate BI solution, we can choose between SSAS multidimensional or tabular models based on the complexity of the data model, scalability, skill-set knowledge, client tools, and more.
The data warehouse is required for team BI or corporate BI scenarios. If the data warehouse is required (which is preferred), the next step is to design the data warehouse schema using the dimension modeling techniques given by Ralph Kimball. The data warehouse might contain multiple data marts with each data mart defined for a given business process. The data mart consists of a star schema with a central fact table surrounded by dimension tables with primary foreign key relationships. The fact table consists of key columns and measures to be analyzed, while the dimension table consists of the set of related attributes across which the measures need to be analyzed.
Once the data warehouse schema is ready, next we need to identify the data sources for the data warehouse, as the data warehouse will be populated from various data sources in the organization. Some of the data might reside in OLTP, and some might be available in flat files, while others might be available in the cloud.
Once the data sources for the warehouse are identified, the next step is to design an ETL solution to extract the data from varied data sources, transform them if required, and load them in the data warehouse. During this step, we might have to design an interim staging database where we first extract, load, and transform the data before loading it to the data warehouse.
After the ETL starts flowing, the data warehouse is populated with the data in a format suitable for reporting. For some reporting tools like SSRS, we can directly design reports to fetch the data from the data warehouse; however, if the user is looking for self-service BI and ad hoc reporting, a cube data model design is required. We can design the data model based on the analytical tool chosen earlier.
The final step in the development of a BI solution is designing reports as per the needs of the end user through the reporting tools identified previously, which will allow users to derive meaningful information and make informed decisions.
Summary
In this chapter, we covered the basics of business intelligence, the various tools available in the Microsoft BI stack, and how to choose the right tools for your BI solution.
In the next chapter, we start with data modeling using the SSAS tabular model introduced in SQL Server 2012, which will be the focus of the rest of the book.
- 1800+ high-performance UI components.
- Includes popular controls such as Grid, Chart, Scheduler, and more.
- 24x5 unlimited support by developers.