
Bing Maps V8 Succinctly®

CHAPTER 2
Fundamental Techniques
This chapter presents some of the most commonly used features of the Bing Maps V8 library. In section 2.1 you’ll learn how to work with pushpins. In particular, you’ll learn how to create pushpins on the fly programmatically by using two different techniques: the HTML5 canvas and scalable vector graphics (SVG).
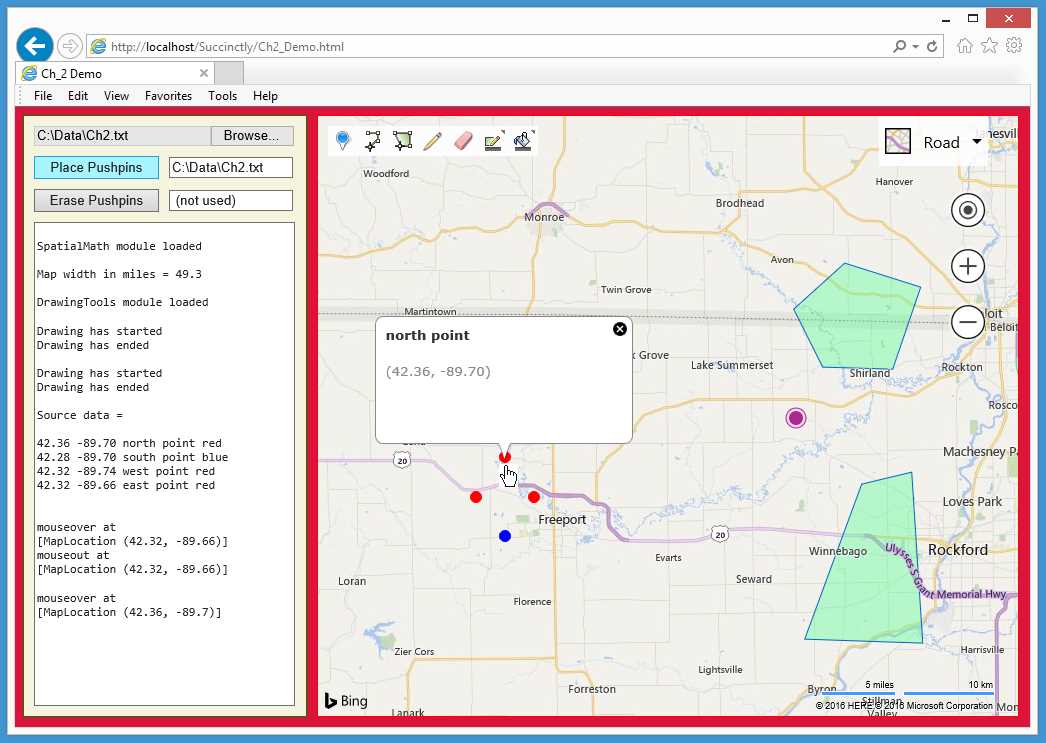
Figure 10: Fundamental Techniques Demo
Pushpins are often accompanied by Infobox objects, and section 2.1 explains how to create and manipulate them in conjunction with events such as mouseover and mouseout.
In section 2.2, you’ll learn how to use the Maps.DrawingTools module to add a drawing control to a map, which allows users to interactively add pushpins, polylines, and polygons to a map. You’ll also learn how to access these objects programmatically.
In section 2.3, you’ll learn how to work with geomath functions in the Maps.SpatialMath module and how to use them to calculate geoproperties such as the location of the map center and the width and height of the current map view.
2.1 Pushpins and Infoboxes
Two of the most common ways to add information to a Bing Maps V8 map are to create pushpin objects and Infobox objects. They’re often used together. Bing Maps gives you two ways to create static, custom pushpin icons and two ways to create dynamic, custom icons. The basic Infobox object is quite flexible and can display text and graphics information.
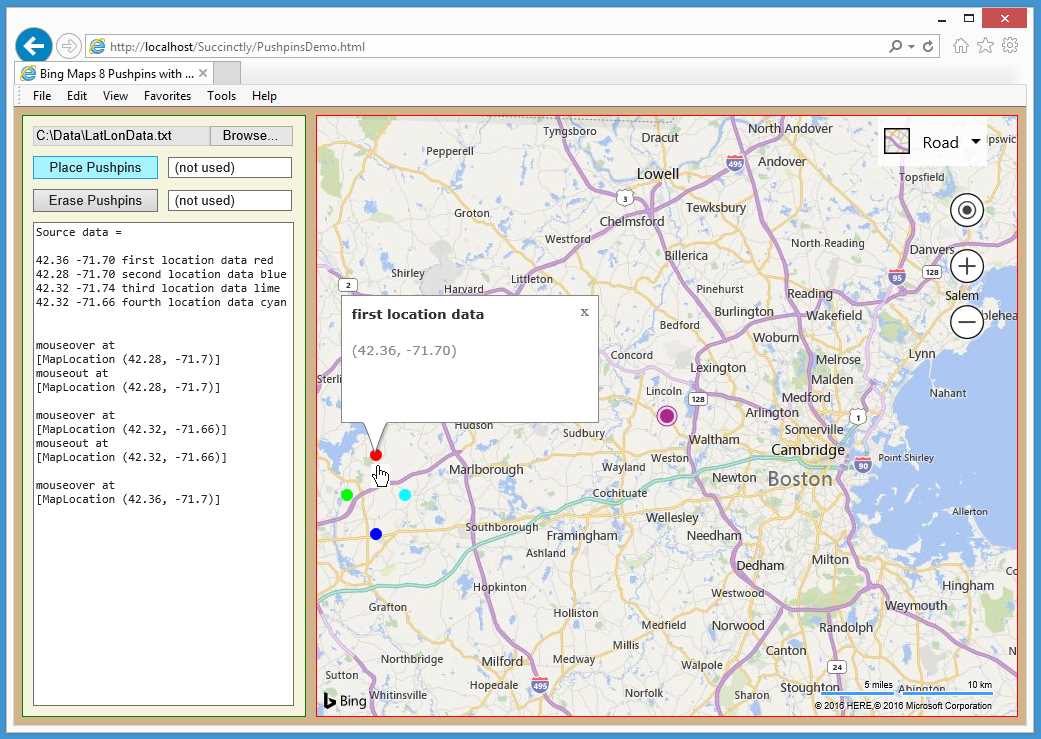
Figure 11: Pushpins and Infoboxes Demo
The demo web application depicted in Figure 11 shows some examples of pushpin and Infobox objects. The demo initially loads a map centered near Boston and also places a default-style large purple pushpin with a radius of about 10 pixels at the map center. The user clicked the “Browse” button HTML file control in the upper-left corner and pointed the Choose File dialog to a file named LatLonData.txt in a local C:\Data directory.
When the button labeled “Place Pushpins” was clicked, the webpage read and echoed the text file and used the data to dynamically create four different-colored pushpins. Then the user moved the mouse cursor over and away from some of the pushpins. Note that as each pushpin is passed, information about the pushpin appears in a default-style Infobox object, and when the cursor leaves the pushpin, the Infobox object automatically disappears.
The demo web application is named PushpinsDemo.html and is defined in a single file.
Code Listing 3: PushpinsDemo.html
<!DOCTYPE html> <!-- PushpinsDemo.html --> <html> <head> <title>Bing Maps 8 Pushpins with Infoboxes</title> <meta http-equiv="Content-Type" content="text/html; charset=utf-8"/> <script type='text/javascript'> var map = null; var pushpins = []; var infobox = null; var ppLayer = null; function GetMap() { var options = { credentials: "Anw _ _ _ 3xt", center: new Microsoft.Maps.Location(42.40, -71.30), mapTypeId: Microsoft.Maps.MapTypeId.road, zoom: 10, enableClickableLogo: false, showTermsLink: false }; var mapDiv = document.getElementById("mapDiv"); map = new Microsoft.Maps.Map(mapDiv, options); var ibOptions = { visible: false, offset: new Microsoft.Maps.Point(0, 0) }; var ibLoc = new Microsoft.Maps.Location(0, 0); infobox = new Microsoft.Maps.Infobox(ibLoc, ibOptions); infobox.setMap(map); ppLayer = new Microsoft.Maps.Layer(); var cpp = new Microsoft.Maps.Pushpin(map.getCenter(), null); ppLayer.add(cpp); map.layers.insert(ppLayer); } function WriteLn(txt) { var existing = msgArea.value; msgArea.value = existing + txt + "\n"; } function LatLonStr(loc) { var s = "(" + Number(loc.latitude).toFixed(2) + ", " + Number(loc.longitude).toFixed(2) + ")"; return s; } function Button1_Click() { var f = file1.files[0]; var reader = new FileReader(); reader.onload = function(e) { WriteLn("Source data = \n"); var lines = reader.result.split('\n'); for (var i = 0; i < lines.length; ++i) { var line = lines[i]; var tokens = line.split(','); WriteLn(tokens[0] + " " + tokens[1] + " " + var loc = new Microsoft.Maps.Location(tokens[0], tokens[1]); var ppOptions = { icon: CreateCvsDot(6, tokens[3]), anchor: new Microsoft.Maps.Point(6, 6), subTitle: tokens[2] }; var pp = new Microsoft.Maps.Pushpin(loc, ppOptions); pushpins[i] = pp; Microsoft.Maps.Events.addHandler(pp, 'mouseover', ShowInfobox); Microsoft.Maps.Events.addHandler(pp, 'mouseout', HideInfobox); } ppLayer.add(pushpins); map.layers.insert(ppLayer); WriteLn(""); } reader.readAsText(f); } { var c = document.createElement('canvas'); c.width = 2 * radius; c.height = 2 * radius; var ctx = c.getContext("2d"); ctx.beginPath(); ctx.arc(radius,radius, radius, 0, 2 * Math.PI); ctx.fillStyle = clr; ctx.fill(); return c.toDataURL(); } function Button2_Click() { ppLayer.clear(); } function ShowInfobox(e) { var loc = e.target.getLocation(); WriteLn('\nmouseover at \n' + loc); infobox.setLocation(loc); infobox.setOptions( { visible: true, title: e.target.getSubTitle(), description: LatLonStr(loc) }); } function HideInfobox(e) { WriteLn('mouseout at \n' + e.target.getLocation()); infobox.setOptions({ visible: false }); } </script> </head> <body style="background-color:tan"> <div id='controlPanel' style="float:left; width:262px; height:580px; border:1px solid green; padding:10px; background-color: beige">
<input type="file" id="file1" size="24"></input> <span style="display:block; height:10px"></span> <input id="button1" type='button' style="width:125px;" value='Place Pushpins' onclick="Button1_Click();"></input> <div style="width:2px; display:inline-block"></div> <input id="textbox1" type='text' size='15' value=' (not used)'> </input><br/> <span style="display:block; height:10px"></span> <input id="button2" type='button' style="width:125px;" value='Erase Pushpins' onclick="Button2_Click();"></input> <div style="width:2px; display:inline-block"></div> <input id="textbox2" type='text' size='15' value=' (not used)'> </input><br/> <span style="display:block; height:10px"></span> <textarea id='msgArea' rows="34" cols="36" style="font-family:Consolas; font-size:12px"></textarea> </div> <div style="float:left; width:10px; height:600px"></div> <div id='mapDiv' style="float:left; width:700px; height:600px; border:1px solid red;"></div> <br style="clear: left;" />
<script type='text/javascript' </body> </html> |
The demo application declares four script-global objects:
var map = null;
var pushpins = [];
var infobox = null;
var ppLayer = null;
Object pushpins is an array that will hold all pushpins. Object Infobox is a single Infobox object that will be shared by all the pushpins. Alternatively, we can define an array of Infobox objects, but, as you’ll see, for this scenario all we need is a single Infobox.
A function GetMap() creates the map object. The map options object does not use the undocumented showCopyright property for the map properties but instead sets the showTermsLink to false so that a small hyperlink to legal information will not be displayed in the lower-right corner of the map:
function GetMap()
{
var options = {
credentials: "Anw (etc) 3xt",
center: new Microsoft.Maps.Location(42.40, -71.30), // Boston
mapTypeId: Microsoft.Maps.MapTypeId.road,
zoom: 10,
enableClickableLogo: false,
showTermsLink: false // is true by default
};
var mapDiv = document.getElementById("mapDiv");
map = new Microsoft.Maps.Map(mapDiv, options);
. . .
Function GetMap() initializes the single Infobox object this way:
var ibOptions = { visible: false,
offset: new Microsoft.Maps.Point(0, 0) };
var ibLoc = new Microsoft.Maps.Location(0, 0);
infobox = new Microsoft.Maps.Infobox(ibLoc, ibOptions);
infobox.setMap(map);
Unlike pushpins, an Infobox object lives “over a map” rather than “on a map,” so to speak. Here an ibOptions object is set so that the Infobox is not initially visible, and it will be located at latitude-longitude (0, 0), which is the intersection of the equator and the prime meridian (off the west coast of Africa). The setMap() function is used to place the (currently invisible) Infobox object over the map. Notice the calling syntax is infobox.SetMap(map) rather than map.setInfobox(infobox), which might seem a bit more natural.
Function GetMap() finishes initialization by preparing a visualization layer for the pushpins that will be dynamically created when the data file is read, and it creates and places a single pushpin at map center:
. . .
ppLayer = new Microsoft.Maps.Layer();
var cpp = new Microsoft.Maps.Pushpin(map.getCenter(), null);
ppLayer.add(cpp);
map.layers.insert(ppLayer);
} // end GetMap()
Pushpins, polygons, and other visual objects can now be placed in separate visual layers—an important new feature of Bing Maps V8. In this case, a layer object named ppLayer is created for the center pushpin and the four pushpins that will represent the data in the text file.
There are four steps to placing a pushpin on a map: 1) create a layer 2) create a pushpin 3) add the pushpin to the layer and 4) insert the layer into the map. The demo places all five pushpins in a single layer. An alternative is to create two layers, one for the center pushpin and one for the data-file pushpins.
The null value passed to the Pushpin constructor can be loosely interpreted to mean “make a default, round purple pushpin with radius 10 pixels.”
In Bing Maps V7 and earlier versions, all visual objects were placed into a single global Entities array object. That code would look like this:
var cpp = new Microsoft.Maps.Pushpin(map.getCenter(), null);
map.entities.push(cpp);
Bing Maps V8 supports the entities approach for backward compatibility. However, except for the simplest map scenarios, I believe that using the new layer approach is preferable.
Function Button1_Click() reads a text file of location information, parses each line, and creates a custom-colored pushpin. The function code is:
function Button1_Click()
{
var f = file1.files[0];
var reader = new FileReader();
reader.onload = function(e) {
WriteLn("Source data = \n");
var lines = reader.result.split('\n');
for (var i = 0; i < lines.length; ++i) {
// create a pushpin, add to global pushpins[] array
}
ppLayer.add(pushpins);
map.layers.insert(ppLayer);
WriteLn("");
}
reader.readAsText(f);
}
Object file1 is the HTML File control. Because it can point to multiple files, the first file is selected as files[0]. The FileReader object reads asynchronously. Notice that you first must define an anonymous function associated with the onload event in order to provide instructions for later, after the file has been read into memory, then you issue a single instruction to read the file using the readAsText() function.
When the text file has been read into object reader.result, it is broken into an array of lines using the built-in JavaScript split() function. Each line is processed this way:
for (var i = 0; i < lines.length; ++i) {
var line = lines[i];
var tokens = line.split(',');
WriteLn(tokens[0] + " " + tokens[1] + " " +
tokens[2] + " " + tokens[3]);
var loc = new Microsoft.Maps.Location(tokens[0], tokens[1]);
var ppOptions = { icon: CreateCvsDot(6, "orangered"),
anchor: new Microsoft.Maps.Point(6, 6),
subTitle: tokens[2] };
var pp = new Microsoft.Maps.Pushpin(loc, ppOptions);
pushpins[i] = pp;
Microsoft.Maps.Events.addHandler(pp, 'mouseover', ShowInfobox);
Microsoft.Maps.Events.addHandler(pp, 'mouseout', HideInfobox);
}
The contents of the source LatLonData.txt file are:
42.36,-71.70,first location data,red
42.28,-71.70,second location data,blue
42.32,-71.74,third location data,lime
42.32,-71.66,fourth location data,cyan
Each comma-delimited line is broken into its four parts. The first two parts are used to create a Location object for the pushpin. The key to creating a custom pushpin is to set its option properties. The icon property defines what the pushpin looks like, and the demo calls a program-defined function CreateCvsDot() to create a circle with radius 6 pixels and the specified color. I will explain this function shortly. The anchor property controls where the pushpin will be placed, in pixels, relative to its location property where an anchor of (0, 0) is the top-left corner of the icon.
A pushpin can have a title, a subTitle, and a text property. Here the subTitle is set to the third field in the text file, but it will not be displayed because no title has been set.
After the pushpin’s options and location have been set, it is created as an object pp using the Pushpin() constructor and added to the global pushpins array. I could have written pushpins.push(pp) instead, but that’s a lot of p’s in one line of code. Each pushpin has its mouseover and mouseout event handlers modified so as to display or hide an Infobox object.
Function ShowInfoBox() is defined:
function ShowInfobox(e)
{
var loc = e.target.getLocation();
WriteLn('\nmouseover at \n' + loc);
infobox.setLocation(loc);
infobox.setOptions( { visible: true,
title: e.target.getSubTitle(),
description: LatLonStr(loc)
});
}
Recall that the GetMap() function created the single Infobox object, but it is not visible. When a user moves the mouse cursor over a pushpin, the location of the pushpin is fetched on the fly using the getLocation() function. Because the Infobox object already exists, setting its visible property to true is all we must do to make the object appear.
The description property of the Infobox object is set to the location of the associated pushpin. The demo uses a short helper function LatLonStr() to format the location to two decimals:
function LatLonStr(loc)
{
var s = "(" + Number(loc.latitude).toFixed(2) + ", " +
Number(loc.longitude).toFixed(2) + ")";
return s;
}
A slightly more flexible approach would be to pass the number of decimals as a parameter to the function. Function HideInfoBox() is very simple and merely sets the visible property back to false:
function HideInfobox(e)
{
WriteLn('mouseout at \n' + e.target.getLocation());
infobox.setOptions({ visible: false });
}
To recap, the demo creates a single Infobox object that is not initially visible. When a mouseover event on a pushpin fires, the pushpin’s location is fetched, information stored in the pushpin is retrieved, and the Infobox object is made visible. When the mouseout event on a pushpin fires, the Infobox is made not visible.
One of my favorite features of the Bing Maps library is its ability to programmatically create pushpin icons. You can create icons using an HTML canvas or by using an SVG. The demo uses the HTML canvas technique. The creation function is defined this way:
function CreateCvsDot(radius, clr)
{
var c = document.createElement('canvas');
c.width = 2 * radius;
c.height = 2 * radius;
var ctx = c.getContext("2d");
ctx.beginPath();
ctx.arc(radius,radius, radius, 0, 2 * Math.PI);
ctx.fillStyle = clr;
ctx.fill();
return c.toDataURL();
}
You aren’t limited to creating circles for a custom pushpin icon, and an HTML canvas can be used to create just about any kind of image you can imagine, although relatively simple geometric shapes such as circles, ovals, triangles, and rectangles are most common. After a canvas object is created, the rather weirdly named toDataURL() function is used to create a PNG format image from the canvas.
I love the ability to dynamically create different-styled pushpins (and other objects, as you’ll see). Without this ability, an application would have to create dozens or maybe even hundreds of static PNG images in order to account for different situations, then use code logic to determine which image to use.
Function Button2_Click() erases all pushpins with the single statement:
function Button2_Click()
{
ppLayer.clear();
}
Here, both the default-style center pushpin and the data pushpins are erased. However, if two layers had been used, the demo could have targeted an individual collection of pushpins along the lines of:
centerPpLayer.clear();
dataPpLayer.clear();
In summary, a default pushpin icon is purple with a radius of about 10 pixels. There are four ways to create a custom image icon for a pushpin: by dynamically using an HTML canvas (as shown in the demo) or an SVG string, and by statically using an ordinary image file or a Base64-encoded object. Infobox objects are most often used to display text information, but they are very flexible.
Resources
For detailed information about pushpin options, see:
https://msdn.microsoft.com/en-us/library/mt712673.aspx.
For detailed information about Infobox object options, see:
https://msdn.microsoft.com/en-us/library/mt712658.aspx.
A good resource for information about HTML canvas images is at:
http://www.w3schools.com/tags/ref_canvas.asp.
2.2 Interactive drawing
The Bing Maps V8 library has a DrawingTools module that allows you to place a drawing control on a map. The drawing control lets users interactively add pushpins, lines, and polygons. These shapes aren’t just art; they are objects that can be programmatically accessed and manipulated.
The demo web application in Figure 12 initially loads a map centered near Kansas City with a zoom level set to 10.
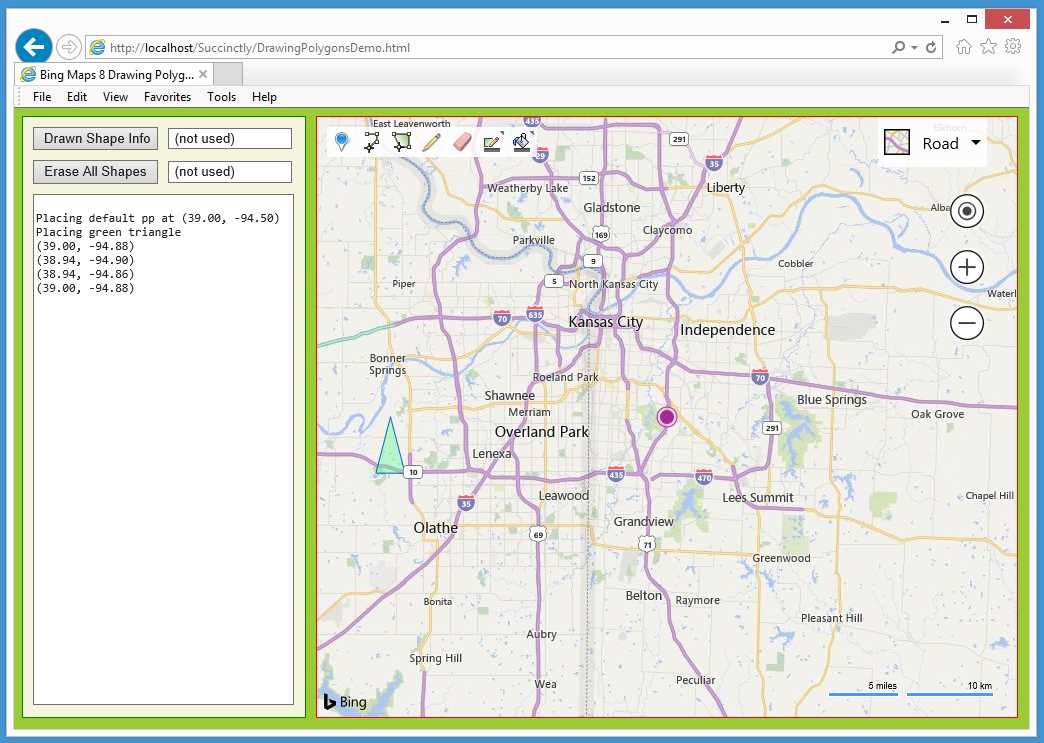
Figure 12: Initial Map View for Drawing Polygons Demo
During map initialization, the application places a default-style purple pushpin at the center of the map to act as a point of reference. The application also places a green, three-sided polygon to the left of center using hard-coded locations.
The drawing control is visible in the upper-left corner. There are seven icons. Users can add a pushpin, add a polyline, add a polygon, edit a drawn shape, erase a drawn shape, color a drawn shape, or set the color to use with a new shape.
In this example, after the map loaded, the user added a default-style (green) pushpin to the right of the city of Independence and drew a default-style, five-sided polygon to the left of center.
Next, the user clicked the right-most icon on the drawing control in order to select the color (purple) and transparency for a new shape.
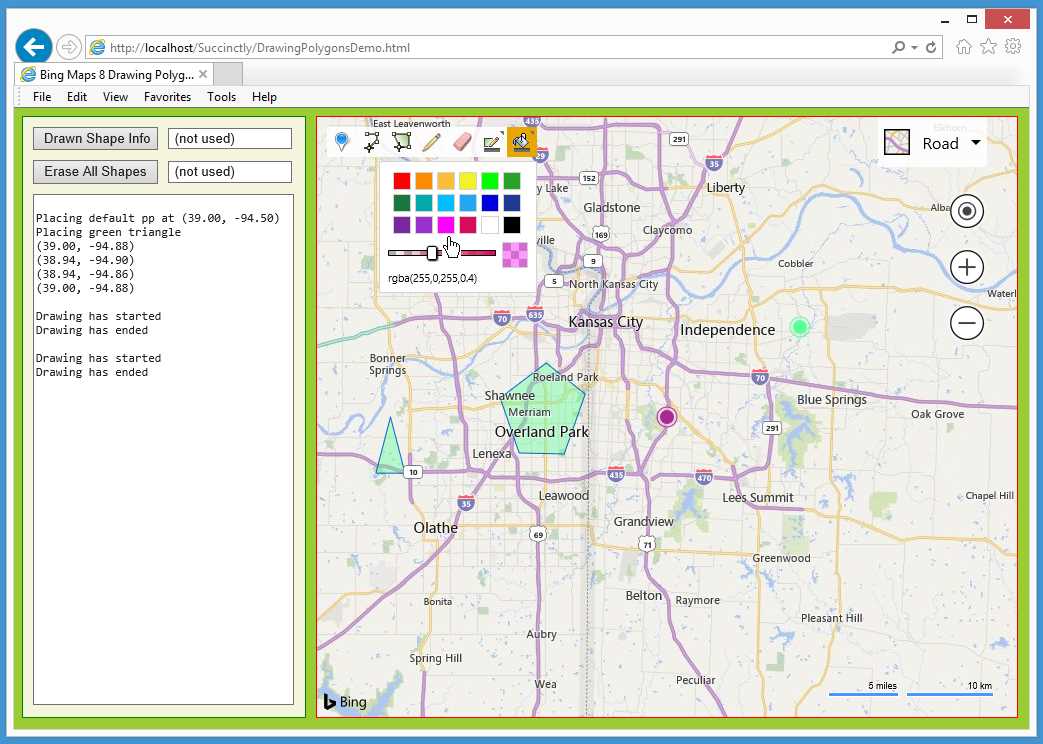
Figure 13: Using the Drawing Control Color Selector
Next, the user clicked the third icon to draw a polygon, then added a three-sided polygon with top-most vertex at the map center. A click on the top button control programmatically fetched information about the most recently drawn shape and displayed that information.
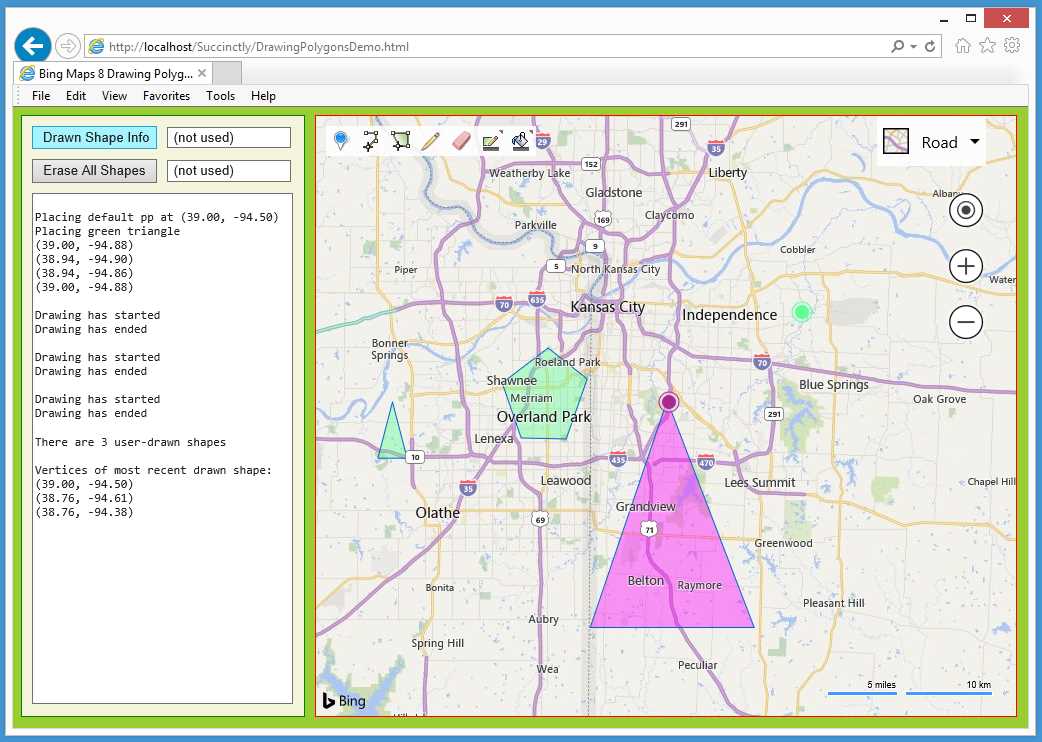
Figure 14: Retrieving Information about Interactively Created Shapes
The demo application is named DrawingPolygonsDemo.html and is defined in a single file.
Code Listing 4: DrawingPolygonsDemo.html
<!DOCTYPE html> <!-- DrawingPolygonsDemo.html --> <html> <head> <title>Bing Maps 8 Drawing Polygons</title> <meta http-equiv="Content-Type" content="text/html; charset=utf-8"/> <script type='text/javascript'> var map = null; var ppLayer = null; var drawMgr = null; var drawnShapes = []; function GetMap() { var options = { credentials: "Anw _ _ _ 3xt", center: new Microsoft.Maps.Location(39.00, -94.50), mapTypeId: Microsoft.Maps.MapTypeId.road, zoom: 10, enableClickableLogo: false, showCopyright: false }; var mapDiv = document.getElementById("mapDiv"); map = new Microsoft.Maps.Map(mapDiv, options); ppLayer = new Microsoft.Maps.Layer(); WriteLn("\nPlacing default pp at " + LatLonStr(map.getCenter())); var cpp = new Microsoft.Maps.Pushpin(map.getCenter(), null); ppLayer.add(cpp);
WriteLn("Placing green triangle"); var v0 = new Microsoft.Maps.Location(39.00, -94.88); var v1 = new Microsoft.Maps.Location(38.94, -94.90); var v2 = new Microsoft.Maps.Location(38.94, -94.86); var arr = []; arr.push(v0); arr.push(v1); arr.push(v2); var triangle = new Microsoft.Maps.Polygon(arr, null); ppLayer.add(triangle); map.layers.insert(ppLayer); var triangleLocs = triangle.getLocations(); for (var i = 0; i < triangleLocs.length; ++i) { WriteLn(LatLonStr(triangleLocs[i])); } Microsoft.Maps.loadModule('Microsoft.Maps.DrawingTools', function() { var tools = new Microsoft.Maps.DrawingTools(map); tools.showDrawingManager(AddDrawControlEvents); }); } function AddDrawControlEvents(manager) { Microsoft.Maps.Events.addHandler(manager, 'drawingStarted', function() { WriteLn('\nDrawing has started'); }); Microsoft.Maps.Events.addHandler(manager, 'drawingEnded', function(e) { WriteLn('Drawing has ended'); }); drawMgr = manager; // Save for get-shapes-info function. } function WriteLn(txt) { var existing = msgArea.value; msgArea.value = existing + txt + "\n"; } function LatLonStr(loc) { var s = "(" + Number(loc.latitude).toFixed(2) + ", " + Number(loc.longitude).toFixed(2) + ")"; return s; } function Button1_Click() { drawnShapes = drawMgr.getPrimitives(); var numShapes = drawnShapes.length; var mostRecent = drawnShapes[numShapes-1];
WriteLn("\nThere are " + numShapes + " user-drawn shapes"); var isPoly = (mostRecent instanceof Microsoft.Maps.Polygon); var isPushpin = (mostRecent instanceof Microsoft.Maps.Pushpin); if (isPoly == true) { WriteLn("\nVertices of most recent drawn shape: "); var vertices = mostRecent.getLocations(); for (var i = 0; i < vertices.length; ++i) { WriteLn(LatLonStr(vertices[i])); } WriteLn(""); } else if (isPushpin == true) { WriteLn("\nLocation of most recent pushpin: "); var loc = mostRecent.getLocation(); WriteLn("loc = " + loc); } } function Button2_Click() { drawMgr.clear(); // drawn shapes ppLayer.clear(); // other shapes } </script> </head> <body style="background-color:#9ACD32"> <div id='controlPanel' style="float:left; width:262px; height:580px; border:1px solid green; padding:10px; background-color: beige">
<input id="button1" type='button' style="width:125px;" value='Drawn Shape Info' onclick="Button1_Click();"></input> <div style="width:2px; display:inline-block"></div> <input id="textbox1" type='text' size='15' value=' (not used)'> </input><br/> <span style="display:block; height:10px"></span> <input id="button2" type='button' style="width:125px;" value='Erase All Shapes' onclick="Button2_Click();"></input> <div style="width:2px; display:inline-block"></div> <input id="textbox2" type='text' size='15' value=' (not used)'></input><br/> <span style="display:block; height:10px"></span> <textarea id='msgArea' rows="36" cols="36" style="font-family:Consolas; font-size:12px"></textarea> </div> <div style="float:left; width:10px; height:600px"></div> <div id='mapDiv' style="float:left; width:700px; height:600px; border:1px solid red;"></div> <br style="clear: left;" /> <script type='text/javascript' </body> </html> |
The demo begins by setting up four script-global objects:
var map = null;
var ppLayer = null;
var drawMgr = null;
var drawnShapes = [];
The ppLayer object will hold pushpins (in this case just the one pushpin at map center) that are programmatically added. Note that you do not create a Layer object for shapes that are interactively added using the drawing control. The drawMgr object will be created when the drawing control is added to the map, and it will be used to access drawn shapes. The drawnShapes array is declared global but is used by only one function, which means drawnShapes could have been declared local to that function.
The map object is created in the usual way:
function GetMap()
{
var options = {
credentials: "Anw _ _ _ 3xt",
center: new Microsoft.Maps.Location(39.00, -94.50),
mapTypeId: Microsoft.Maps.MapTypeId.road,
zoom: 10,
enableClickableLogo: false,
showCopyright: false
};
var mapDiv = document.getElementById("mapDiv");
map = new Microsoft.Maps.Map(mapDiv, options);
. . .
Note that no special initialization is needed if you’re going to use the drawing control. Next, the center pushpin is created but not yet placed on the map:
ppLayer = new Microsoft.Maps.Layer();
WriteLn("\nPlacing default pp at " + LatLonStr(map.getCenter()));
var cpp = new Microsoft.Maps.Pushpin(map.getCenter(), null);
ppLayer.add(cpp);
The demo application creates a hard-coded, three-sided default-style polygon and adds it to the ppLayer layer:
WriteLn("Placing green triangle");
var v0 = new Microsoft.Maps.Location(39.00, -94.88);
var v1 = new Microsoft.Maps.Location(38.94, -94.90);
var v2 = new Microsoft.Maps.Location(38.94, -94.86);
var arr = [];
arr.push(v0); arr.push(v1); arr.push(v2);
var triangle = new Microsoft.Maps.Polygon(arr, null);
ppLayer.add(triangle);
map.layers.insert(ppLayer);
In a nondemo scenario, you'd likely want to create a separate Layer object for the polygon rather than using the pushpin layer.
The demo programmatically fetches information about the just-added polygon to point out an important idea:
var triangleLocs = triangle.getLocations();
for (var i = 0; i < triangleLocs.length; ++i) {
WriteLn(LatLonStr(triangleLocs[i]));
}
If you look at the figures at the beginning of this section, you’ll notice that the triangle polygon is created with three Location objects, but the getLocations() function returns four locations. The first location is repeated. Some shapes are closed by duplicating the first location, and some shapes are not closed. This can cause you a lot of trouble if you’re not careful.
Map initialization concludes by adding the drawing control:
. . .
Microsoft.Maps.loadModule('Microsoft.Maps.DrawingTools',
function() {
var tools = new Microsoft.Maps.DrawingTools(map);
tools.showDrawingManager(AddDrawControlEvents);
});
}
The anonymous callback function adds the control to the map and calls a program-defined function named AddDrawControlEvents(). This function is defined as:
function AddDrawControlEvents(manager)
{
Microsoft.Maps.Events.addHandler(manager, 'drawingStarted',
function() { WriteLn('\nDrawing has started'); });
Microsoft.Maps.Events.addHandler(manager, 'drawingEnded',
function(e) { WriteLn('Drawing has ended'); });
drawMgr = manager;
}
The function adds code for writing a message when a drawing has started or ended. Notice that the anonymous function associated with the drawingEnded event has an e argument that is not used. The e argument represents the just-drawn shape, so if you want to perform some action on a user-drawn shape immediately after it has been created, you can access the shape through the e object. The global drawMgr object is saved—this is how user-drawn shapes can be accessed later through another function.
The button control labeled “Drawn Shape Info” is associated with function Button1_Click():
function Button1_Click()
{
drawnShapes = drawMgr.getPrimitives();
var numShapes = drawnShapes.length;
var mostRecent = drawnShapes[numShapes-1];
. . .
An array of shapes that have been interactively created using the drawing control can be retrieved using the getPrimitives() function. In general, the retrieved shapes are read-only. For example, the statement mostRecent.setOptions( {fillColor:'red'}) will have no effect. In order to indirectly manipulate a drawn shape, you can fetch information about the shape, programmatically create a duplicate, then delete the original drawn shape.
The function gets and displays information about the nyh recent shape this way:
. . .
WriteLn("\nThere are " + numShapes + " user-drawn shapes");
var isPoly = (mostRecent instanceof Microsoft.Maps.Polygon);
var isPushpin = (mostRecent instanceof Microsoft.Maps.Pushpin);
if (isPoly == true) {
WriteLn("\nVertices of most recent drawn shape: ");
var vertices = mostRecent.getLocations();
for (var i = 0; i < vertices.length; ++i) {
WriteLn(LatLonStr(vertices[i]));
}
WriteLn("");
}
else if (isPushpin == true) {
WriteLn("\nLocation of most recent pushpin: ");
var loc = mostRecent.getLocation();
WriteLn("loc = " + loc);
}
}
In order to determine the type of a drawn shape, you must use the built-in instanceof operator rather than the built-in typeof() function because typeof() will only return “object.”
In summary, you can use the DrawingManager class of the Maps.DrawingTools module to provide users with a way to interactively add pushpins, polylines, and polygons. (There are plans to enhance the functionality of the drawing control to include other shapes).
Resources
For detailed information about the Maps.DrawingTools module, see:
https://msdn.microsoft.com/en-us/library/mt750543.aspx.
For detailed information about the DrawingManagerClass, see:
https://msdn.microsoft.com/en-us/library/mt750462.aspx.
For detailed information about using the Polygon class, see:
https://msdn.microsoft.com/en-us/library/mt712647.aspx.
2.3 Map bounds
Because users can change a map’s view (including zoom level and position), geo-applications sometimes need to know map-location properties such as the current zoom level, current map center location, width of the map in degrees, width in miles, and so on.
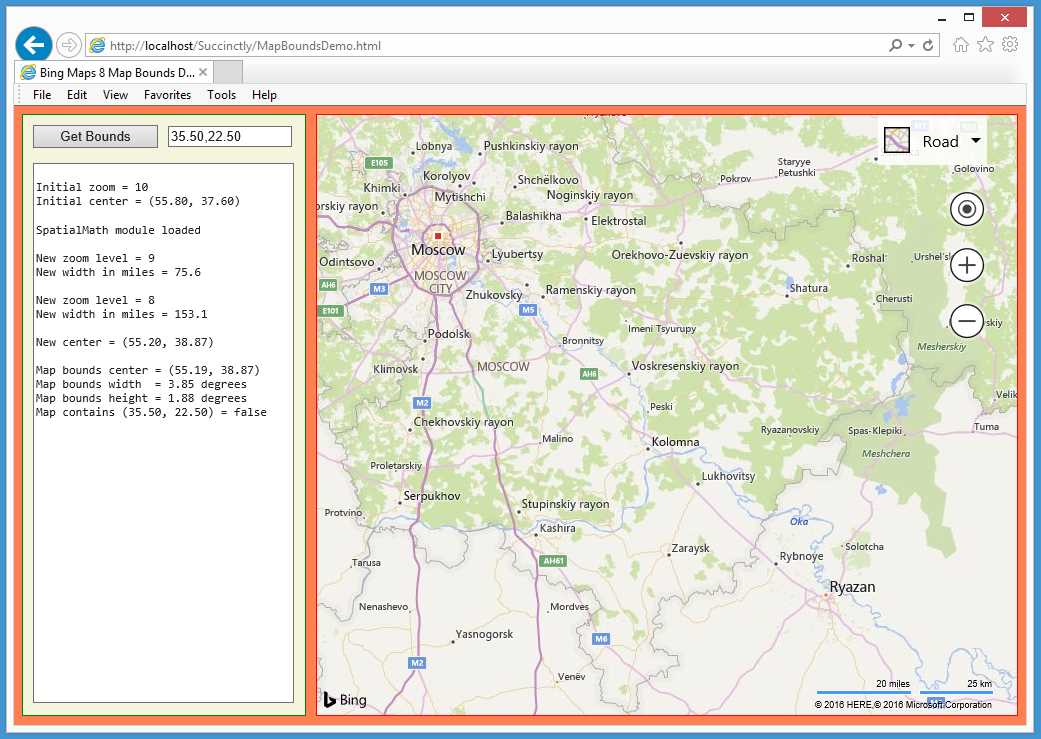
Figure 15: Getting Map Properties Information
The demo web application shown in Figure 15 loads a map with initial zoom level of 10 centered at (55.80, 37.60) near Moscow (Russia, not Idaho!). During map initialization, the application loaded the Maps.SpatialMath module that contains many useful geomath functions.
The user clicked the built-in zoom control labeled with a minus sign to zoom out to level 9. The application is coded to detect changes in the map’s view, and it programmatically calculated the new width of the map view (75.6 miles). Then the user zoomed out again, to level 8. The new width of the map is 153.1 miles.
The user then dragged the map so that Moscow was repositioned to the upper-left corner of the map. The application detected a new map center at (55.15, 38.96) and displayed it. The user clicked “Get Bounds” and the application code displayed the current bounds information, then calculated that the current view doesn’t contain location (35.50, 22.50).
The demo web application is named MapBoundsDemo.html and is defined in a single file.
Code Listing 5: MapBoundsDemo.html
<!DOCTYPE html> <!-- MapBoundsDemo.html --> <html> <head> <title>Bing Maps 8 Map Bounds Demo</title> <meta http-equiv="Content-Type" content="text/html; charset=utf-8"/> <script type='text/javascript' src='http://www.bing.com/api/maps/mapcontrol'> </script> <script type="text/javascript"> var map = null; var zoomLev; var mapCtr = null;
function GetMap() { var options = { credentials: "Anw _ _ _ 3xt", center: new Microsoft.Maps.Location(55.80, 37.60), mapTypeId: Microsoft.Maps.MapTypeId.road, zoom: 10, enableClickableLogo: false, showTermsLink: false }; var mapDiv = document.getElementById("mapDiv"); map = new Microsoft.Maps.Map(mapDiv, options); zoomLev = map.getZoom(); mapCtr = map.getCenter(); WriteLn("\nInitial zoom = " + zoomLev); WriteLn("Initial center = " + LatLonStr(mapCtr)); Microsoft.Maps.Events.addHandler(map, 'viewchangeend', ViewChanged); Microsoft.Maps.loadModule("Microsoft.Maps.SpatialMath", function () { WriteLn("\nSpatialMath module loaded"); }); } function ViewChanged() { var z = map.getZoom(); var mc = map.getCenter(); if (z != zoomLev) { WriteLn("\nNew zoom level = " + z); zoomLev = z; var bounds = map.getBounds(); var se = bounds.getSoutheast(); var s = bounds.getSouth(); var w = bounds.getWest(); var sw = new Microsoft.Maps.Location(s, w); var inMiles = Microsoft.Maps.SpatialMath.DistanceUnits.Miles; var widthOfMap = WriteLn("New width in miles = " + Number(widthOfMap).toFixed(1)); } if (mc.latitude != mapCtr.latitude || mc.longitude != mapCtr.longitude) { WriteLn("\nNew center = " + LatLonStr(mc)); mapCtr = mc; } } function WriteLn(txt) { var existing = msgArea.value; msgArea.value = existing + txt + "\n"; } function LatLonStr(loc) { var s = "(" + Number(loc.latitude).toFixed(2) + ", " + Number(loc.longitude).toFixed(2) + ")"; return s; } function Button1_Click() { var bounds = map.getBounds(); var ctr = bounds.center; var wid = bounds.width; var ht = bounds.height; WriteLn("\nMap bounds center = " + LatLonStr(ctr)); WriteLn("Map bounds width = " + Number(wid).toFixed(2) + " degrees"); WriteLn("Map bounds height = " + Number(ht).toFixed(2) + " degrees"); var strLoc = textbox1.value; var latLon = strLoc.split(','); var lat = latLon[0]; var lon = latLon[1]; var loc = new Microsoft.Maps.Location(lat, lon); var b = bounds.contains(loc);
WriteLn("Map contains " + LatLonStr(loc) + " = " + b); } </script> </head> <body onload="GetMap();" style="background-color:coral"> <div id='controlPanel' style="float:left; width:262px; height:580px; border:1px solid green; padding:10px; background-color: beige"> <input id="button1" type='button' style="width:125px;" value='Get Bounds' onclick="Button1_Click();"></input> <div style="width:2px; display:inline-block"></div> <input id="textbox1" type='text' size='15' value='35.50,22.50'></input><br/> <span style="display:block; height:15px"></span> <textarea id='msgArea' rows="38" cols="36" style="font-family:Consolas; font-size:12px"></textarea> </div> <div style="float:left; width:10px; height:600px"></div> <div id='mapDiv' style="float:left; width:700px; height:600px; border:1px solid red;"></div> <br style="clear: left;" /> </body> </html> |
The demo application loads the Bing Maps library using the old synchronous technique by placing an ordinary referencing script tag in the HTML head section of the page. I don’t recommend this approach, but it’s worth seeing what it looks like.
The application sets up three global script-scope objects:
var map = null;
var zoomLev;
var mapCtr = null;
Typically, global objects in a map application are used by more than one function (such as the map object) or those that record and maintain state—for example, the zoomLev and mapCtr objects here that store the current zoom level and map center location.
Map initialization is performed by program-defined function GetMap(), which is referenced in the HTML body tag:
<body onload="GetMap();" style="background-color:coral">
Function GetMap() sets up more or less standard options:
function GetMap()
{
var options = {
credentials: "Anw _ _ _ 3xt",
center: new Microsoft.Maps.Location(55.80, 37.60),
mapTypeId: Microsoft.Maps.MapTypeId.road,
zoom: 10,
enableClickableLogo: false,
showTermsLink: false
};
. . .
After the map is created and placed on the map, the zoom and center states are saved and displayed:
var mapDiv = document.getElementById("mapDiv");
map = new Microsoft.Maps.Map(mapDiv, options);
zoomLev = map.getZoom();
mapCtr = map.getCenter();
WriteLn("\nInitial zoom = " + zoomLev);
WriteLn("Initial center = " + LatLonStr(mapCtr));
Map initialization concludes by adding an event handler and loading a module:
. . .
Microsoft.Maps.Events.addHandler(map, 'viewchangeend', ViewChanged);
Microsoft.Maps.loadModule("Microsoft.Maps.SpatialMath",
function () {
WriteLn("\nSpatialMath module loaded");
});
}
The map object supports 13 events, including “viewchange,” “viewchangestart,” and “viewchangeend.” A view change includes a change in zoom level, map type (aerial, road, etc.), and map position. Here the instructions to execute on a change are placed in a program-defined function ViewChanged().
The Maps.SpatialMath module is loaded so that the static functions in the module can be ready to be called rather than being loaded the module when needed. The anonymous callback function will display a message after the module is loaded. The callback function is required so that you can’t pass null as an argument, but you can use a return true statement if you wish.
Most of the application code logic is in the ViewChanged() function that begins:
function ViewChanged()
{
var z = map.getZoom();
var mc = map.getCenter();
. . .
When the ViewChanged() function is entered, you don’t know what type of event acted as the trigger, so the function fetches the map zoom level and center location to see if they have changed.
The function first checks to see if there was a change in zoom level:
if (z != zoomLev) {
WriteLn("\nNew zoom level = " + z);
zoomLev = z;
var bounds = map.getBounds();
var se = bounds.getSoutheast();
var s = bounds.getSouth();
var w = bounds.getWest();
var sw = new Microsoft.Maps.Location(s, w);
var inMiles = Microsoft.Maps.SpatialMath.DistanceUnits.Miles;
var widthOfMap =
Microsoft.Maps.SpatialMath.getDistanceTo(se, sw, inMiles);
WriteLn("New width in miles = " + Number(widthOfMap).toFixed(1));
}
You might expect the return value from the getBounds() function to store the four corners of the map, but instead the return is a LocationRec object that has a center Location object with width and height properties that are given in degrees. Luckily, a LocationRect object has 13 useful methods. Some examples are shown in Table 2.
Table 2: Representative LocationRect Methods
Name | Description |
contains() | determines if a Location is in the LocationRect area |
getEast() | returns the right-side longitude (left-right) value |
getNorth() | returns the top latitude (up-down) value |
getNorthwest() | returns the Location of the upper-left corner |
intersects() | determines if one LocationRect overlaps another |
Interestingly, there are getNorthwest() and getSoutheast() functions, but no getNortheast() and getSouthwest() functions. The ViewChanged() function calculates and displays the width of the current view by using the built-in getSoutheast() function and by calculating a Southwest location using the getSouth() and getWest() functions. The getDistanceTo() function accepts two Location objects. The return value can be computed in different units using a DistanceUnits enumeration of Feet, Kilometers, Meters, Miles, NauticalMiles, or Yards.
Function ViewChanged() concludes by checking to see if the map view has been moved:
. . .
if (mc.latitude != mapCtr.latitude || mc.longitude != mapCtr.longitude) {
WriteLn("\nNew center = " + LatLonStr(mc));
mapCtr = mc;
}
}
Here, the latitude and longitude properties of the Location object are used; if either has changed, the new map center is not the same as the old map center. Alternatively, we can use a slightly less-flexible technique—the static Location.areEqual() function. Function Button1_Click() uses a different way to get the width of the current map view:
function Button1_Click()
{
var bounds = map.getBounds();
var ctr = bounds.center;
var wid = bounds.width;
var ht = bounds.height;
WriteLn("\nMap bounds center = " + LatLonStr(ctr));
WriteLn("Map bounds width = " + Number(wid).toFixed(2) + " degrees");
WriteLn("Map bounds height = " + Number(ht).toFixed(2) + " degrees");
. . .
Here the width and height properties are used directly to give dimensions measured in degrees. The function concludes by determining if a location is in the current view area:
. . .
var strLoc = textbox1.value;
var latLon = strLoc.split(',');
var lat = latLon[0];
var lon = latLon[1];
var loc = new Microsoft.Maps.Location(lat, lon);
var b = bounds.contains(loc);
WriteLn("Map contains " + LatLonStr(loc) + " = " + b);
}
Note that the test location is constructed by breaking apart the text box input because the Location class doesn’t have a method to parse from a raw string that combines latitude and longitude.
In summary, the Maps.SpatialMath module has dozens of useful geomath functions that eliminate the need for you to write custom code.
Resources
For detailed information about the Maps.SpatialMath module, see:
https://msdn.microsoft.com/en-us/library/mt712834.aspx.
- 1800+ high-performance UI components.
- Includes popular controls such as Grid, Chart, Scheduler, and more.
- 24x5 unlimited support by developers.