
Bing Maps V8 Succinctly®

CHAPTER 4
Advanced Techniques
This chapter presents some relatively advanced Bing Maps V8 techniques for geo-applications. In section 4.1, you’ll learn how to create automatic pushpin clustering for use when you have a large number of data points. You’ll also learn how to use functions such as getLocations() and getPolygons() in the Maps.TestDataGenerator module in order to generate random data during development.
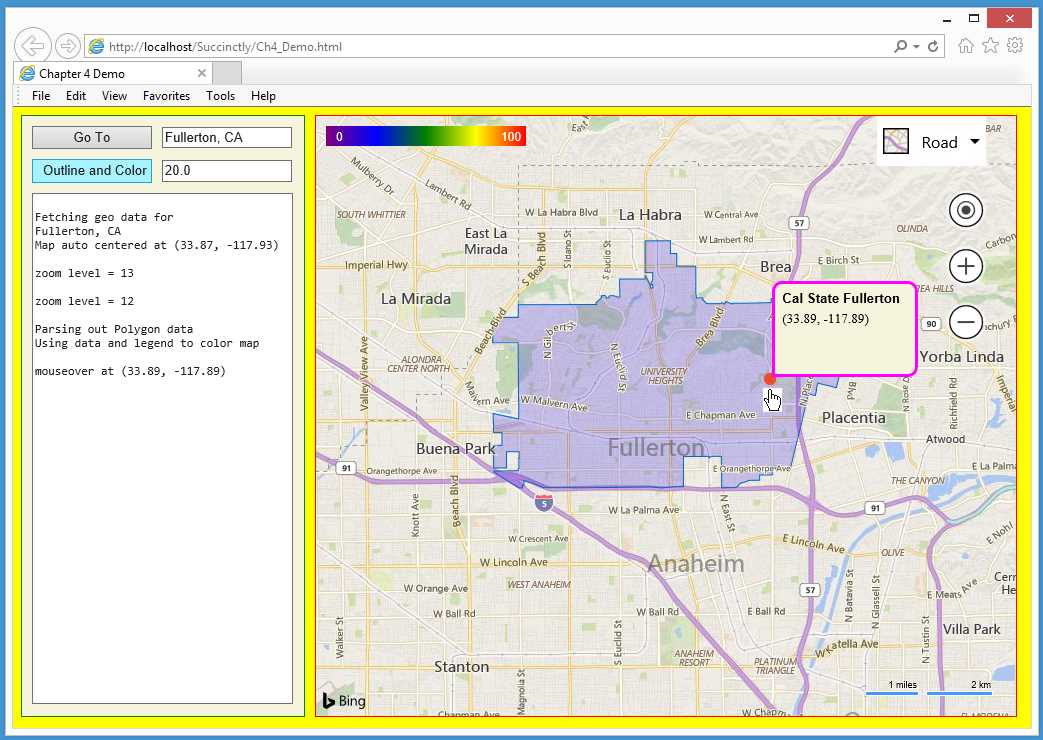
Figure 20: Advanced Techniques Demo
In section 4.2, you’ll learn how to use functions such as SearchManager.geocode() from the Maps.Search module in order to read data. You’ll also learn how to use functions such as GeoDataAPIManager.getBoundary() from the Maps.SpatialDataService module in order to parse and manipulate data.
In section 4.3, you’ll learn how to create a color-gradient legend and how to use a legend to convert a numeric value from 0 to 100 into a corresponding color. You’ll also learn how to use gradient-legend colors to shade areas on a map.
In section 4.4, you’ll learn how to create custom-styled Infobox objects. You’ll also learn how to generate reproducible pseudorandom numbers using the Lehmer algorithm (sometimes called the Park-Miller algorithm).
4.1 Clustered pushpins
Dealing with large numbers of data points on a map application can be challenging. One of the most powerful features of the Bing Maps V8 library is its ability to cluster data points as pushpin objects. The feature is best explained with a visual example.
The demo web application in Figure 21 loads a map centered near Indianapolis, Ind., with an initial zoom level set to 10.
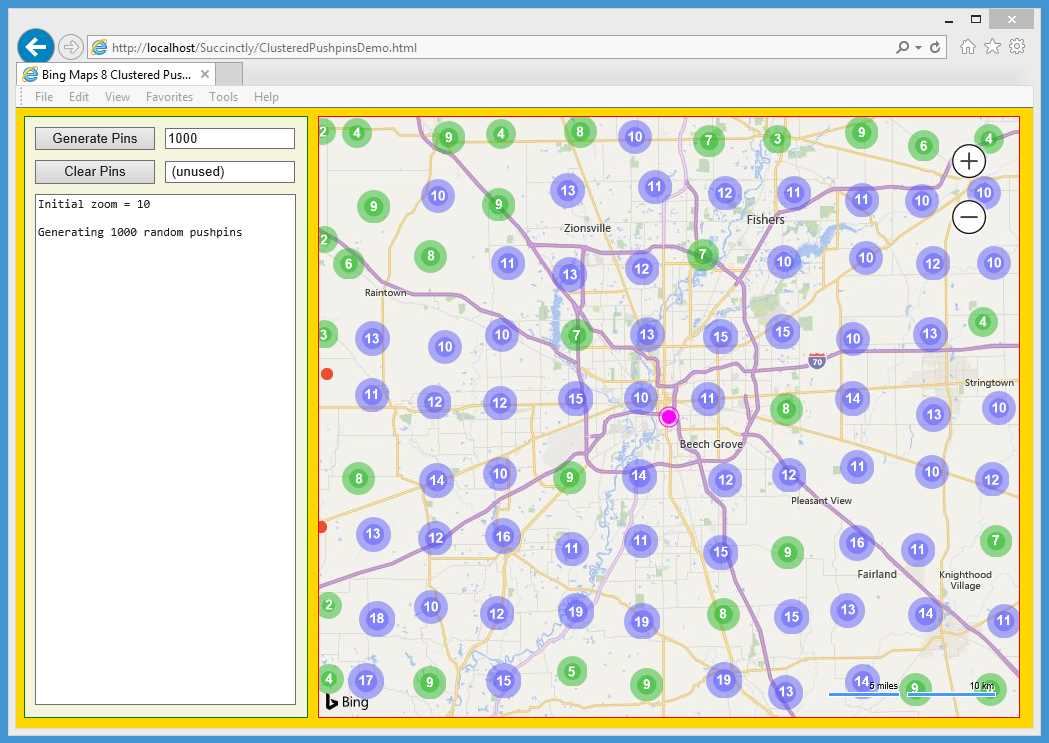
Figure 21: Clustered Pushpins Demo Initial View
When the user clicked “Generate Pins,” the application created 1000 pushpins with random locations within the initial map boundaries. The code logic is set up so that the map is divided into approximately 10 by 10 = 100 grid squares. A green circle icon indicates a grid has two to nine pushpins at that location. Individual pushpins are orange—you can see two of them at the left edge of the map. A blue circle means there are 10 to 99 pushpins.
Notice that most of the labels on the map, such as “Indianapolis,” are not visible. Behind the scenes, the Bing Maps library uses label-collision detection to automatically move or remove labels.
Next, the user clicked the “+” zoom control to get zoom level 12, so that most of the individual pushpins are visible and can be clicked. Notice that the “Indianapolis” label is now visible.
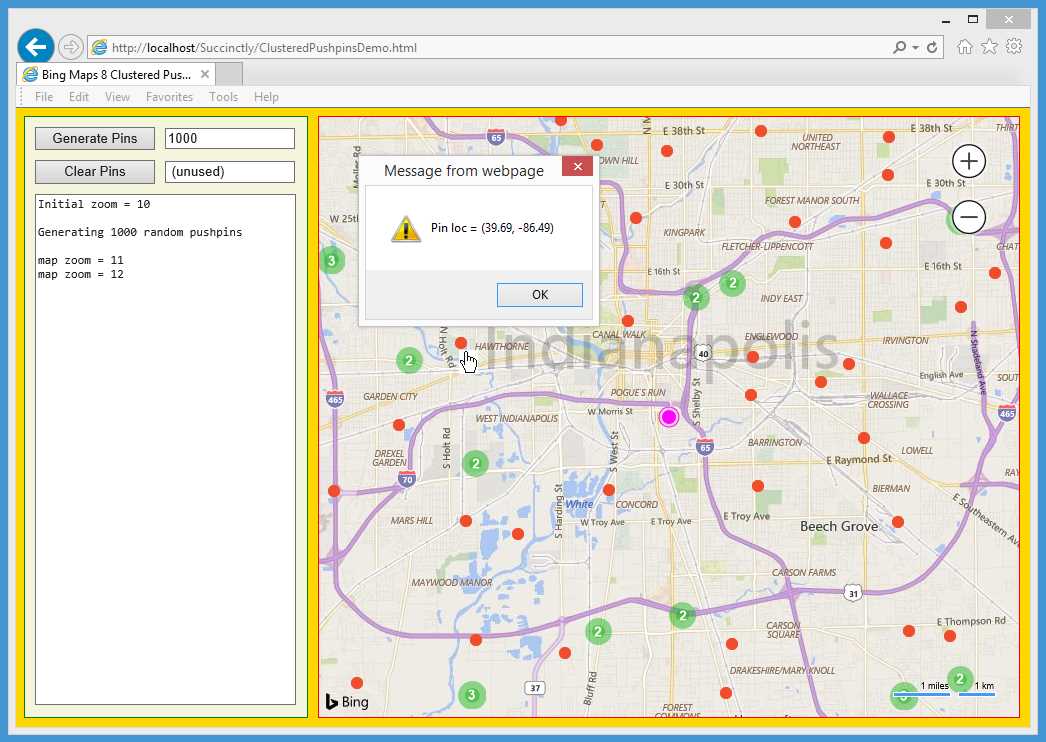
Figure 22: Clustered Pushpins Demo Zoom In
Next, the user clicked the “-“ zoom control five times to zoom out to level 7. A red circle indicates there are 100 or more pushpins. In Figure 23, four clusters have counts that sum to 1000.
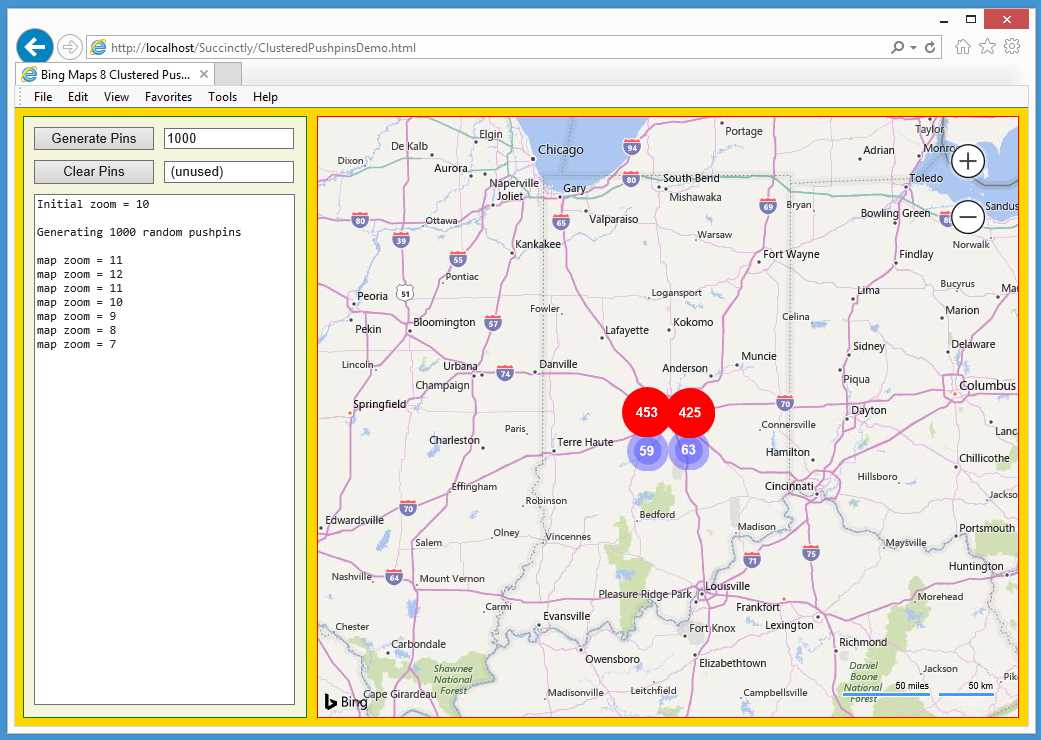
Figure 23: Cluster Pushpins Demo Zoom Out
The demo application is named ClusteredPushpinsDemo.html and is defined in a single file.
Code Listing 9: ClusteredPushpinsDemo.html
<!DOCTYPE html> <!-- ClusteredPushpinsDemo.html --> <html> <head> <title>Bing Maps 8 Clustered Pushpins</title> <meta http-equiv="Content-Type" content="text/html; charset=utf-8"/> <script type="text/javascript"> var map = null; var pushpins = []; var ppLayer = null; // ordinary pushpin layer var clusterLayer = null; // for pushpin clustering var orangeDot = 'data:image/png;base64,iVBORw0KGgoAAAANSUhEUgAAAAw' + 'AAAAMCAYAAABWdVznAAAAGXRFWHRTb2Z0d2FyZQBBZG9iZSBJbWFnZVJlYWR5cc' + 'llPAAAAIxJREFUeNpiZICCD766CkCqHogDgFgAJgzEG4C4UWDz5QcgAUaoYgMgt' + 'R9JIToAaXQEarrACDX5PB7FyJoMmaDOIKSYAaqmngnqZmJBABORpsNtYWIgETBB' + 'PUMs+MAEDWdiwQaQhkYibQGpaWSCxqAjAU2wiHsA9jQoBkGRAsQL0DR+gIoZQtU' + 'wAAQYAGgpKDzqLFoIAAAAAElFTkSuQmCC'; function GetMap() { var options = { credentials: "Anw _ _ _ 3xt", center: new Microsoft.Maps.Location(39.75, -86.15), // Indy mapTypeId: Microsoft.Maps.MapTypeId.road, zoom: 10, enableClickableLogo: false, showCopyright: false, showMapTypeSelector: false, showLocateMeButton: false }; var mapDiv = document.getElementById("mapDiv"); map = new Microsoft.Maps.Map(mapDiv, options); WriteLn('Initial zoom = ' + map.getZoom()); Microsoft.Maps.Events.addHandler(map, 'viewchangeend', ViewChanged); ppLayer = new Microsoft.Maps.Layer(); var cpp = new Microsoft.Maps.Pushpin(map.getCenter(), { color: "fuchsia" }); ppLayer.add(cpp); map.layers.insert(ppLayer); } function ViewChanged(e) { var z = map.getZoom(); WriteLn('map zoom = ' + z); }
function WriteLn(txt) { var existing = msgArea.value; msgArea.value = existing + txt + "\n"; } function Button1_Click() { var numPins = parseInt(textbox1.value); var mb = map.getBounds(); var tdg = Microsoft.Maps.TestDataGenerator; var locs = tdg.getLocations(numPins, mb); WriteLn("\nGenerating " + numPins + " random pushpins \n");
var n = locs.length; var ppOptions = { icon: orangeDot, anchor: new Microsoft.Maps.Point(4,4) }; for (var i = 0; i < n; ++i) { var pp = new Microsoft.Maps.Pushpin(locs[i], ppOptions); pp.meta = locs[i]; Microsoft.Maps.Events.addHandler(pp, 'click', function() { alert( "Pin loc = " + LatLonStr(pp.meta) ); } ); pushpins[i] = pp; } // Add the pushpins to a cluster layer. Microsoft.Maps.loadModule('Microsoft.Maps.Clustering', function() { clusterLayer = new Microsoft.Maps.ClusterLayer(pushpins, { clusteredPinCallback: MakeClusterPins, gridSize: 70 // 70 pixels = ~1/10 of map width }); map.layers.insert(clusterLayer); }); } function MakeClusterPins(clusterDot) { // Customize the pushpin/dot that represents a cluster. var minRadius = 12; var outlineWidth = 7; var count = clusterDot.containedPushpins.length; var radius = 2.2 * Math.log(count) + minRadius; var fillColor = null;
if (count >= 100) { fillColor = 'red'; // solid red } else if (count >= 10 && count <= 99) { fillColor = 'rgba(80, 80, 255, 0.45)'; // blue-ish } else if (count >= 2 && count <= 9) { fillColor = 'rgba(20, 180, 20, 0.45)'; // green-ish }
var img = '<svg xmlns="http://www.w3.org/2000/svg" width="' + (radius * 2) + '" height="' + (radius * 2) + '">' + '<circle cx="' + radius + '" cy="' + radius + '" r="' + radius + '" fill="' + fillColor + '"/>' + '<circle cx="' + radius + '" cy="' + radius + '" r="' + (radius - outlineWidth) + '" fill="' + fillColor + '"/>' + '</svg>'; clusterDot.setOptions({ icon: img, anchor: new Microsoft.Maps.Point(radius, radius), textOffset: new Microsoft.Maps.Point(0, radius - 8) }); } function LatLonStr(loc) { var s = "(" + Number(loc.latitude).toFixed(2) + ", " + Number(loc.longitude).toFixed(2) + ")"; return s; } function Button2_Click(e) { WriteLn("Clearing all clustered pushpins"); clusterLayer.clear(); } </script> </head> <body style="background-color:gold"> <div id='controlPanel' style="float:left; width:262px; height:580px; border:1px solid green; padding:10px; background-color: beige"> <input id="button1" type='button' value='Generate Pins' style="width:120px;" onclick="Button1_Click();"></input> <div style="width:2px; display:inline-block"></div> <input id="textbox1" type='text' size='16' value='1000'></input><br/> <span style="display:block; height:10px"></span> <input id="button2" type='button' value='Clear Pins' style="width:120px;" onclick="Button2_Click();"></input> <div style="width:2px; display:inline-block"></div> <input id="textbox2" type='text' size='16' value=' (unused) '></input><br/> <span style="display:block; height:10px"></span> <textarea id='msgArea' rows="36" cols="36" style="font-family:Consolas; font-size:12px"></textarea> </div> <div style="float:left; width:10px; height:600px"></div> <div id='mapDiv' style="float:left; width:700px; height:600px; border:1px solid red;"></div> <br style="clear: left;" />
<script type='text/javascript' </body> </html> |
The demo sets up five script-global objects:
var map = null;
var pushpins = [];
var ppLayer = null; // ordinary pushpin layer
var clusterLayer = null; // for pushpin clustering
var orangeDot = 'data:image/png;base64,iVBORw0KGgoAAAANSUhEUgAAAAw' +
'AAAAMCAYAAABWdVznAAAAGXRFWHRTb2Z0d2FyZQBBZG9iZSBJbWFnZVJlYWR5cc' +
'llPAAAAIxJREFUeNpiZICCD766CkCqHogDgFgAJgzEG4C4UWDz5QcgAUaoYgMgt' +
'R9JIToAaXQEarrACDX5PB7FyJoMmaDOIKSYAaqmngnqZmJBABORpsNtYWIgETBB' +
'PUMs+MAEDWdiwQaQhkYibQGpaWSCxqAjAU2wiHsA9jQoBkGRAsQL0DR+gIoZQtU' +
'wAAQYAGgpKDzqLFoIAAAAAElFTkSuQmCC';
When using pushpin clustering, typically you create one layer for the individual pushpins and a second layer for the clusters that represent multiple pushpins. The orangeDot object is a Base64-encoded PNG image of an orange circle with radius six pixels. A more common alternative is to use an ordinary image. For example:
var orangeDot = "./images/12x12Orange.png";
The map is loaded with a zoom: 10 option and the showCopyright, showMapTypeSelector, and showLocateMeButton options are set to false in order to keep the map visually clean. A default-style ordinary pushpin with color: fuchsia is placed at the center to act as a point of reference.
The map viewchangeend event handler is modified so that control will be transferred to a program-defined function named ViewChanged() in order for the zoom level to be logged.
Function ViewChanged() is defined:
function ViewChanged(e)
{
var z = map.getZoom();
WriteLn('map zoom = ' + z);
}
The viewchangeend event is triggered by several actions in addition to a zoom change. Alternatively, we can use a global object named something like zoomLev and write a message only when the new value of getZoom() differs from the current zoomLev value.
The button control labeled “Get Pushpins” is associated with function Button1_Click():
function Button1_Click()
{
var numPins = parseInt(textbox1.value);
var mb = map.getBounds();
var tdg = Microsoft.Maps.TestDataGenerator;
var locs = tdg.getLocations(numPins, mb);
WriteLn("\nGenerating " + numPins + " random pushpins \n");
. . .
The key idea here is the use of the static getLocations() function in the Maps.TestDataGenerator module. That function expects a number of Location objects to generate and a Bounds object that limits the range of the latitudes and longitudes of the returned array of Location objects.
The TestDataGenerator module includes a minor weakness—it uses the built-in JavaScript Math.random() function that cannot be seeded, which means you’ll get different results every time getLocations() is called, even when you want reproducible results. Alternatively, you can write your own seedable, random-number generator that can be seeded and use it to generate Location objects.
The pushpins with random locations are created with this code:
var n = locs.length;
var ppOptions = { icon: orangeDot, anchor: new Microsoft.Maps.Point(4,4) };
for (var i = 0; i < n; ++i) {
var pp = new Microsoft.Maps.Pushpin(locs[i], ppOptions);
pp.meta = locs[i];
Microsoft.Maps.Events.addHandler(pp, 'click', function() {
alert( "Pin loc = " + LatLonStr(pp.meta) );
});
pushpins[i] = pp; // store into global array
}
Each pushpin has its click event handler modified so that it will display its location, formatted using LatLonStr(), in a simple alert box. An alternative is to use an Infobox object.
After the pushpins have been created and stored, they are added to the cluster layer:
. . .
Microsoft.Maps.loadModule('Microsoft.Maps.Clustering',
function() {
clusterLayer = new Microsoft.Maps.ClusterLayer(pushpins, {
clusteredPinCallback: MakeClusterPins,
gridSize: 70
});
map.layers.insert(clusterLayer);
});
} // end Button1_Click()
The anonymous callback function uses the ClusterLayer() constructor to add all the pushpins to the global clusterLayer object. The clusteredPinCallback property points to a function MakeClusterPins() that will define the size and color of the cluster icons. The gridSize property is set to 70 pixels, which is one-tenth the width of the map. Alternatively, you can set the grid size programmatically using the Map.getWidth() function.
Function MakeClusterPins() starts by setting the size of the cluster icons:
function MakeClusterPins(clusterDot)
{
var minRadius = 12;
var outlineWidth = 7;
var count = clusterDot.containedPushpins.length;
var radius = 2.2 * Math.log(count) + minRadius;
. . .
Calculating the radius of the cluster icon based on the count of the number of pushpins it represents can be somewhat tricky. The idea is to set an absolute minimum radius, then add a bonus for icons that represent a large number of pushpins. The Math.log() function returns the log to the base e of its argument. The log of the count of pushpins will be a value of no more than roughly 9.5, and the 2.2 factor was determined by a bit of trial and error. Instead of calculating a variable radius, you can simply use a fixed value.
Next, the color of the cluster icon is determined:
var fillColor = null;
if (count >= 100) {
fillColor = 'red'; // solid red
}
else if (count >= 10 && count <= 99) {
fillColor = 'rgba(80, 80, 255, 0.45)'; // blue-ish
}
else if (count >= 2 && count <= 9) {
fillColor = 'rgba(20, 180, 20, 0.45)'; // green-ish
}
If you look at the figures at the beginning of this section, you’ll see that that blue and green cluster icons are two concentric circles. By using the rgba() function and setting the alpha value to 0.45, the outer circle will be a bit transparent. When the inner circle is drawn, it will appear nearly solid. An alternative to the rbga() function is the Maps.Color class.
Next, the double-circle icon image is created using SVG:
var img = '<svg xmlns="http://www.w3.org/2000/svg" width="' +
(radius * 2) + '" height="' + (radius * 2) + '">' +
'<circle cx="' + radius + '" cy="' + radius + '" r="' +
radius + '" fill="' + fillColor + '"/>' +
'<circle cx="' + radius + '" cy="' + radius + '" r="' +
(radius - outlineWidth) + '" fill="' + fillColor + '"/>' +
'</svg>';
Alternatively, we can define a function along the lines of CreateSvgConcentric(). Another alternative is to define the icon using an HTML canvas object.
The callback function concludes by creating the cluster icon:
. . .
clusterDot.setOptions({
icon: img,
anchor: new Microsoft.Maps.Point(radius, radius),
textOffset: new Microsoft.Maps.Point(0, radius - 8)
});
}
The textOffset property takes into account the height of the count text in the center of the cluster icon.
In summary, you create clustered pushpins by first creating an array of pushpins and a Layer object for the pushpins in the usual way. Next, you define an anonymous function in the Maps.Clustering module that calls the ClusterLayer() constructor, which in turn optionally sets a callback function that defines the size and color of a cluster icon.
Resources
For detailed information about cluster layer options, see:
https://msdn.microsoft.com/en-us/library/mt712813.aspx.
For further detailed information about the cluster layer class, see:
https://msdn.microsoft.com/en-us/library/mt712808.aspx.
For information about using the Maps.Color class instead of the rgba() function, see:
https://msdn.microsoft.com/en-us/library/mt712639.aspx.
4.2 Geosearch
The Bing Maps V8 library has many functions that allow you to query the Bing Maps Spatial Data Services. You can think of the Bing Maps Spatial Data Services as a huge geodatabase that can be queried by using a RESTful URL. The Bing Maps library has wrapper functions that make calling into the Bing Maps Spatial Data Services quite a bit easier than calling the services directly.
The demo web application in Figure 24 loads a map centered near the border of Nebraska and Kansas with an initial zoom level set to 3.
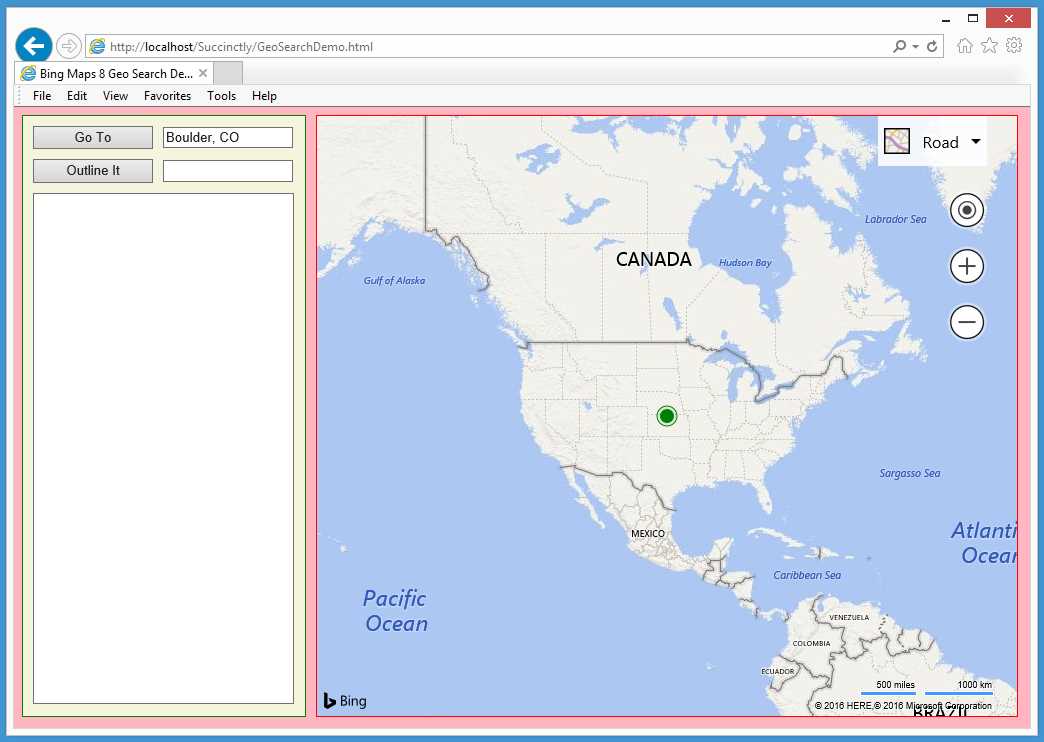
Figure 24: Initial Map View for Geosearch Demo
The application places a default-style, green pushpin at the map center to act as a point of reference. The top-most text box control is prepopulated with “Boulder, CO,” but it is editable.
When the user clicked “Go To,” the application loaded the Map.Search module behind the scenes and sent a request to the Bing Maps Spatial Data Services for information about the specified location.
When the information about Boulder was returned, the application saved the results for later use, then automatically determined a “best view.”
In this example, the user determined the best view for Boulder, CO, to be a zoom level of 12 and a map center location of (40.02, -105.28).
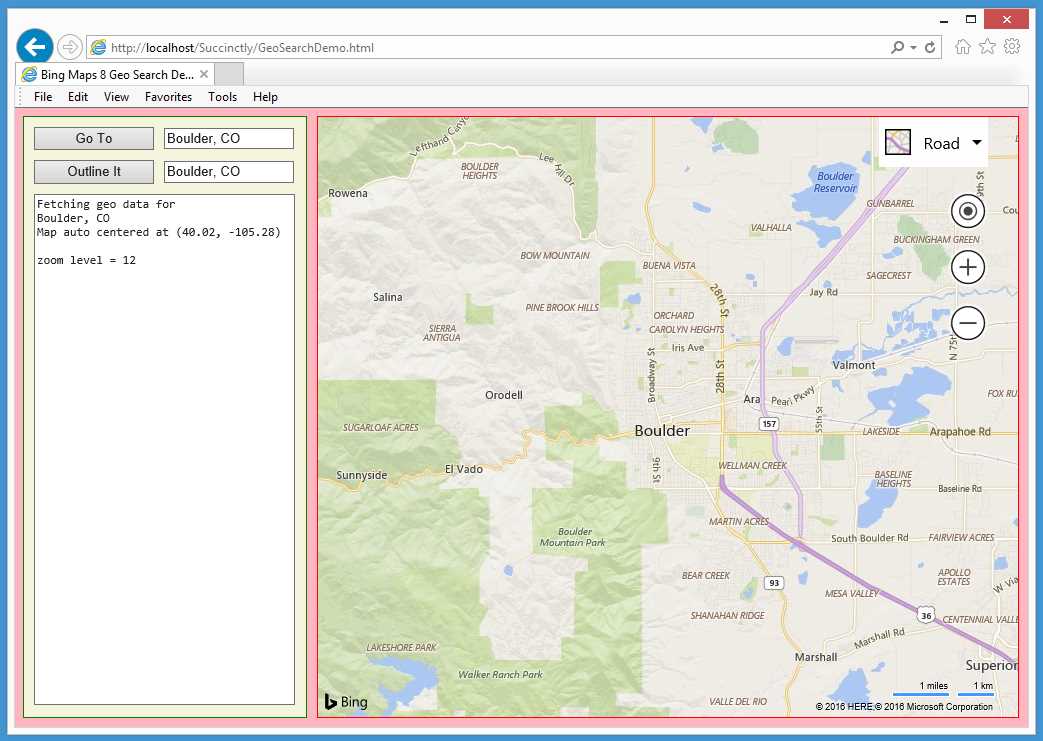
Figure 25: Get Data for a Populated Place
Next, the user clicked “Outline It.” The application loaded the Maps.SpatialDataService module, then used it to color the boundaries of Boulder, CO.
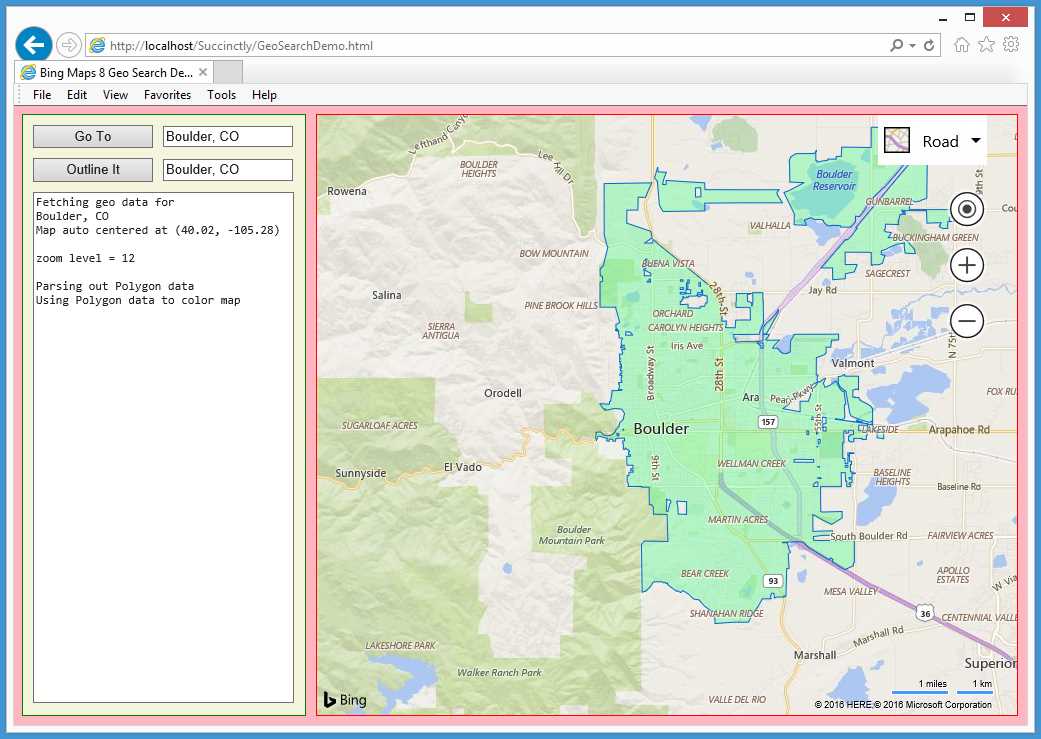
Figure 26: Color Polygon Information for a Populated Place
The demo application is named GeoSearchDemo.html and is defined in a single file.
Code Listing 10: GeoSearchDemo.html
<!DOCTYPE html> <!-- GeoSearchDemo.html --> <html> <head> <title>Bing Maps 8 Geo Search Demo</title> <meta http-equiv="Content-Type" content="text/html; charset=utf-8"/> <script type="text/javascript"> var map = null; var ppLayer = null; var geoShapeLayer = null; var geoResult = null; function GetMap() { var options = { credentials: "Anw _ _ _ 3xt", center: new Microsoft.Maps.Location(39.80, -98.60), mapTypeId: Microsoft.Maps.MapTypeId.road, zoom: 3, enableClickableLogo: false, showTermsLink: false }; var mapDiv = document.getElementById("mapDiv"); map = new Microsoft.Maps.Map(mapDiv, options); Microsoft.Maps.Events.addHandler(map, 'viewchangeend', ViewChanged); ppLayer = new Microsoft.Maps.Layer(); var cpp= new Microsoft.Maps.Pushpin(map.getCenter(), {color: 'green'}); ppLayer.add(cpp); map.layers.insert(ppLayer); geoShapeLayer = new Microsoft.Maps.Layer(); } function ViewChanged(e) { var z = map.getZoom(); WriteLn('\nzoom level = ' + z); }
function WriteLn(txt) { var existing = msgArea.value; msgArea.value = existing + txt + "\n"; } function Button1_Click(e) { var city = textbox1.value; textbox2.value = city; // echo WriteLn("Fetching geo data for \n" + city.toString());
Microsoft.Maps.loadModule('Microsoft.Maps.Search', function() { var searchManager = new Microsoft.Maps.Search.SearchManager(map); var geoRequest = { where: city, callback: function(res) { geoResult = res; // Save for use by the outliner function. if (res && res.results && res.results.length > 0) { map.setView({ bounds: res.results[0].bestView }); WriteLn("Map auto centered at " + LatLonStr(map.getCenter())); } } }; searchManager.geocode(geoRequest); // Do an async request. }); } function Button2_Click(e) { var city = textbox1.value; WriteLn('\nParsing out Polygon data'); WriteLn('Using Polygon data to color map'); var geoOptions = { entityType: 'PopulatedPlace', getAllPolygons: true }; Microsoft.Maps.loadModule('Microsoft.Maps.SpatialDataService', function() { var apimgr = Microsoft.Maps.SpatialDataService.GeoDataAPIManager; apimgr.getBoundary(geoResult.results[0].location, geoOptions, map, function(data) { if (data.results && data.results.length > 0) { geoShapeLayer.add(data.results[0].Polygons); map.layers.insert(geoShapeLayer); } }); }); } function LatLonStr(loc) { var s = "(" + Number(loc.latitude).toFixed(2) + ", " + Number(loc.longitude).toFixed(2) + ")"; return s; }
</script> </head> <body onload="GetMap();" style="background-color:lightpink"> <div id='controlPanel' style="float:left; width:262px; height:580px; border:1px solid green; padding:10px; background-color: beige"> <input id="button1" type='button' value='Go To' style="width:120px;" onclick="Button1_Click();"></input> <div style="width:2px; display:inline-block"></div> <input id="textbox1" type='text' size='16' value='Boulder, CO'> </input><br/> <span style="display:block; height:10px"></span> <input id="button2" type='button' value='Outline It' style="width:120px;" onclick="Button2_Click();"></input> <div style="width:2px; display:inline-block"></div> <input id="textbox2" type='text' size='16' value=''></input><br/> <span style="display:block; height:10px"></span> <textarea id='msgArea' rows="36" cols="36" style="font-family:Consolas; font-size:12px"></textarea> </div> <div style="float:left; width:10px; height:600px"></div> <div id='mapDiv' style="float:left; width:700px; height:600px; border:1px solid red;"></div> <br style="clear: left;" /> <script type='text/javascript' </body> </html> |
The demo sets up four script-global objects:
var map = null;
var ppLayer = null;
var geoShapeLayer = null;
var geoResult = null;
The two Layer objects are declared globally even though they’re only used by a single function, GetMap() and Button2_Click(), respectively, to emphasize the idea of map layering. Object geoResult, however, is created in function Button1_Click(), then accessed in function Button2_Click() so that it’s legitimately global.
The event handler for the first button control is Button1_Click(). The definition of the function begins:
function Button1_Click(e)
{
var city = textbox1.value;
textbox2.value = city;
WriteLn("Fetching geo data for \n" + city.toString());
. . .
As you’ll see shortly, the Bing Maps Spatial Data Services database will be queried for what’s called a populated place. The service does quite a bit of intelligent guessing for ambiguous queries. For example, if the user specifies “Paris,” the query will return information about Paris, France, rather than the cities named Paris in Arkansas, Idaho, Illinois, Indiana, Iowa, Kentucky, Maine, Michigan, and Texas.
The search is performed this way:
. . .
Microsoft.Maps.loadModule('Microsoft.Maps.Search', function() {
var searchManager = new Microsoft.Maps.Search.SearchManager(map);
var geoRequest = {
where: city,
callback: function(res) {
geoResult = res; // save for use by the outliner function
if (res && res.results && res.results.length > 0) {
map.setView({ bounds: res.results[0].bestView });
WriteLn("Map auto centered at " +
LatLonStr(map.getCenter()));
}
}
};
searchManager.geocode(geoRequest);
});
}
There’s quite a bit going on here because of the nested callback functions. The first statement can be interpreted as, “Load the Maps.Search module and, when the load has completed, perform the following actions."
The next statement can be interpreted, “Instantiate a new SearchManager object on the current map object.” When the search executes, the query will look for data that is identified as a city in the Spatial Data Service, and, if any results are returned, save the results in the global geoResult object, then use the results to reposition and resize the map object using the setView() function.
The code in function Button2_Click() uses the query results to outline and color the target city. The definition begins:
function Button2_Click(e)
{
var city = textbox1.value;
WriteLn('\nParsing out Polygon data');
WriteLn('Using Polygon data to color map');
var geoOptions = { entityType: 'PopulatedPlace',
getAllPolygons: true };
. . .
The SearchManager object returns a lot of information, so the function sets up a geoOptions filter to fetch only data tagged as a PopulatedPlace and also to get all polygons. (Many cities have complex boundaries that are made up of multiple polygons.)
The data stored in global object geoResult is in WKT format that can be tricky to parse, but the getBoundary() function makes your life easier:
. . .
Microsoft.Maps.loadModule('Microsoft.Maps.SpatialDataService',
function() {
var apimgr = Microsoft.Maps.SpatialDataService.GeoDataAPIManager;
apimgr.getBoundary(geoResult.results[0].location, geoOptions, map,
function(data) {
if (data.results && data.results.length > 0) {
geoShapeLayer.add(data.results[0].Polygons);
map.layers.insert(geoShapeLayer);
}
});
});
}
In summary, you can use the SearchManager class of the Maps.Search module to query data from the Bing Maps Spatial Data Services rather than use a raw RESTful URL. You can use the GeoDataAPIManager class of the Maps.SpatialDataService class to parse the returned WKT format data.
Resources
For detailed information about the Maps.SpatialDataService module, see:
https://msdn.microsoft.com/en-us/library/mt712849.aspx.
For detailed information about the Maps.Search module, see:
https://msdn.microsoft.com/en-us/library/mt712846.aspx.
For information about using the QueryAPIManager class to query Bing services, see:
https://msdn.microsoft.com/en-us/library/mt712828.aspx.
For information about using the GeoDataAPIManager class to extract polygons, see:
https://msdn.microsoft.com/en-us/library/mt712862.aspx.
4.3 Gradient legends
For some geo-applications, it’s useful to create a continuous-color gradient, then use the color values defined by the gradient to color shapes and other map features. The Bing Maps V8 library doesn’t have any functions that allow you to directly create color-gradient legends, but it’s easy to combine an HTML5 canvas with a custom pushpin to create a gradient legend.
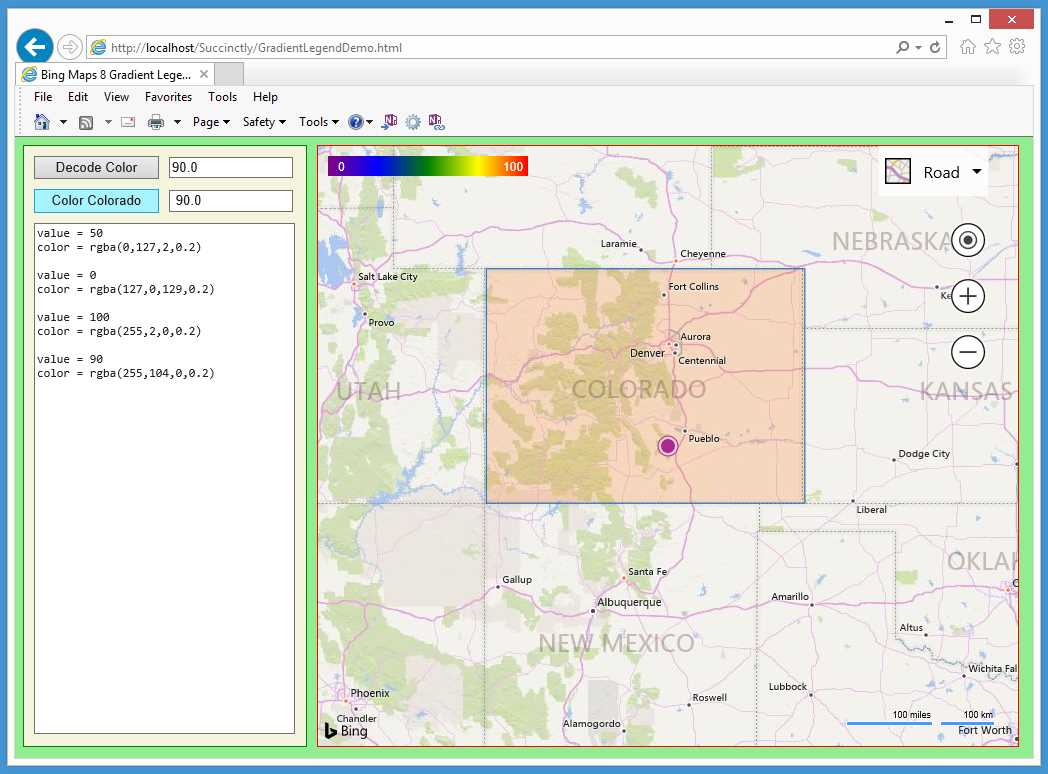
Figure 27: Gradient Legend Demo
The demo web application shown in Figure 27 initially loads a map centered at (38.00, -105.00) and places a default, large purple pushpin at center. Behind the scenes, a color-gradient legend is programmatically created as a custom pushpin and placed in the northwest corner of the map.
The gradient’s colors range from purple through green to red, and each color corresponds to a numeric value between 0 (purple) and 100 (red). Whenever the user changes zoom level or scrolls the map, the legend is redrawn in the northwest corner.
The button labeled “Decode Color” displays the color as an RGBA that corresponds to the numeric value in the associated text box control. The button labeled “Color Colorado” does just that, using the color corresponding to the numeric value in the associated text box control.
The demo web application is named GradientLegendDemo.html and is defined in a single file.
Code Listing 11: GradientLegendDemo.html
<!DOCTYPE html> <!-- GradientLegendDemo.html --> <html> <head> <title>Bing Maps 8 Gradient Legend Demo</title> <meta http-equiv="Content-Type" content="text/html; charset=utf-8"/> <script type='text/javascript'> var map = null; var ppLayer = null; // pushpin layer var legendLayer = null; var stateLayer = null; var legend = null; var legendImageInfo = null; var colorado = 'GEOMETRYCOLLECTION( POLYGON ((-102 41, -109 41, -109 37,' + '-102 37, -102 41)) )'; function GetMap() { var options = { credentials: "Anw _ _ _ 3xt", center: new Microsoft.Maps.Location(38.00, -105.00), mapTypeId: Microsoft.Maps.MapTypeId.road, zoom: 6, enableClickableLogo: false, showCopyright: false }; var mapDiv = document.getElementById("mapDiv"); map = new Microsoft.Maps.Map(mapDiv, options); Microsoft.Maps.Events.addHandler(map, 'viewchangeend', ViewChanged); ppLayer = new Microsoft.Maps.Layer(); var cpp= new Microsoft.Maps.Pushpin(map.getCenter(), null); ppLayer.add(cpp); map.layers.insert(ppLayer); legendLayer = new Microsoft.Maps.Layer(); CreateLegend(); var legendOpt = { icon: legend, anchor: new Microsoft.Maps.Point(-10,-10) }; var bounds = map.getBounds(); var nw = bounds.getNorthwest(); var legendPp = new Microsoft.Maps.Pushpin(nw, legendOpt); legendLayer.add(legendPp); map.layers.insert(legendLayer); stateLayer = new Microsoft.Maps.Layer(); } function ViewChanged(e) { // Relocate legend. legendLayer.clear(); var legendOpt = { icon: legend, anchor: new Microsoft.Maps.Point(-10,-10) }; var bounds = map.getBounds(); var nw = bounds.getNorthwest(); var legendPp = new Microsoft.Maps.Pushpin(nw, legendOpt); legendLayer.add(legendPp); map.layers.insert(legendLayer); } function WriteLn(txt) { var existing = msgArea.value; msgArea.value = existing + txt + "\n"; } function Button1_Click() { // Get color, associate with a value. var maxValue = 100; var v = parseInt(textbox1.value); var color = GetLegendColor(v, maxValue); WriteLn("value = " + v); WriteLn("color = " + color.toString()); WriteLn(""); } function CreateLegend() { // Create, save a legend as png for use as a custom pushpin. var c = document.createElement('canvas'); c.width = 200; c.height = 20; var ctx = c.getContext("2d"); var grd = ctx.createLinearGradient(0, 0, c.width, 0); grd.addColorStop(0.0, "purple"); grd.addColorStop(0.25, "blue"); grd.addColorStop(0.50, "green"); grd.addColorStop(0.75, "yellow"); grd.addColorStop(1.0, "red"); ctx.fillStyle = grd; ctx.fillRect(0, 0, c.width, c.height); // Rectangle fills canvas. ctx.font = "12px Arial"; ctx.fillStyle = "white"; ctx.fillText("100", 175, 15); ctx.fillText("0", 10, 15); legendImageInfo = ctx.getImageData(0, 0, c.width, 1); // Save pixel info. legend = c.toDataURL(); // Save as png for custom pp. } function GetLegendColor(value, maxValue) { value = (value > maxValue) ? maxValue : value; var idx = Math.round((value / maxValue) * 200) * 4 - 4; if (idx < 0) { idx = 0; } return 'rgba(' + legendImageInfo.data[idx] + ',' + legendImageInfo.data[idx + 1] + ',' + legendImageInfo.data[idx + 2] + ',' + '0.2)'; } function Button2_Click() { var colorVal = parseInt(textbox2.value); var colorRgba = GetLegendColor(colorVal, 100); Microsoft.Maps.loadModule('Microsoft.Maps.WellKnownText', function () { var geoColl = Microsoft.Maps.WellKnownText.read(colorado, { polygonOptions: { fillColor: colorRgba } }); for (var i = 0; i < geoColl.length; ++i) { stateLayer.add(geoColl[i]); } map.layers.insert(stateLayer); }); } </script> </head> <body style="background-color:lightgreen"> <div id='controlPanel' style="float:left; width:262px; height:580px; border:1px solid green; padding:10px; background-color: beige"> <input id="button1" type='button' style="width:125px;" value=' Decode Color ' onclick="Button1_Click();"></input> <div style="width:2px; display:inline-block"></div> <input id="textbox1" type='text' size='15' value=' 50.0 '></input><br/> <span style="display:block; height:10px"></span> <input id="button2" type='button' style="width:125px;" value='Color Colorado' onclick="Button2_Click();"></input> <div style="width:2px; display:inline-block"></div> <input id="textbox2" type='text' size='15' value=' 50.0 '></input><br/> <span style="display:block; height:10px"></span> <textarea id='msgArea' rows="36" cols="36" style="font-family:Consolas; font-size:12px"></textarea> </div> <div style="float:left; width:10px; height:600px"></div> <div id='mapDiv' style="float:left; width:700px; height:600px; border:1px solid red;"></div> <br style="clear: left;" /> <script type='text/javascript' </body> </html> |
The demo application sets up seven global script-scope objects:
var map = null;
var ppLayer = null;
var legendLayer = null;
var stateLayer = null;
var legend = null;
var legendImageInfo = null;
var colorado =
'GEOMETRYCOLLECTION( POLYGON ((-102 41, -109 41, -109 37,' +
'-102 37, -102 41)) )';;
Object ppLayer is a map layer for holding ordinary pushpins. The color-gradient legend is actually a custom pushpin, and a legendLayer map layer object is created for it. The stateLayer object is for a polygon that outlines Colorado.
The legend object is actually a PNG image that will be created programmatically and act as the icon for a custom pushpin. The legendImageInfo is an object that holds information about the legend image and is used to map numeric values to color values.
The colorado object is a polygon shape defined using WKT syntax. Colorado is quite simple and has just five lat-lon vertices (the last vertex duplicates the first in order to close the shape).
The demo application loads the map object asynchronously by calling the program-defined GetMap() function in the usual way. The statements that create the color-gradient legend are:
legendLayer = new Microsoft.Maps.Layer();
CreateLegend();
var legendOpt = { icon: legend,
anchor: new Microsoft.Maps.Point(-10,-10) };
The key code is contained in program-defined function CreateLegend(). The options object sets the anchor with an offset of 10 pixels so that the legend won’t be flush with the map edge.
The statements that place the gradient legend on the map are:
var bounds = map.getBounds();
var nw = bounds.getNorthwest();
var legendPp = new Microsoft.Maps.Pushpin(nw, legendOpt);
legendLayer.add(legendPp);
map.layers.insert(legendLayer);
The legend is simply a pushpin in disguise, and it’s placed on the map like a normal pushpin. The definition of CreateLegend() begins with:
function CreateLegend()
{
var c = document.createElement('canvas');
c.width = 200;
c.height = 20;
var ctx = c.getContext("2d");
. . .
We use an HTML5 canvas to draw a color gradient, then convert that canvas to a PNG image for use as a custom pushpin icon. As you'll see shortly, using an HTML5 canvas is preferable to using SVG or a static image. Next, a color gradient is created using the built-in createLinearGradient() function:
var grd = ctx.createLinearGradient(0, 0, c.width, 0);
grd.addColorStop(0.0, "purple");
grd.addColorStop(0.25, "blue");
grd.addColorStop(0.50, "green");
grd.addColorStop(0.75, "yellow");
grd.addColorStop(1.0, "red");
The arguments to createLinearGradient() can be tricky. In this case, they define a gradient that goes across the entire width of the canvas rather than from top to bottom. Next, the function fills a rectangle using the gradient information:
ctx.fillStyle = grd;
ctx.fillRect(0, 0, c.width, c.height); // rectangle fills canvas
ctx.font = "12px Arial";
ctx.fillStyle = "white";
ctx.fillText("100", 175, 15);
ctx.fillText("0", 10, 15);
The code places labels “0” and “100” at the left and right ends of the gradient. The positioning argument values (175, 15, 10, 15) were determined using a bit of trial and error. The function definition concludes with:
. . .
legendImageInfo = ctx.getImageData(0, 0, c.width, 1);
legend = c.toDataURL();
}
The getImageData() function returns an array of RGBA data from the gradient. These values will be used by a program-defined function that maps a number value from 0 to 100 to an RGBA color. The oddly named toDataURL() function returns a PNG image for display purposes.
The first button in the control panel area is for informational purposes and displays the RGBA information defined by the color gradient for a specified value. The code is:
function Button1_Click()
{
var maxValue = 100;
var v = parseInt(textbox1.value);
var color = GetLegendColor(v, maxValue);
WriteLn("value = " + v);
WriteLn("color = " + color.toString());
WriteLn("");
}
All the real work is performed by the GetLegendColor() function, which pulls information from the script-global legendImageInfo object and is defined as:
function GetLegendColor(value, maxValue)
{
value = (value > maxValue) ? maxValue : value;
var idx = Math.round((value / maxValue) * 200) * 4 - 4;
if (idx < 0) {
idx = 0;
}
return 'rgba(' + legendImageInfo.data[idx] + ',' +
legendImageInfo.data[idx + 1] + ',' +
legendImageInfo.data[idx + 2] + ',' + '0.2)';
}
The index value takes into account that each pixel has four values. The alpha value is hard-coded to 0.2, but you might want to parameterize it. The color value is determined by the legendImageInfo information that was created from the HTML5 canvas object. Without this information, mapping a numeric value to a color from a gradient would be quite difficult.
The second button control colors the polygon that outlines Colorado. The code is:
function Button2_Click()
{
var colorVal = parseInt(textbox2.value);
var colorRgba = GetLegendColor(colorVal, 100);
Microsoft.Maps.loadModule('Microsoft.Maps.WellKnownText', function () {
var geoColl = Microsoft.Maps.WellKnownText.read(colorado,
{ polygonOptions: { fillColor: colorRgba } });
for (var i = 0; i < geoColl.length; ++i) {
stateLayer.add(geoColl[i]);
}
map.layers.insert(stateLayer);
});
}
The read() function of the WKT module parses the WKT data stored in the colorado object into an array of polygons because many shapes (such as Hawaii) are made up of several polygons. The color of the polygon is set to the RGBA value that corresponds to a numeric value from 0 to 100. Instead of storing and reading data as WKT, using the GeoJSON format offers an important alternative. For example:
var wyoming = { 'type': 'FeatureCollection',
'features': [{ 'type': 'Feature', 'id': 'WY',
'properties': { 'name': 'Wyoming' },
'geometry': { 'type': 'Polygon', 'coordinates':
[[[-104.05,41],[-104.05,45],[-111.05,45],[-111.05,41],[-104.05,41]]]
} }] };
And then:
Microsoft.Maps.loadModule('Microsoft.Maps.GeoJson', function () {
var geoColl = Microsoft.Maps.GeoJson.read(wyoming,
{ polygonOptions: { fillColor: colorRgba } });
for (var i = 0; i < geoColl.length; ++i) {
stateLayer.add(geoColl[i]);
}
map.layers.insert(stateLayer);
});
In summary, one way to create a gradient legend is to draw an HTML5 canvas, convert it to a PNG image, and use the image as the icon for a custom pushpin. This technique allows to you write a function that maps a numeric value to a color in the gradient. The Bing Maps V8 library can work with WKT- and GeoJSON-formatted data.
Resources
For detailed information about the Bing Maps V8 Well Known Text module, see:
https://msdn.microsoft.com/en-us/library/mt712880.aspx.
For detailed information about the Bing Maps V8 GeoJSON module, see:
https://msdn.microsoft.com/en-us/library/mt712806.aspx.
4.4 Custom Infobox objects
The Bing Maps library allows you to create custom-styled Infobox objects using ordinary CSS markup combined with the JavaScript string replace() function. During development, it’s often useful to generate random Location objects. The Maps.TestGenerator module has a getLocations() function. However, the locations generated are not reproducible. In order to generate reproducible random locations, you can write your own random-number generator.
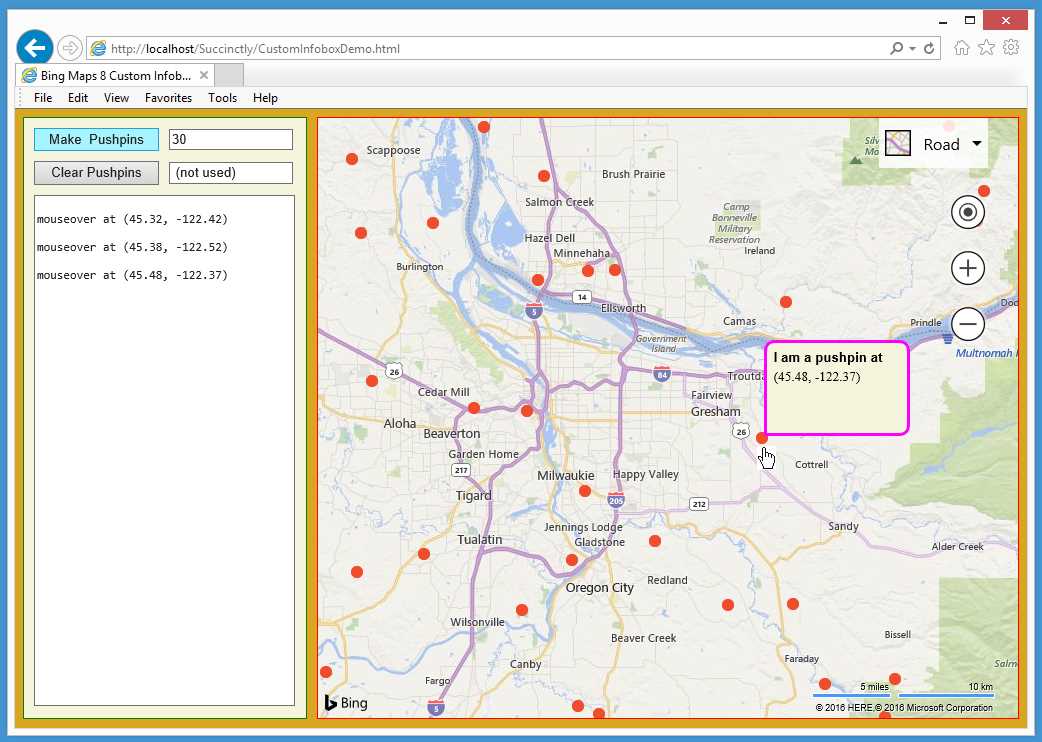
Figure 28: Custom Infobox with Reproducible Random Locations Demo
The demo web application shown in Figure 28 illustrates custom Infobox objects and custom pseudorandom-location generation. The demo initially loads a map centered at (45.50, -122.50), which is near Portland, Ore. When the user clicked “Make Pushpins,” the application used a custom random-number generator to create 30 random Location objects that are within the map boundaries.
The locations are then used to create 30 orange pushpins. Each pushpin’s mouseover event handler triggers the appearance of a custom-styled Infobox that displays the pushpin’s location.
The random locations are reproducible, meaning that if the pushpins are cleared away or the webpage is reloaded, clicking “Make Pushpins” will recreate the same 30 locations.
The demo application is named CustomInfoboxDemo.html and is defined in a single file.
Code Listing 12: CustomInfoboxDemo.html
<!DOCTYPE html> <!-- CustomInfoboxDemo.html --> <html> <head> <title>Bing Maps 8 Custom Infobox Demo</title> <meta http-equiv='Content-Type' content='text/html; charset=utf-8'/> <script type='text/javascript'> var map = null; var ctr = null; var pushpins = []; var ppLayer = null; var infobox = null; var ibTemplate = null; function GetMap() { var options = { credentials: "Anw _ _ _ 3xt", center: new Microsoft.Maps.Location(45.50, -122.50), // Portland, OR mapTypeId: Microsoft.Maps.MapTypeId.road, zoom: 10, enableClickableLogo: false, showTermsLink: false }; var mapDiv = document.getElementById("mapDiv"); map = new Microsoft.Maps.Map(mapDiv, options); ctr = map.getCenter();
ppLayer = new Microsoft.Maps.Layer(); ibTemplate = '<div id="ibBox" style="border-radius: 10px 10px 10px 0px;' + ' background-color:beige; border-style:solid; border-width:medium;' + ' border-color:magenta; min-height: 90px; width: 140px; ">' + ' <b id="ibTitle" style="position: absolute; top: 10px; left: 10px;' + ' width: 220px; font-family:Arial; font-size:small">{title}</b>' + ' <a id="ibDesc" style="position: absolute; top: 30px; left: 10px;' + ' width: 220px; font-size:small">{description}</a></div>';
infobox = new Microsoft.Maps.Infobox(ctr, { visible: false, htmlContent: ibTemplate.replace('{title}', 'dummy title').replace('{description}', 'dummy description') }); infobox.setMap(map); } function ShowInfobox(e) { var loc = e.target.getLocation(); infobox.setLocation(loc); WriteLn('\nmouseover at ' + LatLonStr(loc)); infobox.setOptions({ visible: true, offset: new Microsoft.Maps.Point(2, 2), htmlContent: ibTemplate.replace('{title}', 'I am a ' + e.targetType + ' at').replace('{description}', LatLonStr(loc)) }); } function HideInfobox(e) { infobox.setOptions({ visible: false }); } function Button1_Click() { var count = parseInt(textbox1.value); var locs = MakeLocs(count, map.getBounds(), 19); var orangeDot = 'data:image/png;base64,iVBORw0KGgoAAAANSUhEUgAAAAw' + 'AAAAMCAYAAABWdVznAAAAGXRFWHRTb2Z0d2FyZQBBZG9iZSBJbWFnZVJlYWR5cc' + 'llPAAAAIxJREFUeNpiZICCD766CkCqHogDgFgAJgzEG4C4UWDz5QcgAUaoYgMgt' + 'R9JIToAaXQEarrACDX5PB7FyJoMmaDOIKSYAaqmngnqZmJBABORpsNtYWIgETBB' + 'PUMs+MAEDWdiwQaQhkYibQGpaWSCxqAjAU2wiHsA9jQoBkGRAsQL0DR+gIoZQtU' + 'wAAQYAGgpKDzqLFoIAAAAAElFTkSuQmCC'; var ppOptions = { icon: orangeDot, anchor: new Microsoft.Maps.Point(6, 6) };
for (var i = 0; i < count; ++i) { var pp = new Microsoft.Maps.Pushpin(locs[i], ppOptions); Microsoft.Maps.Events.addHandler(pp, 'mouseover', ShowInfobox); Microsoft.Maps.Events.addHandler(pp, 'mouseout', HideInfobox); pushpins[i] = pp; } ppLayer.add(pushpins); map.layers.insert(ppLayer); } function Button2_Click() { ppLayer.clear(); } function MakeLocs(n, bounds, sd) { Math.myRandom = SetSeed(sd); var latHi = bounds.getNorth(); var latLo = bounds.getSouth(); var lonHi = bounds.getEast(); var lonLo = bounds.getWest();
var result = []; for (var i = 0; i < n; ++i) { var lat = (latHi - latLo) * Math.myRandom() + latLo; var lon = (lonHi - lonLo) * Math.myRandom() + lonLo; var loc = new Microsoft.Maps.Location(lat, lon); result.push(loc); } return result; } SetSeed = function(seed) { if (seed <= 0) { alert('Bad seed'); } function ParkMiller() { var hi = Math.floor(seed / 127773); var lo = seed % 127773; seed = (16807 * lo) - (2836 * hi); // global if (seed <= 0) { seed += 2147483647; } return seed / 2147483647; }
for (var i = 0; i < 20; ++i) { // Burn away first 20 results. var dummy = ParkMiller(); } return ParkMiller; } function WriteLn(txt) { var existing = msgArea.value; msgArea.value = existing + txt + "\n"; } function LatLonStr(loc) { var s = "(" + Number(loc.latitude).toFixed(2) + ", " + Number(loc.longitude).toFixed(2) + ")"; return s; } </script> </head> <body style="background-color:goldenrod"> <div id='controlPanel' style="float:left; width:262px; height:580px; border:1px solid green; padding:10px; background-color: beige">
<input id="button1" type='button' style="width:125px;" value=' Make Pushpins ' onclick="Button1_Click();"></input> <div style="width:2px; display:inline-block"></div> <input id="textbox1" type='text' size='15' value='30'></input><br/> <span style="display:block; height:10px"></span> <input id="button2" type='button' style="width:125px;" value=' Clear Pushpins ' onclick="Button2_Click();"></input> <div style="width:2px; display:inline-block"></div> <input id="textbox2" type='text' size='15' value=' (not used) '></input><br/> <span style="display:block; height:10px"></span> <textarea id='msgArea' rows="36" cols="36" style="font-family:Consolas; font-size:12px"></textarea> </div> <div style="float:left; width:10px; height:600px"></div> <div id='mapDiv' style="float:left; width:700px; height:600px; border:1px solid red;"></div> <br style="clear: left;" />
<script type='text/javascript' </body> </html> |
The demo sets up six script-global objects:
var map = null;
var ctr = null;
var pushpins = [];
var ppLayer = null;
var infobox = null;
var ibTemplate = null;
The Infobox object is a single Infobox that will be shared by all pushpins stored in the array named pushpins. The ibTemplate object is a string that will define the appearance of the Infobox object. Object ctr will hold the center latitude and longitude of the map.
The map is created using function GetMap(). The function also instantiates the custom template:
ibTemplate = '<div id="ibBox" style="border-radius: 10px 10px 10px 0px;' +
' background-color:beige; border-style:solid; border-width:medium;' +
' border-color:magenta; min-height: 90px; width: 140px; ">' +
' <b id="ibTitle" style="position: absolute; top: 10px; left: 10px;' +
' width: 220px; font-family:Arial; font-size:small">{title}</b>' +
' <a id="ibDesc" style="position: absolute; top: 30px; left: 10px;' +
' width: 220px; font-size:small">{description}</a></div>';
The template has three main areas. The first area defines the appearance of the box shape. That means the template is defined using ordinary CSS markup and that there will be a huge number of formatting options available to you.
The second area defines the appearance of the title of the Infobox. Notice the “{title}”—this will be replaced by specific content.
The third area defines the appearance of the description part of the Infobox, where “{description}” will be replaced by specific content. The “{title}” and “{description}” are not special words, so you could use “{foo}” and “{bar}” if you wish.
The global Infobox is created this way:
infobox = new Microsoft.Maps.Infobox(ctr, {
visible: false,
htmlContent: ibTemplate.replace('{title}',
'dummy title').replace('{description}', 'dummy description')
});
The Infobox is initially positioned at map center but is invisible. The JavaScript replace() function is used to store dummy text for the title and description. The replace-chaining is convenient and standard practice, but, in my opinion, it’s a bit ugly. An alternative is:
var s = ibTemplate.replace('{title}', 'dummy title');
var t = s.replace('{description}', 'dummy description');
. . .
htmlContent: t
The built-in JavaScript Math.random() function cannot accept an initial seed value, which means the results are not reproducible. The demo defines a custom random-number generator that uses the Lehmer algorithm (which, you’ll recall, is sometimes called the Park-Miller algorithm). The code for the custom random-number generator is:
SetSeed = function(seed) {
if (seed <= 0) {
alert('Bad seed');
}
function ParkMiller() {
var hi = Math.floor(seed / 127773);
var lo = seed % 127773;
seed = (16807 * lo) - (2836 * hi); // global
if (seed <= 0) {
seed += 2147483647;
}
return seed / 2147483647;
}
for (var i = 0; i < 20; ++i) {
var dummy = ParkMiller();
}
return ParkMiller;
}
Notice that the function is a declaration (rather than a definition) with a nested function definition that is returned. The code is rather subtle, and you can find a link to more information about the algorithm at the end of this section.
The random-number generator is called by a program-defined function MakeLocations() that is defined:
function MakeLocs(n, bounds, sd)
{
Math.myRandom = SetSeed(sd);
var latHi = bounds.getNorth();
var latLo = bounds.getSouth();
var lonHi = bounds.getEast();
var lonLo = bounds.getWest();
. . .
The function accepts the number of Location objects to generate as n, a Maps Bounds object as bounds, and a random-number seed value as sd. The random-number generator is created as Math.myRandom by using the interesting JavaScript technique of assigning a new member to an existing class on the fly.
The built-in getNorth() and getSouth() functions return the top and bottom latitude values of the associated bounds object. And the getEast() and getWest() functions return the right and left longitude values. To make 100 random locations within the current map area, using a random seed value of 19, the function could be called this way:
var locs = MakeLocs(100, map.getBounds(), 19);
The code for MakeLocations() concludes with:
. . .
var result = [];
for (var i = 0; i < n; ++i) {
var lat = (latHi - latLo) * Math.myRandom() + latLo;
var lon = (lonHi - lonLo) * Math.myRandom() + lonLo;
var loc = new Microsoft.Maps.Location(lat, lon);
result.push(loc);
}
return result;
}
The Math.myRansom() function returns a pseudorandom value between 0.0 and 1.0. The code idiom to return a value between arbitrary values A and B is (A-B) * Math.myRandom() + B.
The Button1_Click() function creates random-location pushpins and associates the mouseover and mouseout events with functions ShowInfobox() and HideInfobox():
function ShowInfobox(e)
{
var loc = e.target.getLocation();
infobox.setLocation(loc);
infobox.setOptions({
visible: true, offset: new Microsoft.Maps.Point(2, 2),
htmlContent: ibTemplate.replace('{title}',
'I am a ' + e.targetType + ' at').replace('{description}',
LatLonStr(loc)) });
}
With custom Infobox objects, the showCloseButton option property is ignored, which is disadvantageous. Because Infobox objects have no click handlers, it’s hard to get rid of a visible Infobox and, in many situations, using the mouseout event to set the visible property to false is a good method. For example:
Microsoft.Maps.Events.addHandler(pp, 'mouseout', HideInfobox);
. . .
function HideInfobox(e)
{
infobox.setOptions({ visible: false });
}
In summary, in order to create custom-styled Infobox objects, you define a template CSS string and use the JavaScript string-replace function to provide specific title and description content. You can create reproducible pseudorandom Location objects by writing a custom function that uses the Lehmer (or Park-Miller) algorithm.
Resources
For detailed information about the InfoboxOptions class, see:
https://msdn.microsoft.com/en-us/library/mt712658.aspx.
For advanced examples of custom Infobox objects, see:
https://msdn.microsoft.com/en-us/library/mt750644.aspx.
For additional information about the Lehmer random-number algorithm, see:
https://en.wikipedia.org/wiki/Lehmer_random_number_generator.
For a famous article about random-number generators, search the Internet for:
“Random Number Generators: Good Ones are Hard to Find,” 1988, Park and Miller.
- 1800+ high-performance UI components.
- Includes popular controls such as Grid, Chart, Scheduler, and more.
- 24x5 unlimited support by developers.