
AutoCAD Succinctly®

CHAPTER 2
Speaking AutoCAD
AutoCAD geometries consist of graphic entities used create your drawings, but before we start creating some, you first need to understand how to input coordinates in AutoCAD.
AutoCAD coordinate systems
All AutoCAD products consist of a three-dimensional (3D) coordinate system based on x, y, and z coordinates. When you start a blank drawing based on a standard template rather than 3D templates (acad3D.dwt and acadiso3D.dwt), you start with a top view, and you are only able to see the x and y axis of the user coordinate system (UCS).
This book covers only creating and editing two-dimensional (2D) geometries, assuming the z value of the coordinate system as zero.
Note: AutoCAD LT can open 3D models created on other versions of AutoCAD, but it is unable to create or edit 3D geometries, and doesn’t allow advanced customizations.
When you start a new drawing, the coordinate system is actually the World Coordinate System (WCS), and it only should be called UCS after any changes of direction, the x, y, or z axis, or the origin point location.
The WCS contains a small square at the origin point, while UCS does not (see Figure 18).
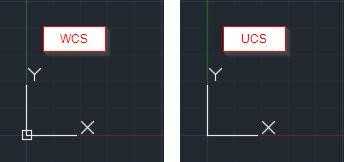
Figure 18: WCS and UCS
For simplification purposes, we will refer to the AutoCAD coordinate system simply as UCS.
You can change the UCS location just by clicking on it and dragging the desired node to the proper location or angle, if selecting one of the axis ends.
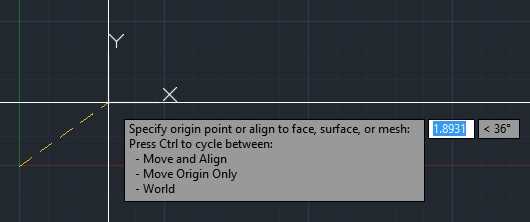
Figure 19: Moving the UCS Origin
If you hover the blue squares, called grips, a menu pops up displaying the possible edit options for the referent node. Figure 20 shows the quick menu for the UCS origin point. Click World to return to the UCS to World Coordinate System.
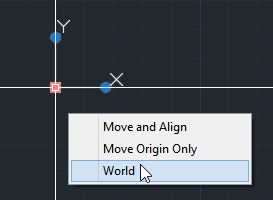
Figure 20: UCS Quick Menu at origin point
Drawing limits
The drawing limits are represented by an invisible rectangular boundary in the drawing area. It does not define the area where you are allowed to drawn unless you turn drawing limits on. Typically, the drawing limits should be the extension of the paper size multiplied by the scale. For example, if your drawing is intended to be plotted at 1:10 scale and the paper size is 420mm x 297mm, your drawing limits could be from (0,0) to (4200,2970). This is not required, and many users never set or change the drawing limits.
To set the drawing limits, enter LIMITS in the command window and press Enter. The following options are displayed:
- Lower left corner: Click or enter the lower-left corner for the drawing limits.
- Upper right corner: Click or enter the upper-left corner for the drawing limits.
- On: Turns limits on to avoid entering points or creating elements outside of the drawing limits.
- Off: Turns off limits, but the current set is saved, although not enforced.
Coordinate input
Now let us understand how you will tell AutoCAD where you would like to locate the points you need to enter. There are three methods of entering coordinates in AutoCAD:
- Absolute
- Relative
- Relative Polar
To simplify the display while you create geometric objects, press F12 to turn off dynamic input, or click the Dynamic Input icon on the status bar, as shown in Figure 21. A gray button at the status bar indicates that the variable is set as off.
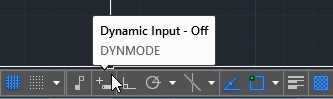
Figure 21: Dynamic Input Toggle
Tip: If you are working only with 2D objects, the z coordinate value may be omitted when entering coordinates, and it will set to the current elevation setting (0 by default).
Absolute coordinates: (x, y)
Absolute coordinates are measured from the origin of the current UCS. If you create a point at coordinate (50, 25), the point will be located 50 units to the right (x direction) of the UCS origin point, and 25 units above (y direction) the UCS origin point. You may enter any numeric value for coordinates and negative values; you locate the point to the left or below the origin point.
Relative coordinates: @x,y
Relative coordinates are measured from the last point you entered. The @ symbol means “last point” or “from last point.”
Relative polar coordinates: @distance<angle
On relative polar coordinates, you enter the distance (or length) and the direction (angle) to the next point, starting from the last point entered. Remember that by default, angles are measured counterclockwise in degrees. Negative angles you enter will rotate clockwise.
Other input methods
You may also quickly enter points by simply clicking at the location in the drawing area. You can also create line segments by placing the crosshair cursor to the direction you are willing to create the segment, and entering the distance value. This is very useful in combination with ORTHO and POLAR TRACKING, which help you to restrict angle directions.
To illustrate using ORTHO, first we need to make sure to restrict the cursor orthogonally.
To do so, press the F8 key, or click on the button on the status bar, as shown in the following figure (remember blue is on, gray is off).
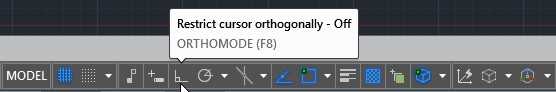
Figure 22: Toggle ORTHO
Now just follow these steps:
- Type L and press Enter or the Spacebar to start the LINE command.
- Click a point on the screen.
- Move the mouse above the drawing area, making sure that you have a vertical line. Type 10 and press Enter or the Spacebar.
- Move the mouse to the right, making sure that you have a horizontal line. Type 10 and press Enter or the Spacebar.
- Move the mouse below, making sure that you have vertical line. Type 10 and press Enter or the Spacebar.
- Type C and press Enter or the Spacebar to close the rectangle and end the command.
Similar to orthographic restriction, which limits to the x and y directions of the UCS, you can use Polar Tracking. To turn on Polar Tracking, press the F10 key or click on the Polar Tracking toggle button, as show in Figure 23 (remember blue is on, gray is off).
![]()
Figure 23: Polar Tracking Toggle
With Polar Tracking, you can pick other angle increments for restriction and even add custom angles. Just click on the small down arrow next to the button to show a list of default increment tracking angles, as you can see in Figure 24, and make your selection.
![]()
Figure 24: Polar Tracking Settings
When you start creating lines with Polar Tracking on, a box with the distance and angle as well as a dashed green line shows the direction at the increment you choose. You can now enter distance just as you did with orthographic restrictions.
![]()
Figure 25: Polar Tracking in Action
Drawing navigation
As your drawing grows, you need to navigate the drawing in order to zoom into drawing areas or pan to other locations. Besides the mouse navigation features discussed in Chapter 1, AutoCAD shows, by default on the upper-right side of the drawing area, a Navigation Bar where you can find almost all of the drawing navigation tools (see Figure 26).
![]()
Figure 26: Navigation Bar
Zoom command
The mouse wheel is limited to zoom in and out the drawing, while the Zoom command provides more advanced methods. You can execute the Zoom command from the command window by typing ZOOM, or simply Z, and pressing Enter, as shown on Figure 27, or from the Navigation Bar, as shown on Figure 28.
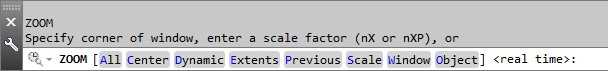
Figure 27: Zoom Command Prompt
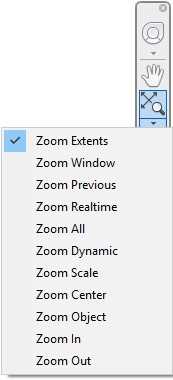
Figure 28: Zoom Command in the Navigation Bar
- Zoom All: Zooms to the extension of the drawing or drawing limits, whichever is larger.
- Zoom Center: Zooms by setting a selected point to the center of the screen and at a magnification level. The larger the magnification level the smaller the drawing will appear on screen.
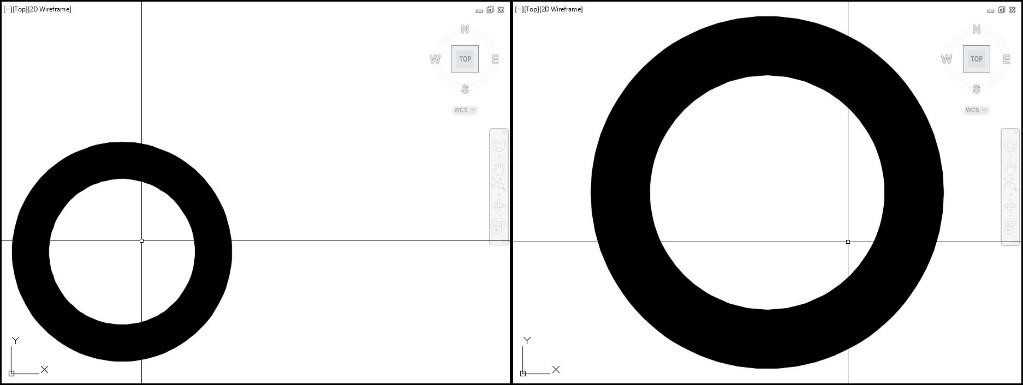
Figure 29: Before and After Zoom Center
- Zoom Dynamic: Zoom and pan the drawing using a rectangular view box that can be shrunk or enlarged and moved over the drawing.
- To change the size of the view box, click, move the mouse to resize it, and click one more times to set the new size of the view box.
- To pan with the view box, hover it over the desired area and press Enter.
- Zoom Extents: Zooms to the extension of all objects in the drawing, independent of limits.
- Zoom Previous: Restores the previous views, to a maximum of 10 previous views.
- Zoom Scale: Changes the zoom magnification by a scale factor. The scale factor is a positive, non-zero number, where 1 is the current magnification level, followed by X, to scale relative to the current view, or XP, to scale relative to paper space units. For example, entering .5x makes the object look half the size relative to the current size of the screen.
- Zoom Window: Zooms to a specified rectangular area. This is the default method when running from the command window. Click any two corners to define the new display window.
- Zoom Object: Zooms to one or more selected objects in order to fill the screen.
- Zoom Real Time: Works similar as the mouse wheel button, but with the mouse left-button. Left-clicking and dragging up increases the zoom level, while dragging down decreases. Press Enter or Esc to exit the command.
Drawing organization
Properties
Every object created in AutoCAD has a set of properties. Some properties are common to all objects; others are exclusive to the object type. For example, a circle has the center point coordinates and radius, while a line has start point and end point coordinates (see Figure 31).
The common properties, called General Properties, are as follows:
Color
Object color is a very important property because it is easily used to identify objects in the drawing. There are 255 different colors in the AutoCAD color palette, but you can also use True Color or Color Books. The AutoCAD color palette allows you to control the appearance of the object when printed, if the drawing is set as color-dependent plot styles, which is how the acad.dwt template is set. This book covers only color-dependent plot styles.
When you call a command to select a color, AutoCAD displays the Color Dialog Box, as shown in Figure 30.
The top two large color palettes of the AutoCAD Color Index (ACI) are numbered from 10 to 249. The top palette contains even numbers, while the lower palette contains odd numbers.
The mid-colored palette shows colors from 1 to 9 where colors 1 to 7 are also named as red, yellow, green, cyan, blue, magenta, and white. The white color may show as black, depending of the drawing area background color.
The lowest palette shows shades of gray numbered from 250 to 255.
The buttons ByLayer and ByBlock set the object color to inherit the color from the layer or block it is associated with. These buttons are not available when selecting colors for layers.
The color text box allows you to enter the color index number or name.
The color swath, the two squares to the left of the dialog box, show the selected color and the previous color, where the currently selected color overlaps the previously selected color.
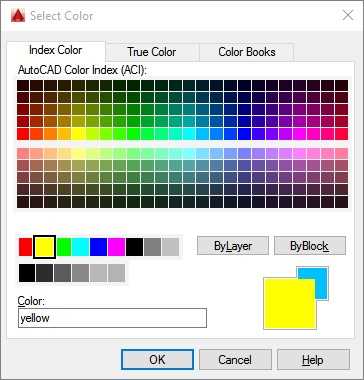
Figure 30: Color Dialog Box
Layer: The layer on which the object is set. You are going to learn more about layers soon.
Linetype: The look of the line, such as continuous, dashed, center, etc.
Linetype scale: This multiplier changes the density of the line style.
Line weight: Controls how bold the object appears on screen. This does not affect the how it prints unless you specify so.
Transparency: Sets the visibility of the element in the drawing. Very useful to simulate shaded areas such as shadow.
Thickness: Defines the height of the object, like an extrusion or a wall. This have no effect when the drawing is in the Top view.
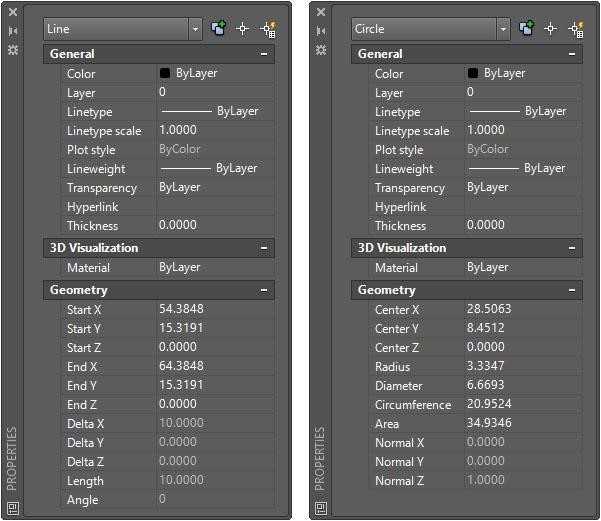
Figure 31: Properties Palette showing Line Properties and Circle Properties
Note that in Figure 31, some General properties are set as ByLayer. This means that the object will inherit the properties defined in the layers on which it is set.
Object properties may be quickly edited from the Properties Panel located in the Home tab (Figure 33). You should set the object to inherit layer properties whenever is possible in order to keep your drawing visually manageable.
From the Properties tab, you can change objects’ color, line weight, line style, and transparency. You can also match the properties of a selected to object to other objects. Finally, the list command shows a list of all selected objects and their geometric properties.
The following figure shows details of three selected objects: Circle, Polyline (listed as LWPOLYLINE), and a line.
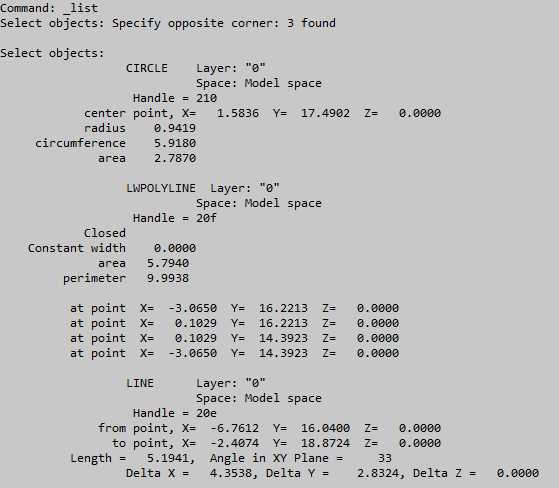
Figure 32: List Command
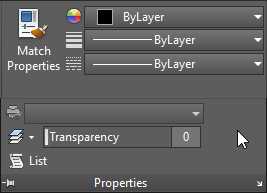
Figure 33: Object Properties Panel
Layers
Layers are the most important method for organizing the objects in a drawing. Layers make your drawing easier to view and can improve performance by simply hiding all objects you do not need to see for a moment.
Imagine each layer as a transparent sheet where you draw some walls, for example. Then you add another transparent sheet on top where you draw the windows, another transparent sheet for notes, another for dimensions, and so on. At any time, you can simply remove one or more sheets and put it back when needed.
Creating Layers
Open AutoCAD and start a new drawing based on the acad.dwt template, if you have not yet done so.
To create layers, click the Layer Properties tool in the Layers panel (Figure 32). This opens the Layer Properties Manager palette.
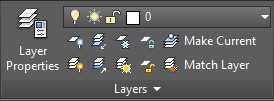
Figure 34: Ribbon Layer Panel
Click the New Layer button shown in Figure 35. A new layer, named Layer1, is created and ready to be renamed. Type Walls and press Enter.
Click on the layer color to open the Select Color dialog and click the magenta color in the second color palette.
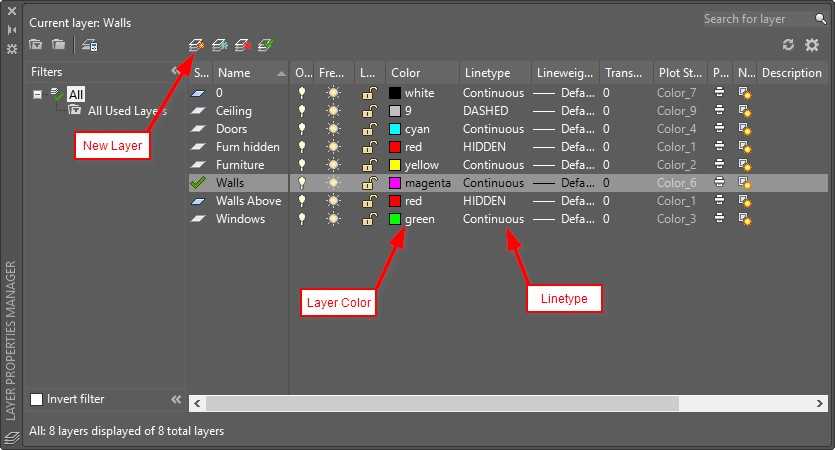
Figure 35: Properties Manager
Repeat the previous step to create a layer named Walls Above with the color red. Click on the Linetype, currently set as Continuous, to open the Select Linetype dialog box (see Figure 36). Click Load… to show the Load or Reload Linetypes dialog box. Scroll through the Available Linetypes to select DASHED and HIDDEN. Use Ctrl+click to select multiple options. Click OK to load the selected Linetypes and close the dialog box. The two selected Linetypes are loaded and listed in the Select Linetype dialog box. Select HIDDEN and click OK to close the dialog box.
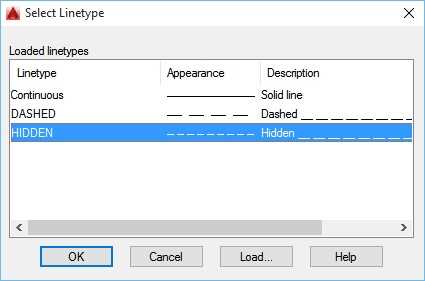
Figure 36: Select Linetype dialog
Create additional layers as follows:
Layer name | Color | Linetype |
Ceiling | 9 | DASHED |
Doors | cyan | Continuous |
Furn hidden | red | HIDDEN |
Furniture | yellow | Continuous |
Walls | magenta | Continuous |
Walls Above | red | HIDDEN |
Windows | green | Continuous |
Double-click the Wall layer to make it the current layer.
Tip: Layers are the most effective and productive way to organize your drawing and enforce drawing standards. I recommend that you avoid changing object level properties, such as colors and linetypes, because you may lose control of your design as your drawing gets bigger.
Drawing templates
When you start a new drawing, it is created from a drawing template that can be either a default drawing template file, such as the one you used to create the drawing in Chapter 1, or a template file that you create with the settings and data of your choice
When you save this information as a drawing template file, you can start creating drawings without having to recreate or reconfigure any settings. Some of the settings you can define in a drawing template are:
- Drawing Units
- Settings
- Layers and layer properties
- Linetypes
- Dimension styles
- Text styles
- Annotation Scales
- Layouts
- Plot and publishing settings
Create a template file
To save the drawing template, proceed with the following steps:
- Click on the Menu Browser on the top-left corner of the AutoCAD window.
- Move the mouse over the Save As menu item and hold until the panel Save a copy of the drawing expands, or click on the arrow to the right of the Save As menu.
- Click on Drawing Template, as shown in Figure 37.
- The Save Drawing As dialog box opens at the default template folder selected.
- Enter ACAD Succinctly in the File name field.
- Click Save.
- A dialog box opens so you can enter optional additional information about the template. In the description box, enter Base template for the AutoCAD Succinctly book and Click OK.
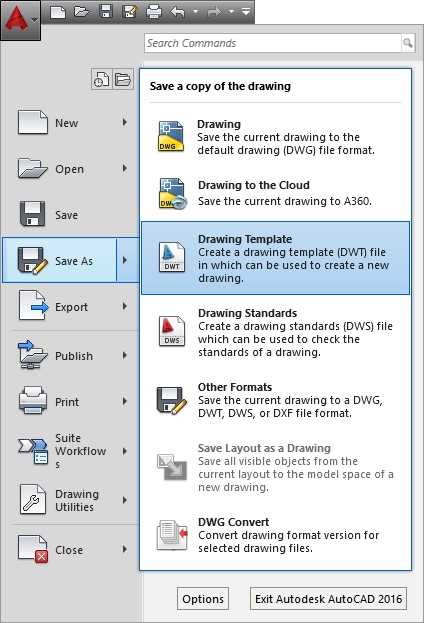
Figure 37: Save Drawing Template
You can now close the template file by clicking the X button in the drawing tab, as shown in Figure 38.
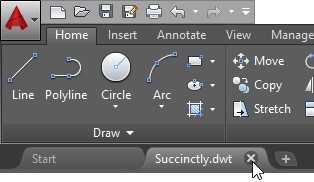
Figure 38: Close the drawing
- 1800+ high-performance UI components.
- Includes popular controls such as Grid, Chart, Scheduler, and more.
- 24x5 unlimited support by developers.