
AutoCAD Succinctly®

CHAPTER 7
Publishing the Drawing
In this chapter, you will learn how to prepare your drawing for plotting for client review or production.
Everything you have created so far was done in Model Space. When thinking about plotting and printing, you should work in Paper Space. Although you can print the drawing from Model Space, Paper Space layout is the correct space to create your sheets for printing.
Plotting
The plotting process in Model Space and Paper Space is the same. Click the Plot ![]() tool located in the Quick Access bar, or press Ctrl+P to show the Plot dialog box:
tool located in the Quick Access bar, or press Ctrl+P to show the Plot dialog box:
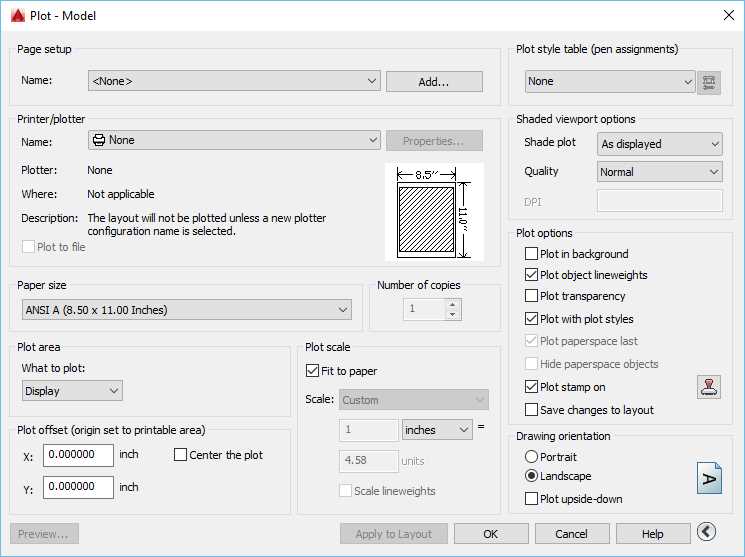
You can plot using the printer configured in the operating system or AutoCAD Printer Configuration (PC3) files.
In the Printer/Plotter list, you can differentiate System Printers and PC3 files by:
![]() Denotes a System printer
Denotes a System printer
![]() Denotes a PC3 printer
Denotes a PC3 printer
PC3 files allow you to custom configure a plotter or printer and save the setting (to a pc3 file) to use later, even in other drawings. The same plotter or printer can have many different configurations, according to your needs. For example, you may create a PC3 file with the sole purpose to plot vector graphics, and another to plot graphic images.
To plot you drawing from paper space, follow these steps:
- In the Printer/plotter area, select
 DWG to PDF.pc3.
 - In the Paper size, select ANSI B (17.00 X 11.00 Inches)
- In the Plot area, select Extents
- In the Plot offset area, check Center the plot
- In the Plot scale:
- Uncheck Fit to paper
- Select 6” = 1’-0” in the Scale list. Note that this is the same scale as the Annotation Scale.
Note: It is not required that you match plot scale and annotation scale, but if they are not the same, the resulting plotted annotations may be smaller or bigger than you planned.
In the two fields below the Scale list, you can enter a custom scale. For the selected scale (6” = 1’-0”), it shows 6 inches = 12 units (12” is equals to 1’-0”). Entering 1 and 2 to the respective fields will result the same scale, but is denoted as custom.
Internally, AutoCAD is unitless; the plotting scale says 6 inches (paper units) is equal to 12 drawing units, meaning that every six inches measured in the paper document is equivalent to 12 inches in the real world.
- If the Plot dialog box is not showing all options, click the More Options button
 located in lower-right corner of the dialog box.
 - In the Plot style table (pen assignments) area, choose monochrome.ctb.
- Select No in the question about assigning this plot style to all layouts.
- In the Plot options:
- Plot in background: Unchecked
- Plot object lineweights: Checked
- Plot transparency: Unchecked
- Plot with plot styles: Checked
- Plot stamp: Unchecked
- Save changes to layout: Unchecked
- Drawing orientation: Landscape
- Click Apply to Layout to allow reusing this setting on any model space plot.
- Click OK to plot.
- Browse to the location where you want to save the PDF. By default, AutoCAD names the PDF as the drawing name suffixed with the layout name. Enter Column Base-Model_1.pdf for the file name.
- Click Save.
- Assuming you have a PDF reader in your computer, the plotted PDF opens when the plot is completed.
Tip: AutoCAD saves layer information when plotting to PDF. You can turn the layers off in the PDF Reader.
The plot came out okay, but all of the lines, although black because of the settings in the monochrome.ctb file, have the same lineweight. To correct that, we are going to create a new Plot Style Table.
Plot styles
Plot Style Tables are color mapping configurations where you can define how each AutoCAD Color Index is to be plotted. You can have as many plot styles as you need, for many different purposes and settings. We are going to create a plot style to better suite our needs:
- Click the plot or press Ctrl+P to show the Plot dialog box.
- Make sure that the plot parameters are the same as the last plot. If they are not, select <Previous plot> in the Page Setup Name.
- In the Plot style (pen assignments) list, select New.
- Select Start from scratch in the Add Color-Dependent Plot Style Table and click Next.
- Enter Succinctly in the File name field and click Next.
- Check Use this plot style table for the current drawing and uncheck Use this plot style for new and pre-AutoCAD drawings.
- Click Plot Style Table Editor.
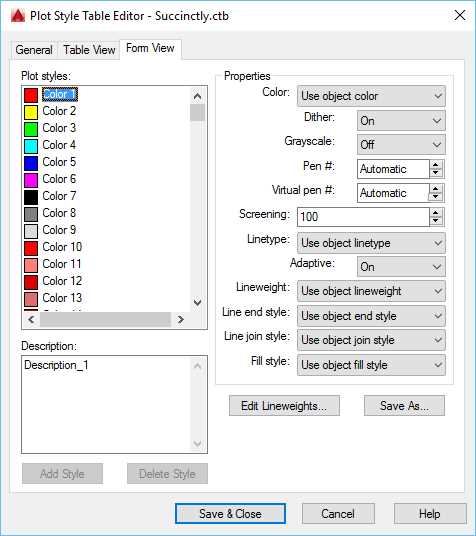
Figure 116: Plot Style Table Editor
- Activate the Form View tab, if not activated.
- In the Plot styles list, select Color 1, press and hold Shift, and select Color 9 to select the range.
- In the Properties panel, select Black in the color list.
- In the Plot styles list, select Color 1.
- In the Properties panel, select 0.1000 mm in the Lineweight list.
- Proceed with the remaining colors:
- Color 2: 0.2000 mm
- Color 3: 0.3000 mm
- Color 4: 0.4000 mm
- Color 5: 0.5000 mm
- Color 6: 0.8000 mm
- Color 7: 1.000 mm
- Select Color 8:
- Screening: 70 (70% gray)
- Lineweight: 0.1500 mm
- Select Color 9:
- Screening: 50
- Lineweight: 0.1500 mm
- Click Save & Close.
- Click Finish.
- Click Apply to Layout and then click OK to plot.
- Save the file as Column Base-Model_2.pdf.
- The plot now has different line weights.
- Save your drawing.
Plot styles are saved as a separate file, and are available for use on any drawing after they are created.
Layouts
Layouts are 2D sheet layout environments where you define the paper size, create multiple views (viewports) of the drawing, and add a title block and other notes. Each drawing viewport may have a different scale, view direction, and visual style, and you can define which layers are to be hidden and even assign different layer colors.
To activate a layout, move the mouse over the Drawing tab and pause until the layout thumbs are displayed, as in the following figure:
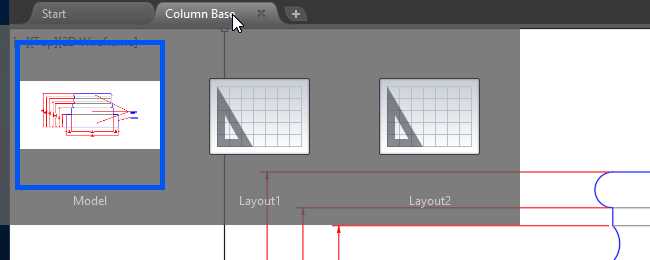
Figure 117: Activate Layouts from Drawing Tab
Alternatively, you can activate a layout by selecting it from the Layout tab located at the bottom of the drawing area:
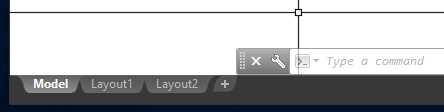
Figure 118: Layout Tabs
Tip: You can control Drawing File tabs’ and Layout tabs’ visibility from the Options dialog box, Display tab. To open the Options dialog box, type OP in the command window and press Enter.
Let’s configure a plot layout:
- Let’s continue with the Column Base drawing that you worked in the Plot Styles section in this chapter.
- Activate the Layout1 layout.
When you activate a layout, the Layout panel is added to the ribbon, from where you can create new layouts and viewports:
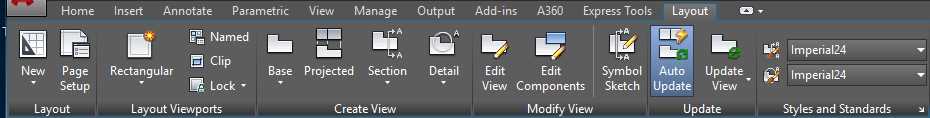
Figure 119: Layout Tab
- Right-click the Layout1 tab and select Rename from the contextual menu.
- Type D-101 and press Enter.
- Click the Page Setup tool in the Layout panel of the Layout tab.
- In the Page setups list, select *D-101* and click Modify to show the Page Setup dialog box, which is similar to the Plot dialog box.
- In the Page Setup dialog box:
- Set the Printer/Plotter Name to DWG To PDF.pc3.
- Set the Paper size to ANSI B (17.00 X 11.00 Inches).
- Set What to plot to Layout.
- Set Scale to 1:1 (this is the default scale when plotting layouts)
- Set Plot style table (pen assignments) to Succinctly.ctb.
- Click OK to apply the changes and close the dialog box.
- Click Apply to Layout, then click Cancel to close the dialog box without plotting.
- Click Close to close the Page Setup Manager dialog box.
Viewports
A viewport works like a window to the model. You may have several viewports in each layout, each with different scale and layer visibility. When working with 3D objects, a viewport can be set to display a shaded or more realistic visual style, among other options.
Whenever you create a new layout, a viewport is included to the layout zoomed to the extents of the drawing (Figure 120). In order to adjust the scale or edit the drawing, double-click in the viewport.
Before making viewport adjustments, let’s add a title block to our sheet:
- Create a new layer named A-Anno-Title, color green, and make this the active layer.
- In the Block panel, click Insert and then More options.
- In the Insert dialog box, click Browse…
- Navigate to the Chapter 07 folder, select the Title Block 11x17 drawing, and click Open.
- Make sure to uncheck the Specify On-screen for Insertion point, Scale, and Rotation.
- Click OK to insert the title block.
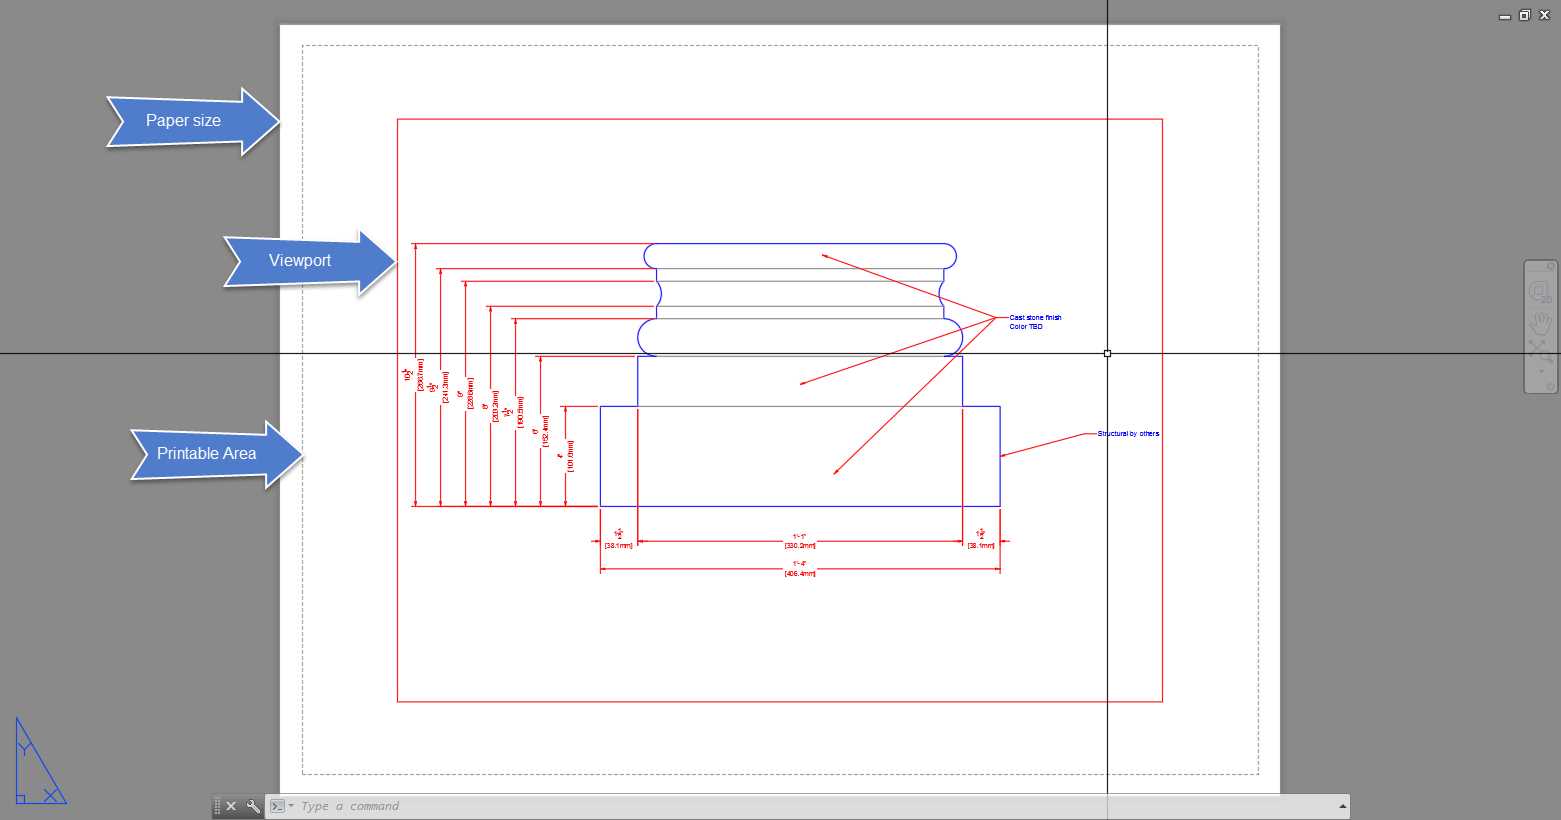
Figure 120: Paper Space Layout
With the Title Block in place, we can now adjust the viewport. One thing I like to do is assign viewports to non-plot layers so that the viewport borders are not shown in the output:
- Select the Viewport by clicking on one of its edges.
- From the Layers panel in the Home tab, select Defpoints from the Layers list. Defpoints a non-plot layer automatically created whenever dimensioning.
- Drag the grips to adjust the viewport to best fit in the title block.
- Double-click in the viewport to activate it; alternatively, you can type MS in the command window followed by Enter or Spacebar.
- Now you can pan and zoom within the viewport, and also edit objects as you normally would.
- Zoom to Extents to fit the drawing in the viewport.
- From the Annotation Scale (in the Status bar), select 3” = 1’-0” to set the viewport scale. Note that the dimensions disappeared from the viewport. This is because the dimensions are associated to the 6” = 1’-0” scale.
- Select the 6” = 1’-0” scale from the annotative scale list.The dimensions are showing, but some notes and dimensions are cropped.
- From the Navigation Bar, floating to the right of the viewport, click Pan (the hand icon).
- While holding the Shift key, click and the drag the mouse to the left until you can see all dimensions. Press Enter, Spacebar, or Esc to finish the command.
- In the Status Bar, click the Maximize Viewport button shown in the following figure:
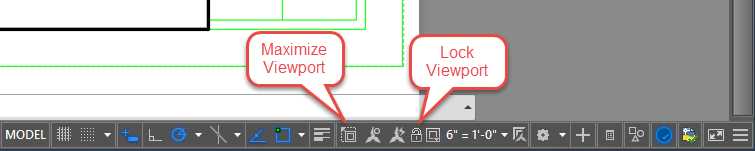
Figure 121: Lock and Maximize Buttons in the Status Bar
- Select the multileader that needs to be stretched, and select the grip in the middle and move closer to the drawing.
- Double-click the text to edit, move the cursor to the end of the “Structural” word, and press Enter. Press Delete to remove the space before the letter “b” and click outside of the text box to apply the changes, or press Ctrl+Enter.
- Click Maximize Viewport to return to the layout.
- Select the viewport by clicking on any of its borders and click the Lock Viewport button (see Figure 121). This locks the viewport scale, and the annotative scale cannot be changed until you unlock the viewport.
Tip: If you cannot select the viewport because the borders are overlapped by the title block, position the cross arrow on top of the overlapping edge, press Ctrl+Space to cycle between objects, and click when the desired object is highlighted.
- Double-click in the viewport to activate it. Zoom and pan randomly. The whole layout now is affected because the viewport scale is locked.
- Plot the layout as you have done previously.
- Save and close your drawing.
Freeze layers in a viewport
You can select layers to be frozen for each viewport without affecting each other or the model:
- Open the Residence drawing located in the Chapter 07 folder.
- The drawing opens with the A-101 layout active. Double-click in the viewport to activate the viewport.
- From the Home tab, Layers panel, click Layer Properties.
- In the left panel (Filters), expand the Xref group by clicking the tiny + sign to the left of the group name.
- Select Electrical to filter the layer list.
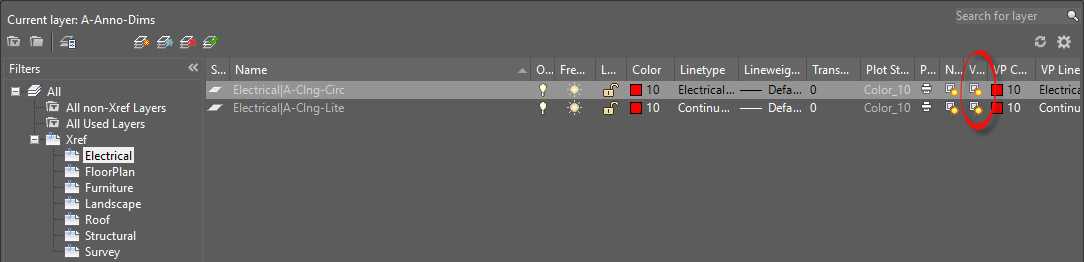
- Freeze all layers for the current layout by clicking on the VP Freeze (see the following figure) icon. You can widen the column by dragging the separator line in the column header.
- Repeat step 6 for the structural Xref. You may close or minimize the Layer Manager if needed.
- From the Layers panel, click Freeze
 .
. - Click the circular (green) symbols, doors and windows tags, and other layers that you find obstructive for this view. You can pan and zoom using the mouse wheel as needed, and press Enter, Spacebar, or Esc when done to finish the command.
- Plot the viewport.
- Save your drawing.
Chapter summary
In this chapter, you learned about preparing your drawing for distribution. You can distribute your drawing by generating hardcopies or Portable Digital Format (PDF) files. AutoCAD allows the user to generate other digital formats, such as DWF (Drawing Exchange Format) and image files (jpg, png, tiff, etc.). Independent of the output format you choose, it is critical to have standard plot styles to effectively manage output appearance, and also to make sure that the output is readable and is not showing elements that are not meant for the discipline.
AutoCAD provides outstanding tools to manage the drawing output that can increase productivity and also prevent misleading information from being distributed.
- 1800+ high-performance UI components.
- Includes popular controls such as Grid, Chart, Scheduler, and more.
- 24x5 unlimited support by developers.