
Application Insights Succinctly®

CHAPTER 3
The Dashboard
Once the Application Insights resource is available in the All resources blade, we can access all the information and configuration details available for the resource.
In this chapter, we will explore some interesting sections that will help us understand the fundamental concepts of Application Insights.
The instrumentation key
The first thing to explore is the INSTRUMENTATION KEY field, which is available on the Properties blade.
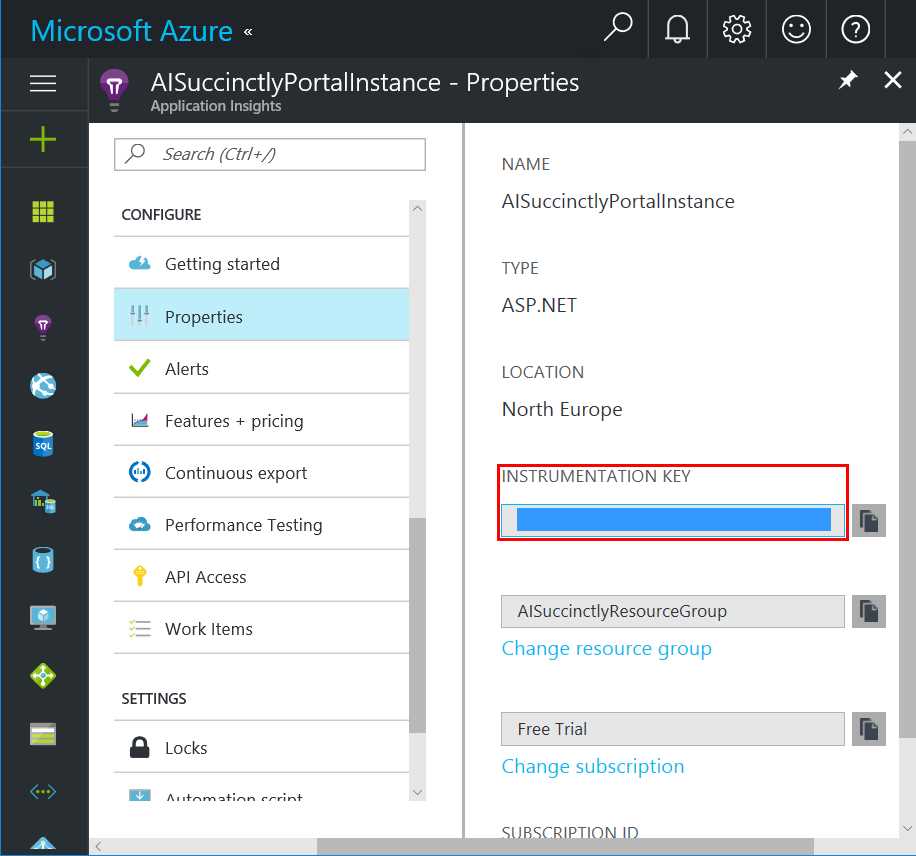
Figure 4: The Instrumentation Key
The instrumentation key is a GUID that identifies a resource in every web application we will use. It is generated automatically by Azure during the resource’s creation process.
Note: GUID is short for Globally Unique Identifier. It is a unique identifier that can be created in several ways, usually with a combination of a few unique OS settings or components, such as current IP address or network MAC address, clock date/time, etc.
When a resource has been created on the Azure portal, you need to copy the instrumentation key and paste it in the configuration of the web application that will use it. If the resource is created within Visual Studio during the creation of a web application, this step is not needed since the IDE will do this for us.
Getting started
In this section we will find a lot of information (and code) that is useful to integrate this resource into our application, both on the server side and the client side. This means you could use it on the server side to track the performance of the business logic, and you could use it on the client side to understand the usage of your web pages, regardless of the language used (this is very important).
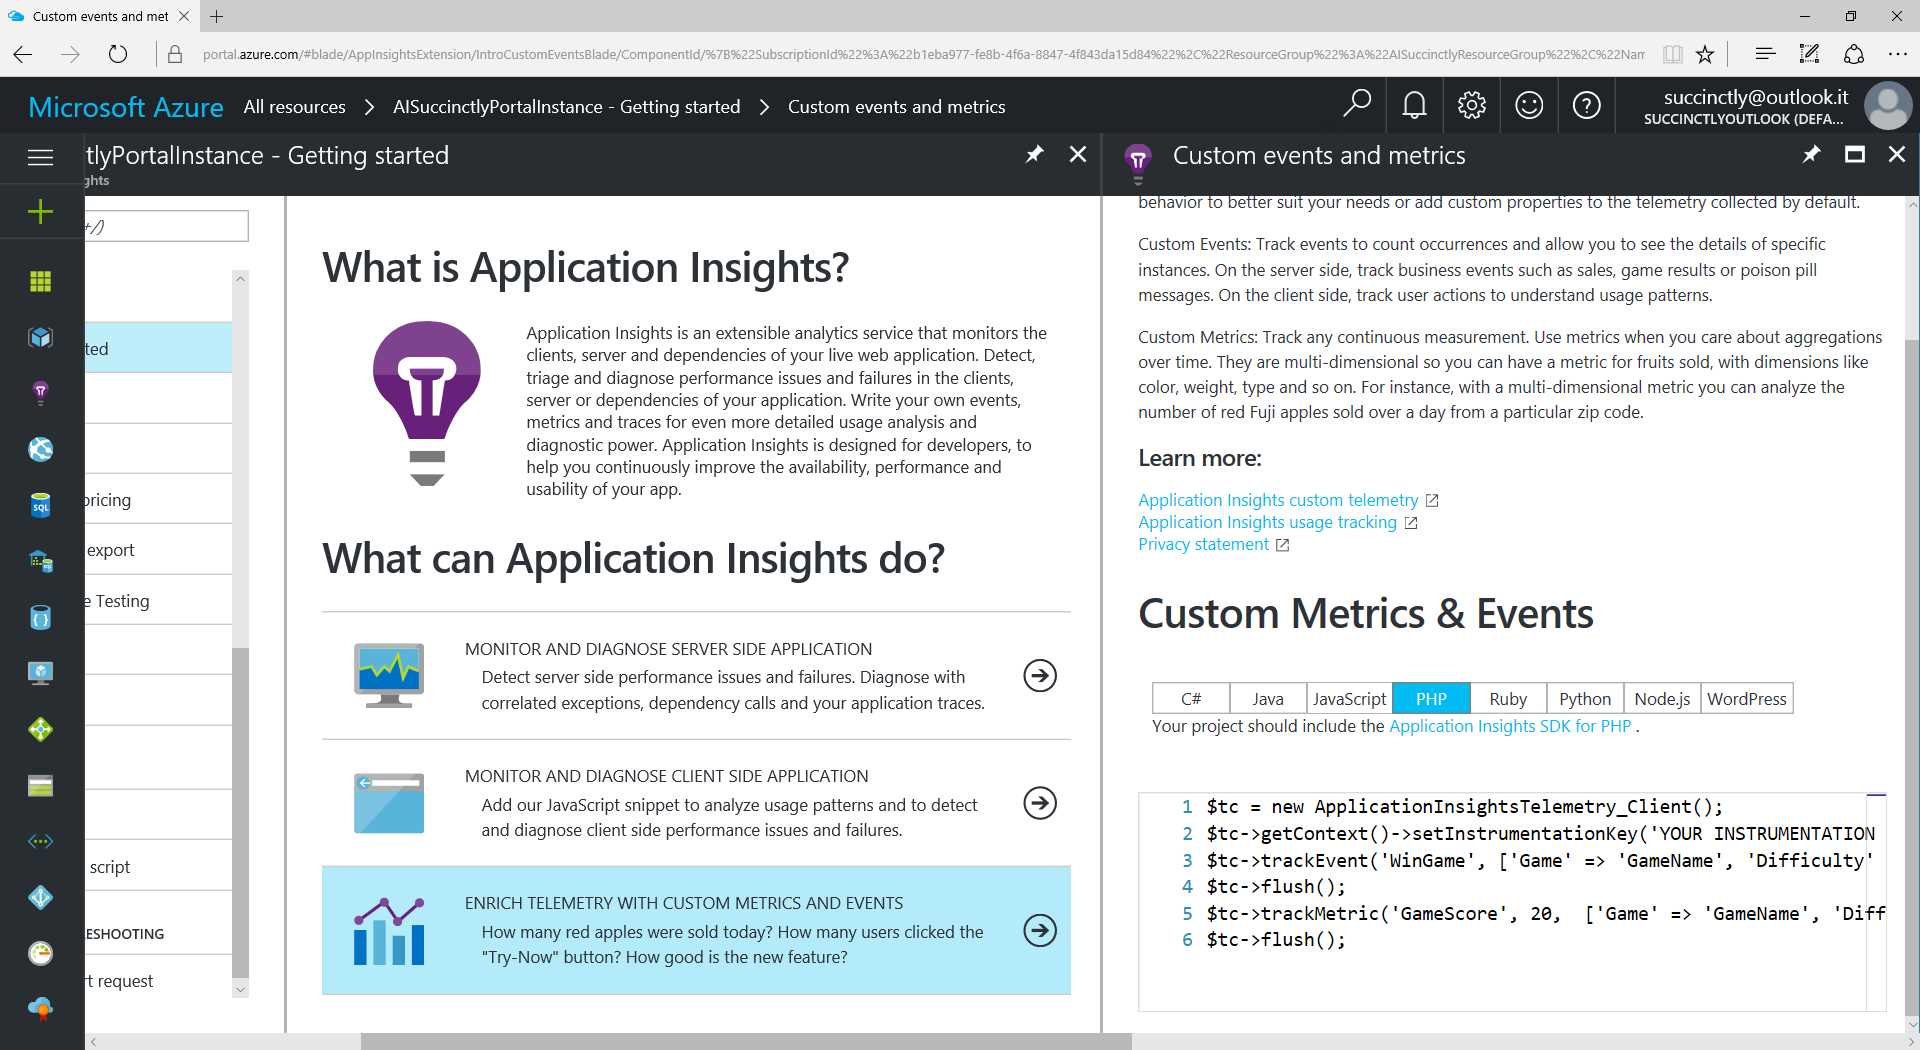
Figure 5: The Getting Started Section
For instance, if you want to use this resource in a PHP-based web application, here you can learn the basics of how to use it. There is the example code to copy, which represents the starting point for a newbie on Application Insights.
The Application map
The Application map is a visual feature that shows the dependency relationships between the components of a monitored web application.
In a brand new Application Insights resource, it will appear as a blank canvas. In a running environment, you will see something like this:
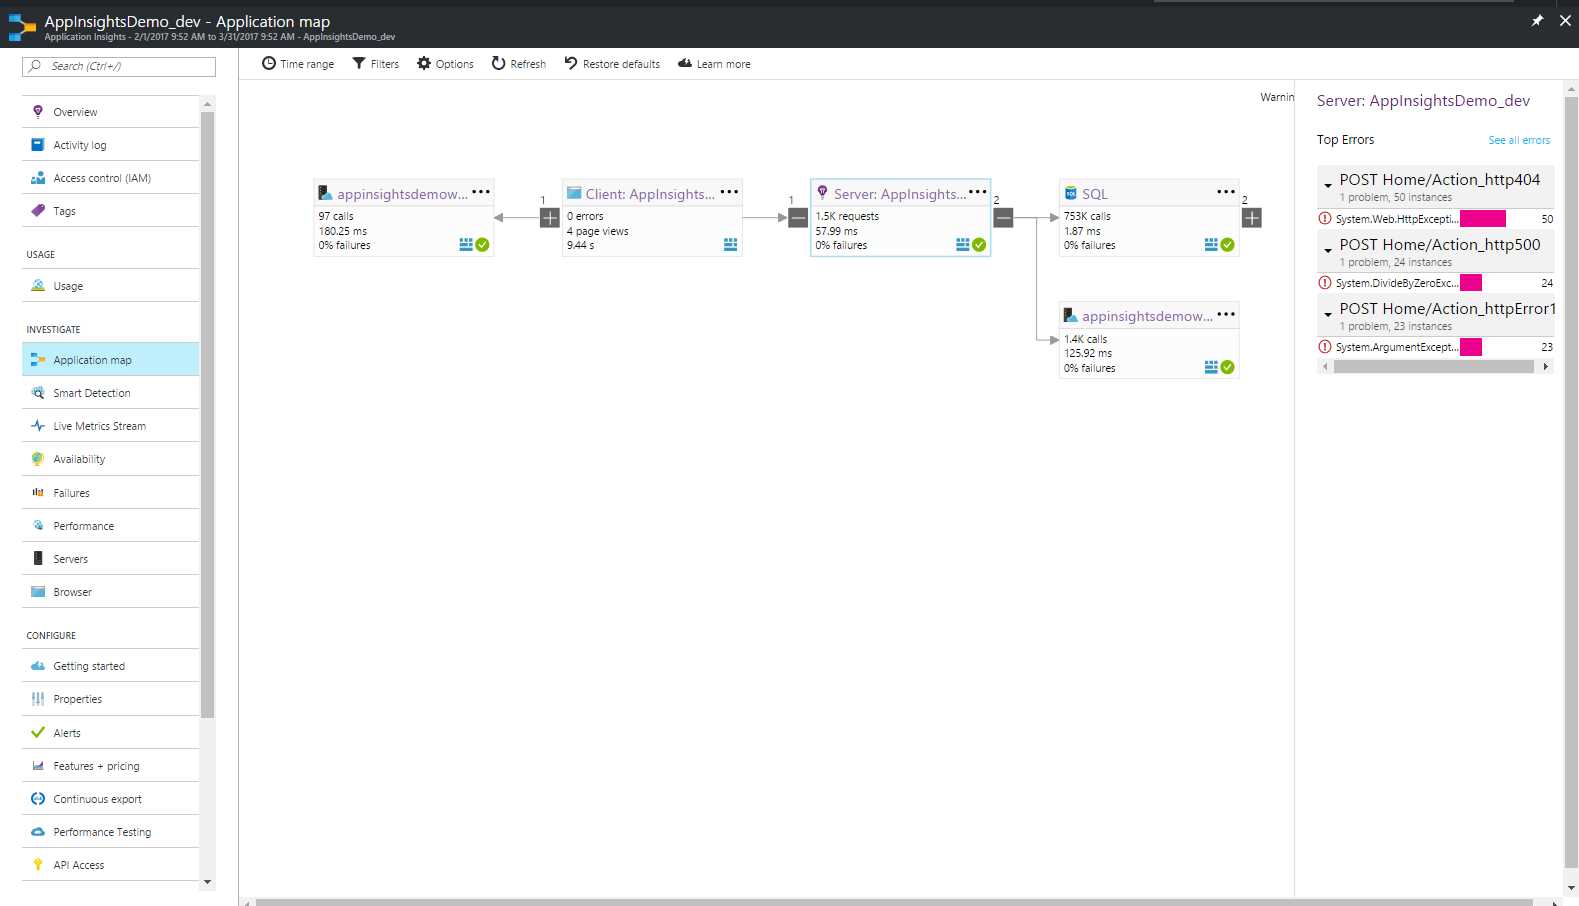
Figure 6: The Application Map Canvas
As you can see in Figure 6, we have the graph of the relationship in which we can find a SQL Server (on the right) and the hosted website (first item on the left).
Selecting one of the components, we can see the related items in a separate pane on the right (in Figure 6, these are requests), and we can choose items from the context menu (…) on every component to see a filtered set of information.
Another interesting thing to know is the time range filter, which allows us to see the part of the relationship defined for that given period (if it is available in the resource’s data, of course).
Note: Every now and then we can see this icon appearing somewhere on the screen. It is a direct link to a powerful feature that we will see in Chapter 10, Application Insights Analytics.
Live Metrics Stream
Another interesting feature within the Azure portal is the Live Metrics Stream—the name says it all.
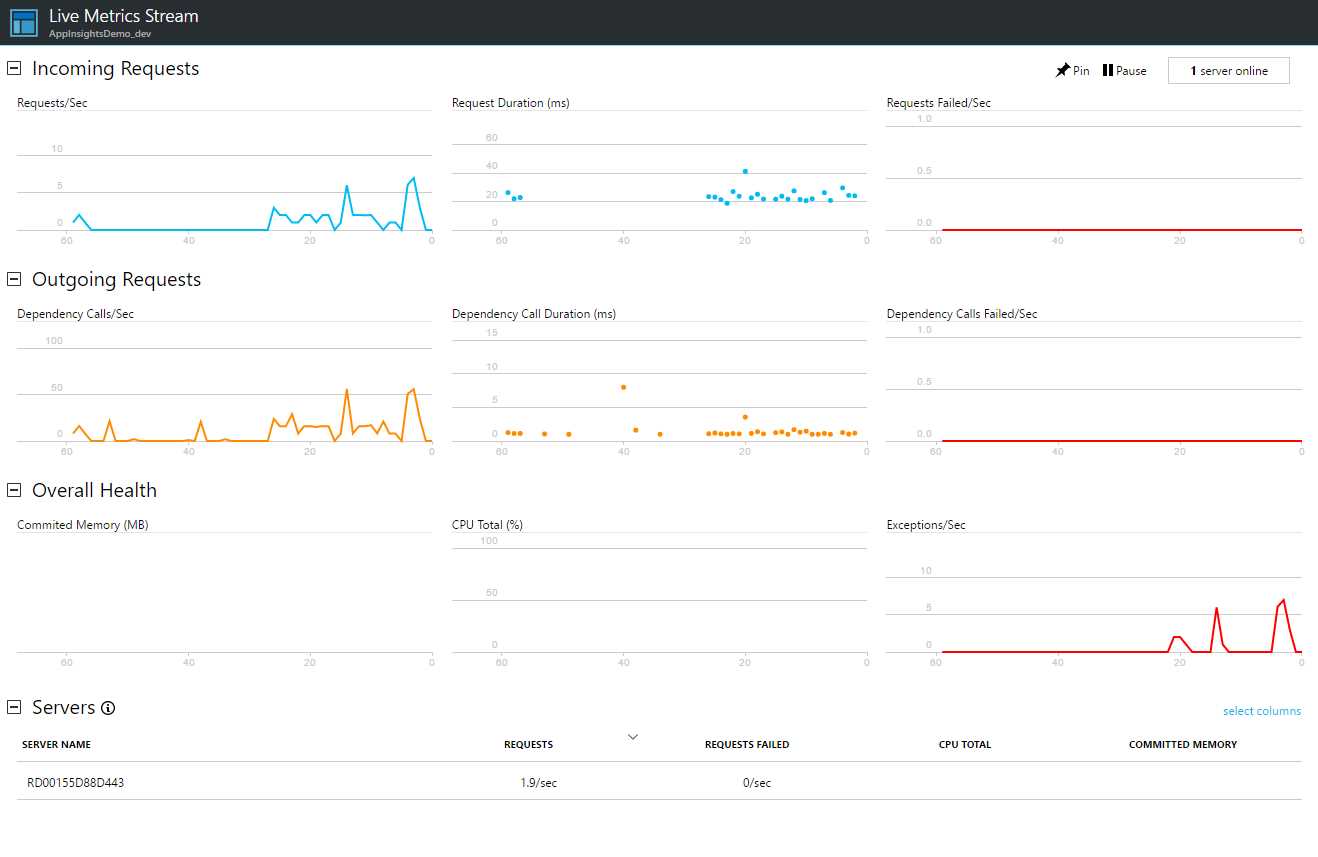
Figure 7: Live Metrics Stream
Like a heartbeat, the Live Metrics Stream will allow us to see what is happening in near-real time on the web application or service we are monitoring. It’s in “near-real time” because there is a minimal latency, around one second, but for its purpose, we can consider it a real-time monitor.
This feature can be handy if you are releasing a newer version of your web application in a production environment to apply a fix (e.g., for slow performance) and you want to understand immediately if this release is working as you expected.
Another example is if you are monitoring a specific moment of your web application, to understand how it is doing—for instance, in a live-event scenario where you would like to see a connected users counter. Another example is when you are verifying for repeated failures.
Note: When using the SDK version 2.4.0 or later, there will be additional filters on the right-hand side of the Live Metrics Stream panel for creating and using customized KPIs.
Keep in mind that this feature doesn’t provide search capabilities.
Now that you have seen a little more about the features available with your Application Insights resource, it’s time to take a look at metrics.
- 1800+ high-performance UI components.
- Includes popular controls such as Grid, Chart, Scheduler, and more.
- 24x5 unlimited support by developers.