
Application Insights Succinctly®

CHAPTER 4
Metrics Around Us
Every bit of information we gather from the web application or service that we are monitoring is called a metric. It may stand for a measured value or a count of some event or behavior related to that web application. Each metric could contain multiple bits of information, called data points.
In this chapter, we will dive into all the assorted flavors of metrics available within Application Insights.
Metrics Explorer
A metric, in the terminology of Application Insights, is the measurement of the performance or efficiency of the software being monitored, over one or more of its features.
One of the most impressive blades that we can use for an Application Insights resource is the Metrics Explorer. You can reach it from the Overview section by clicking the Metrics Explorer button.
What is the Metrics Explorer?
The Metrics Explorer might be the first place to land when you want to track for an exception or other data gathered about your web application. Here you can quickly find accurate information in a few clicks.
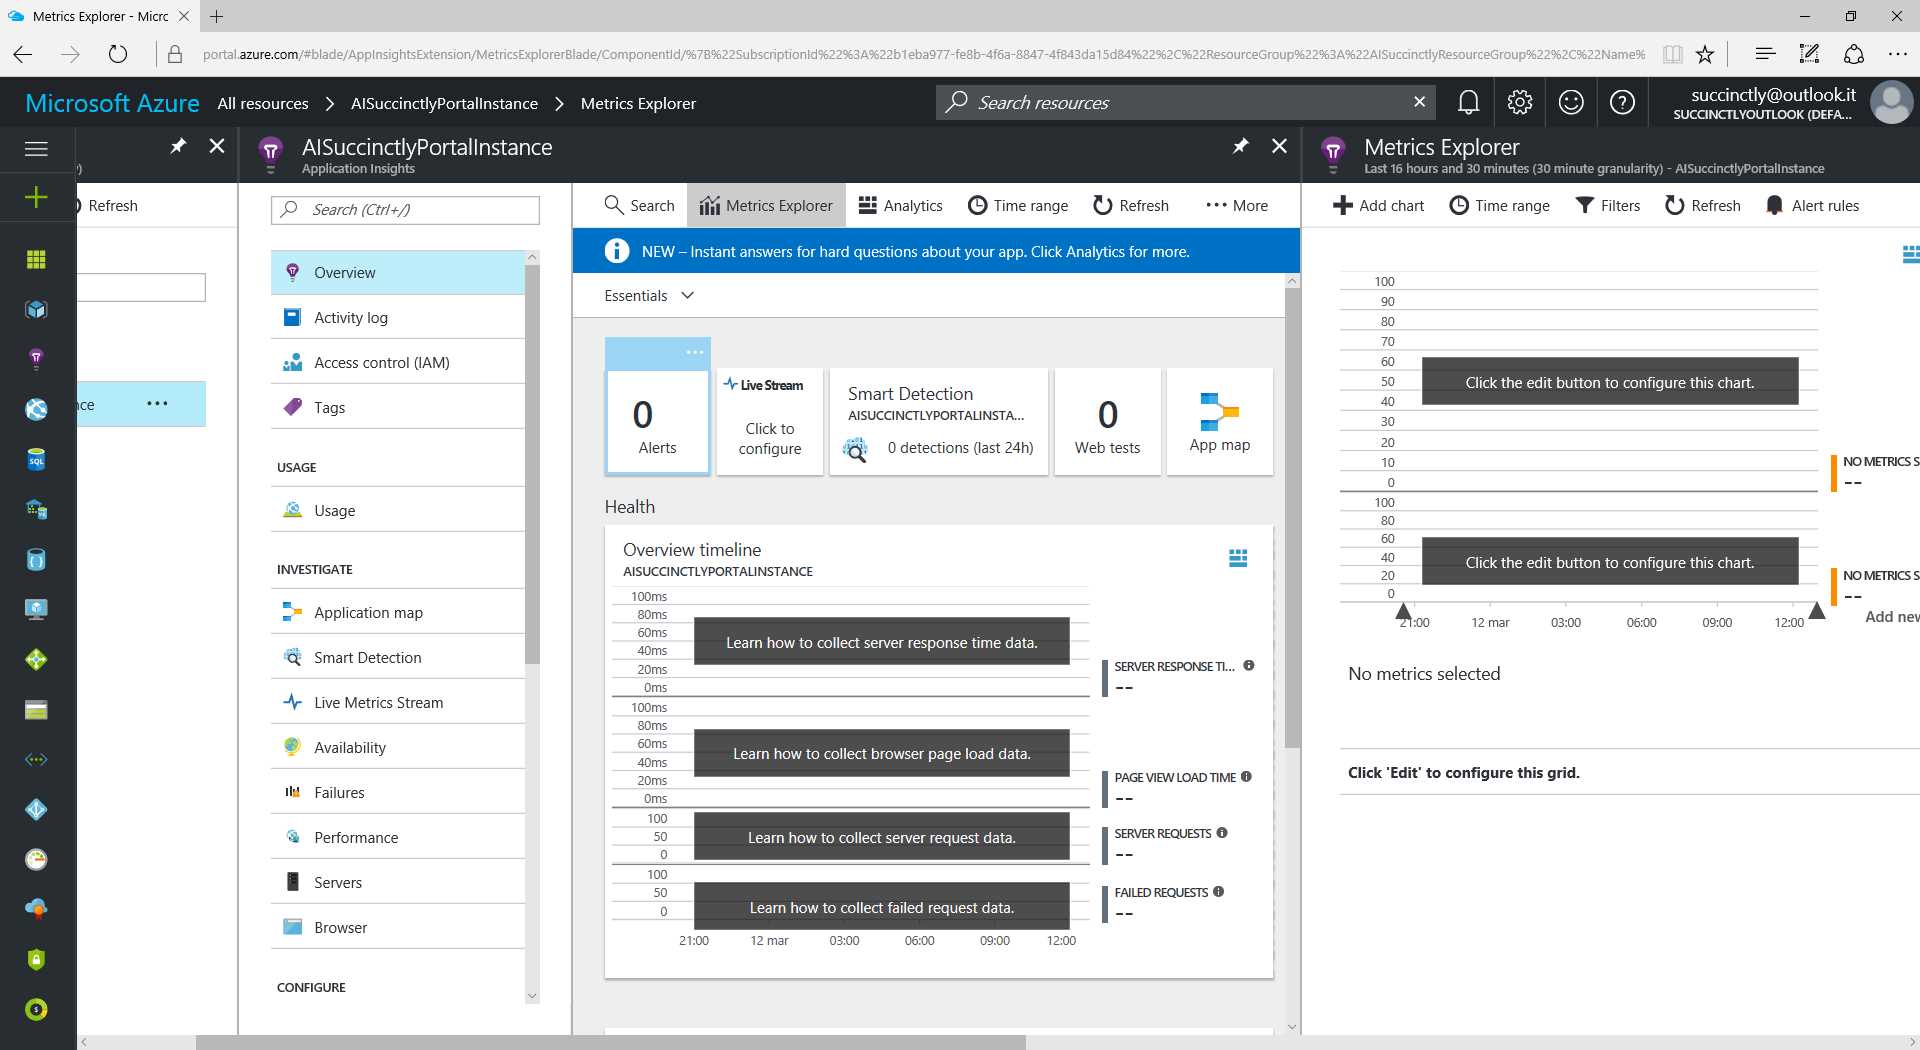
Figure 8: The Metrics Explorer Blade
In Figure 8, we have no data since the resource is brand new. Once the resource has collected data from the web application, we will see something like what’s shown in Figure 9.
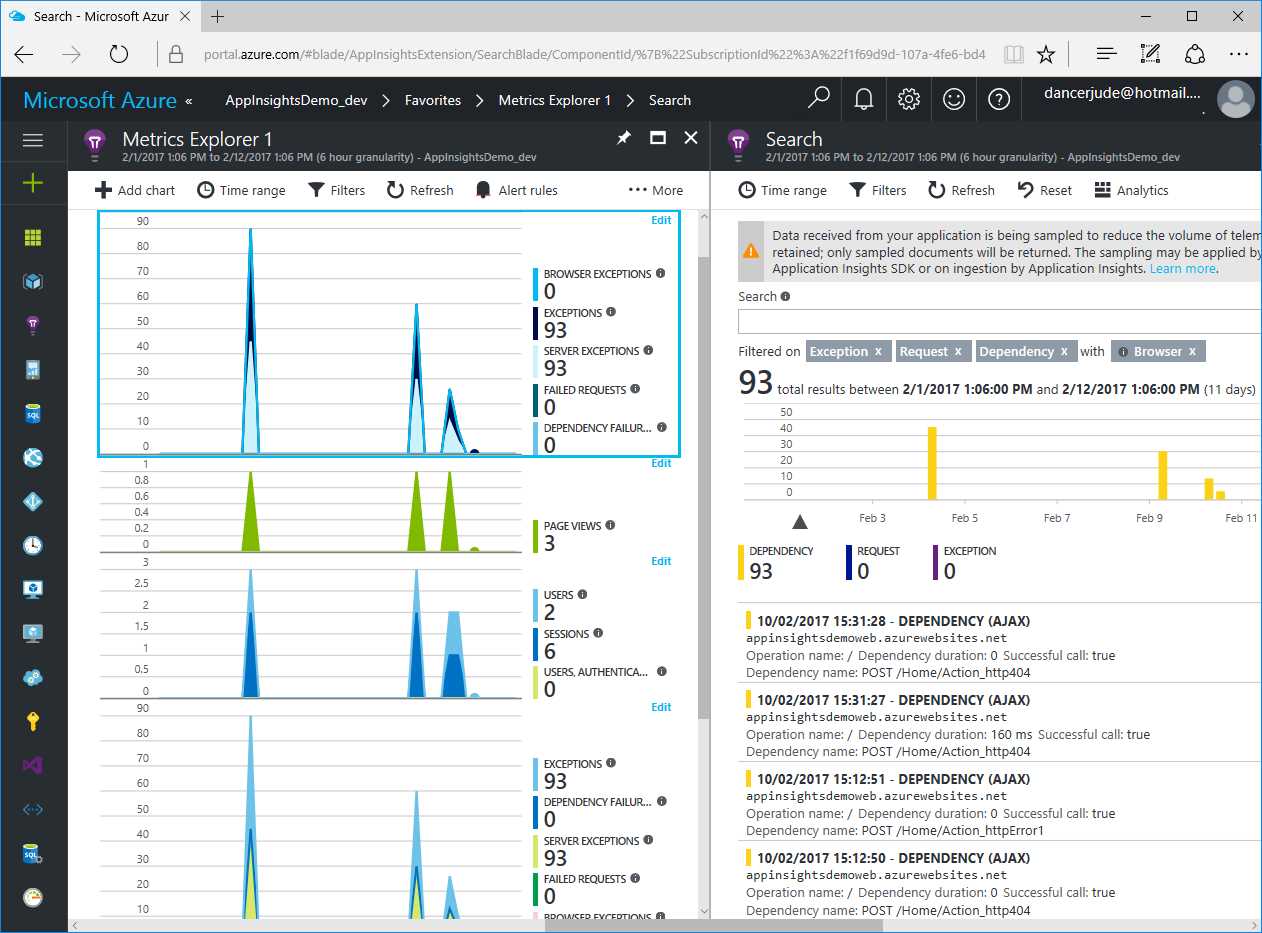
Figure 9: The Metrics Explorer Blade for a Demo Resource
The Metrics Explorer blade can be configured using specific information we desire to create a view of metrics, as you can see in Figure 9.
Note: The term “view” might not be proper for this feature, and it’s not part of the official nomenclature, but we will use it here to better explain the idea behind this blade.
Metrics Explorer Favorites
It is possible to create more views by saving them to the Favorites list. For instance, we could save a view named “exceptions” in our favorites with all the metrics related to the exceptions we want to see there, or another view called “visitors” with the details about page views and other information about site visits.
This ability to save and reuse views could be beneficial if you will be intensively using the Metrics Explorer.
Creating a favorite view
Starting from the Metrics Explorer, you could find a situation like in Figure 8, with an empty blade that is ready to host your metrics. Every placeholder can host a chart for a metric.
Select the metrics to host for the desired destination chart by clicking the Edit label in the top-right corner of the graph. In this edit mode, a new blade will appear on the right. Here, you can choose one of the metrics available from the list or use the search text box to filter out specific metrics.
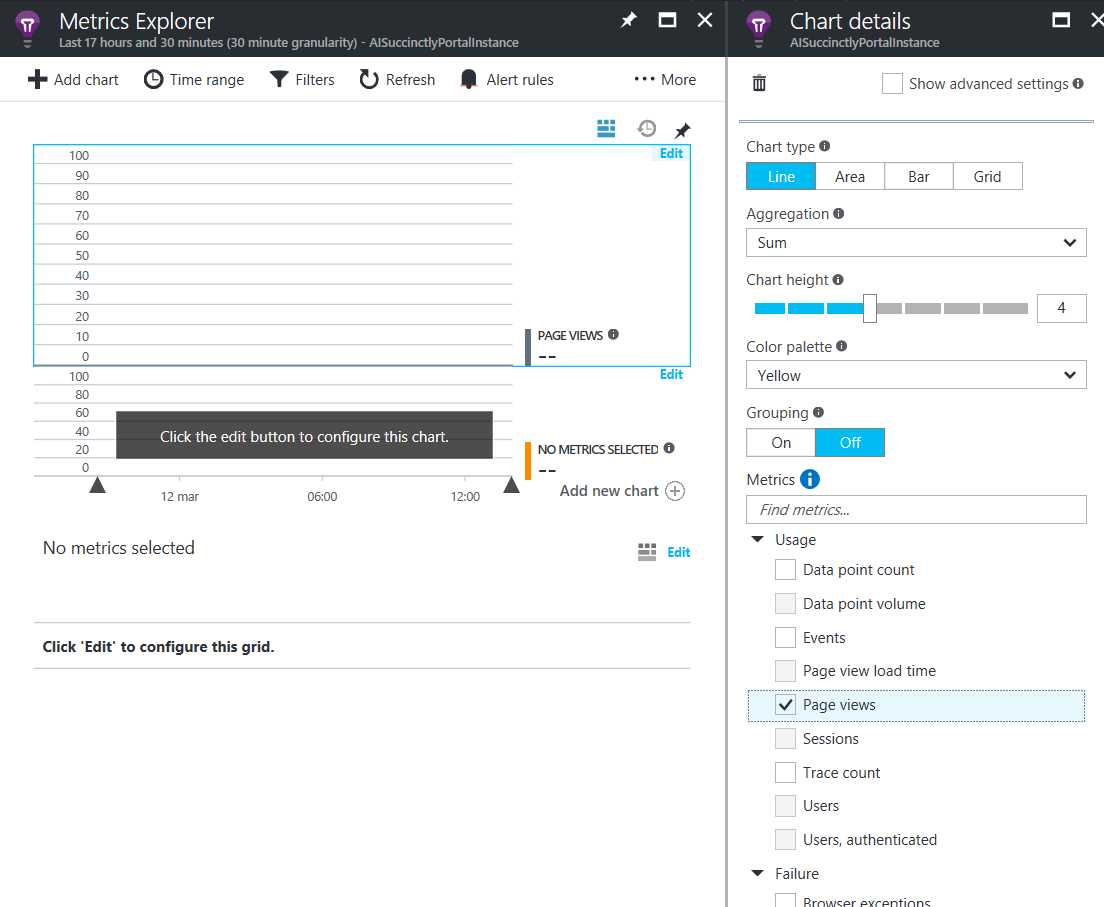
Figure 10: Creating a Metric Explorer View
In a single chart placeholder, we can display more than one metric, but when we select a metric in the Chart details blade, some others will be unavailable, as you can see in Figure 10. This behavior happens because the metrics that are unavailable don’t have the same scale and aggregation types, so they cannot appear on the same chart.
As you can see in the upper-right side of Figure 10, we can choose how to shape the data seen on the screen by selecting one of the Chart type values:
To show the different chart types, the following figure shows the same Page Views metric used to create four charts, one per chart type:
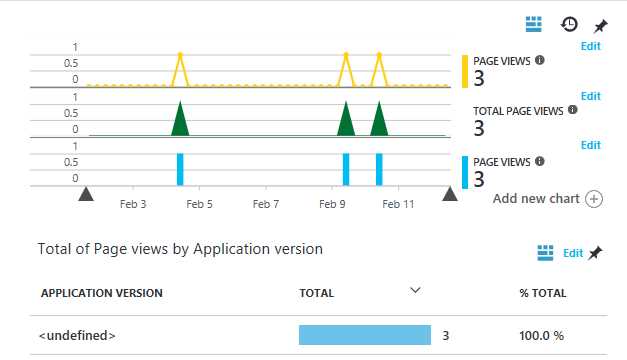
Figure 11: Page Views Metric in Four Different Chart Types
Depending on the chosen metric and chart type, there could be other settings available, such as a graph height or an aggregation field.
In the Metrics Explorer blade (as well as in a view that can be saved as a favorite), we can add more placeholders using the Add new chart option, as shown in Figure 11. There could be up to nine chart placeholders in a single blade, regardless of the chart type or height.
A view can be saved to the Favorites list as a shared or personal one, using the option seen in Figure 12.
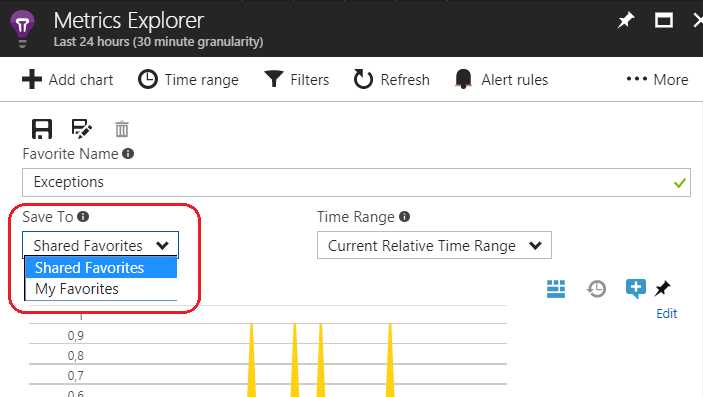
Figure 12: Saving a Favorite View
The term shared means that any other user that has access to the resource can see and edit this view. Otherwise, the view is only visible to its creator.
Loading a favorite view
From the Overview blade, you can reach the list of Favorites.
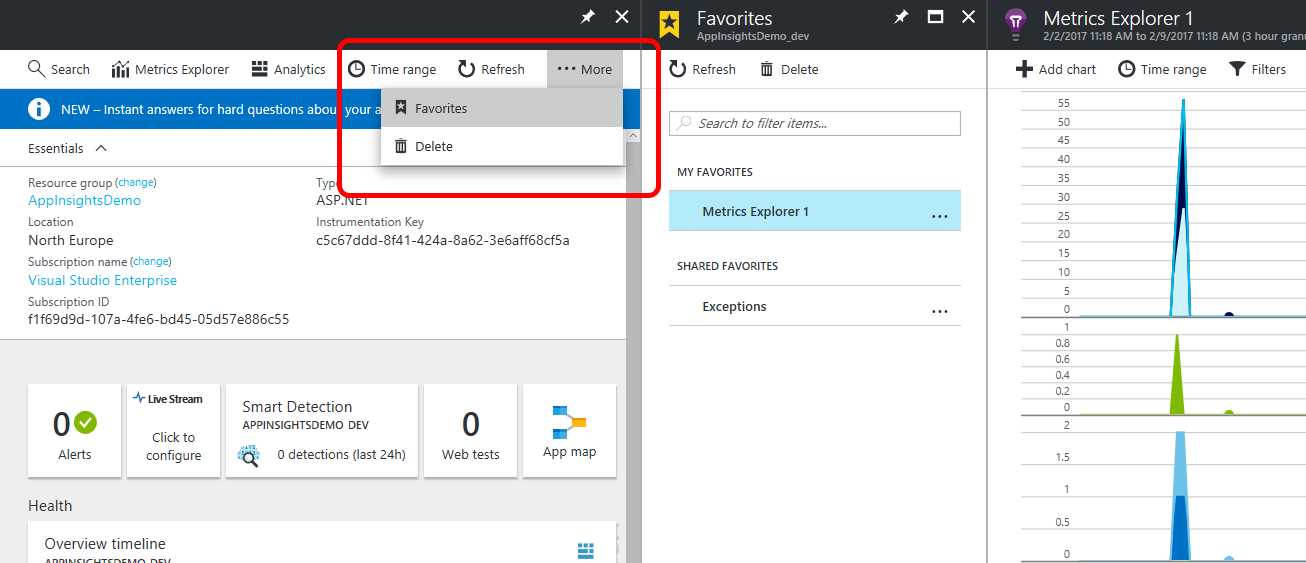
Figure 13: Favorites List
In the Favorites blade, there are two sections where we will find all our favorites: My favorites and Shared favorites. In the first section, the user will find their own favorites, while the second section contains the favorites created and shared by other users. The shared favorites can be used and edited as well.
Here we can choose a favorite view to load and display with a single click. Once selected, the usage is the same as using the Metrics Explorer directly.
Set the time range for the Metrics Explorer
Once we have chosen the metrics to display, we can select the time range for which we want to display data within the Metrics Explorer.
- Last 30 minutes
- Last hour
- Last 12 hours
- Last 24 hours
- Last 48 hours
- Last three days
- Last seven days
- Last 30 days
- Custom (choose your custom start time and end time)
There is also the option of selecting the granularity of the data to display; the values here depend on the time range selected. As you can see in the Pricing options for Application Insights section, the data retention is 90 days (from the current day) in both the Basic and Enterprise pricing options.
In Chapter 7, Consuming and Exporting Data, we will see more about exporting features, which are useful when data must be preserved past the retention period.
Going deep into the details of a metric record
All that we have seen up until now for the Metrics Explorer section was related to displaying available data, but what about the composition of the data itself? Using one of the charts, we can retrieve a set of records about the metrics included. Selecting one of them, we will see more details about it.
To give an example, let’s see the Page views metric for a page of the web application we are monitoring.
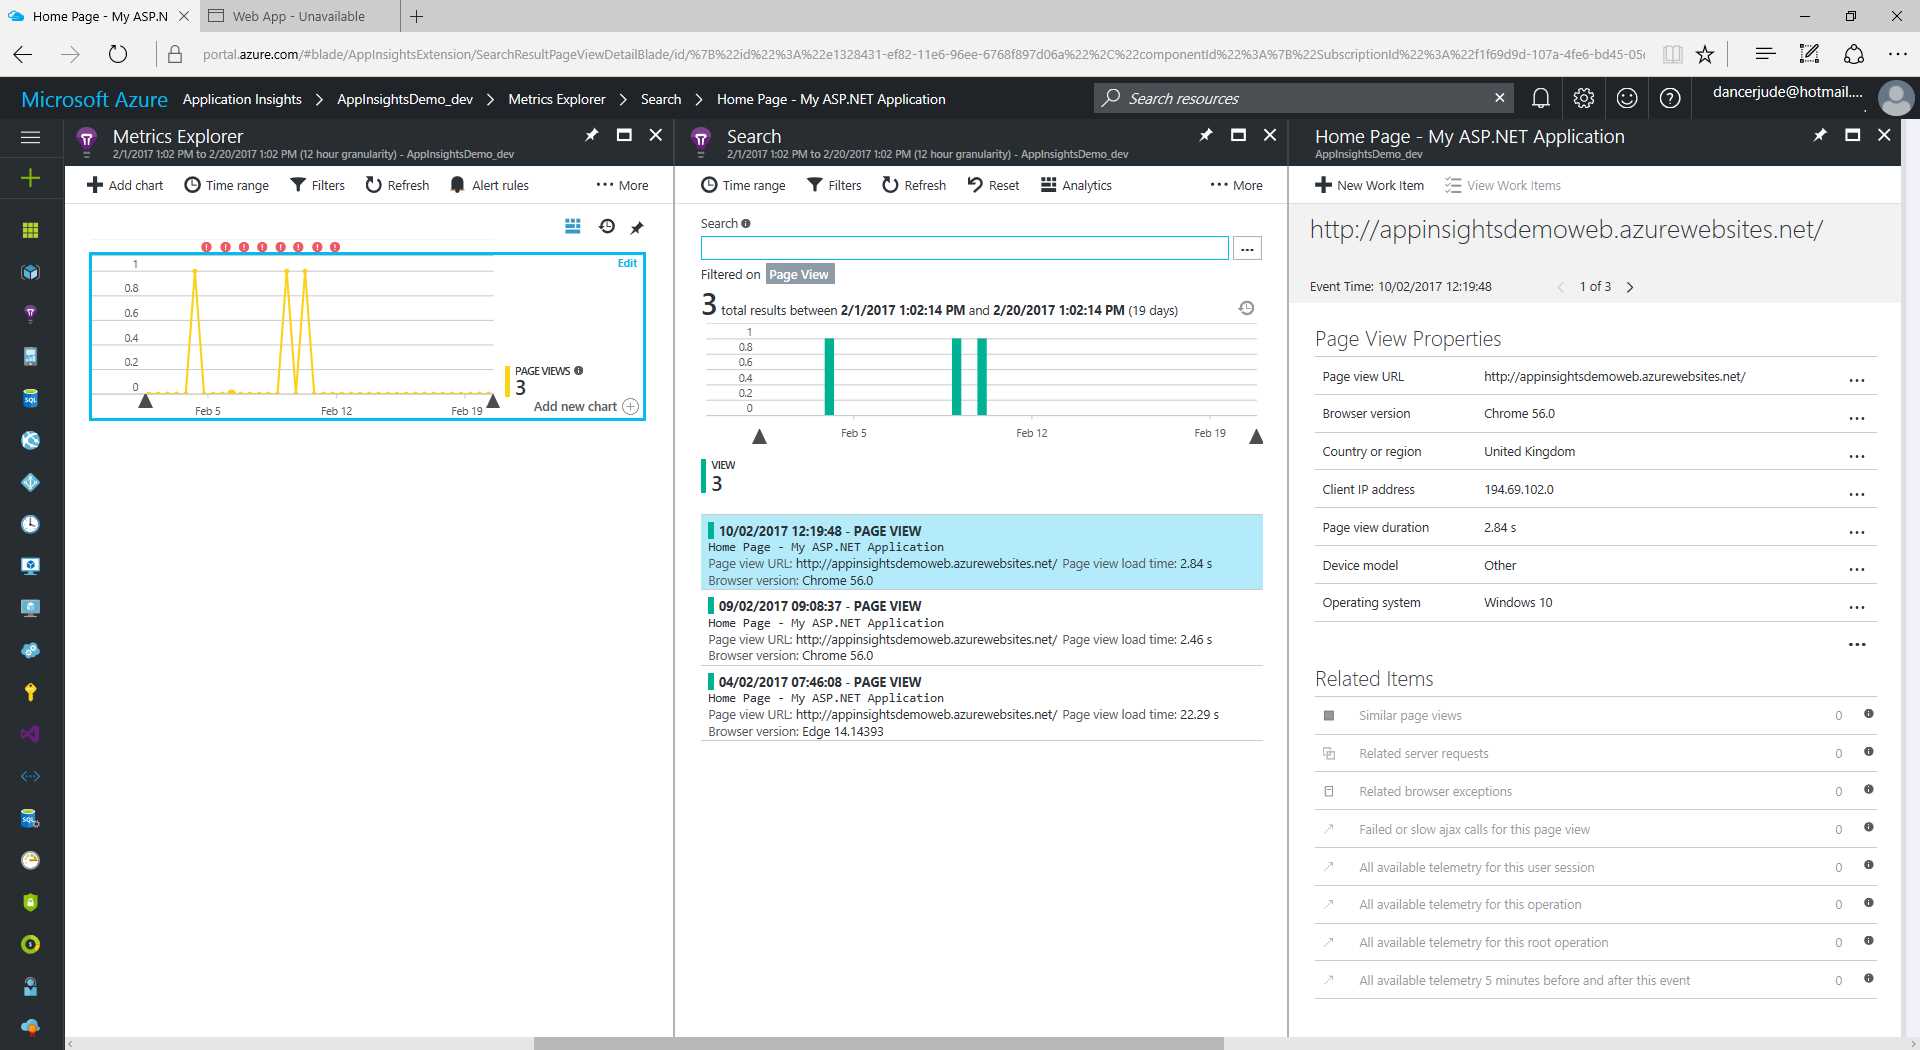
Figure 14: Details for a Page View Metric Record
As you can see in Figure 14, the details about the selected record appear on the right-hand blade. In this case, you can see that the page was visited by someone from the United Kingdom using a Chrome browser on Windows 10. The visitor remained on the page for less than three seconds.
The information present on this metric is related to its scope. So, by choosing other metrics, we will collect other types of information.
List of metrics
When we search for a metric to chart with Metrics Explorer, we find these groups:
- Usage
- Failure
- Server
- Availability
- Client
- Performance Counter
Each group in this list can contain several metrics to detect usage and track behavior of a web application. I will provide a brief description of these metrics one by one to give you a better understanding of each.
Usage metrics
The following table shows a list of the usage metrics.
Table 1: Usage Metrics
Description | |
|---|---|
Data point count | Number of data points sent |
Data point volume | Volume of data sent |
Events | Count of custom events |
Page view load time | Page view load time |
Page views | Count of page views |
Sessions | Count of user sessions |
Trace count | Count of trace documents |
Users | |
User, authenticated | Count of distinct users who signed in |
Failure metrics
The following table shows a list of the failure metrics.
Table 2: Failure Metrics
Description | |
|---|---|
Browser exceptions | Count of uncaught exceptions thrown in the browser |
Dependency failures | Count of failed calls made by the application to external resources |
Exceptions | Combined count of all uncaught exceptions |
Failed requests | Count of HTTP requests marked as failed |
Server exceptions | Count of uncaught exceptions thrown in the server application |
Server metrics
The following table shows a list of the server metrics.
Table 3: Server Metrics
Description | |
|---|---|
Dependency calls | Count of calls made by the application to external resources |
Duration of calls made by the application to external resources | |
Server requests | Count of HTTP requests completed |
Server response time | Time between receiving an HTTP request and finishing sending the response |
Availability metrics
The following table shows a list of the availability metrics.
Table 4: Availability Metrics
Metric | Description |
|---|---|
Availability | Availability (average) |
Test duration | Test duration (average) |
Client metrics
The following table shows a list of the client metrics.
Table 5: Client Metrics
Metric | Description |
|---|---|
Browser page load time | Time from user request until DOM, stylesheets, scripts, and images are loaded |
Client processing time | Time between receiving the last byte of a document until the DOM is loaded (asynchronous requests may still be processing) |
Page load network connect time | Time between user request and network connection (includes DNS lookup and transport connection) |
Receiving response time | Time between the first and last bytes, or until disconnection |
Send request time | Time between network connection and receiving the first byte |
Performance counter metrics
The following table shows a list of the performance counter metrics.
Table 6: Performance Counter Metrics
Metric | Description |
|---|---|
Available memory | Physical memory immediately available for allocation to a process or for system use |
Exception rate | Count of handled and unhandled exceptions reported to Windows, including .NET exceptions and unmanaged exceptions that are converted into .NET exceptions |
HTTP request execution time | Execution time of the most recent request |
HTTP request rate | Rate of all requests to the application per second from ASP.NET |
HTTP requests in application queue | Length of the application request queue |
Process CPU | The percentage of elapsed time of all process threads used by the processor to execute the application process |
Process IO rate | Total bytes per second read and written to files, network, and devices |
Process-private bytes | Memory exclusively assigned to the monitored application’s processes |
Processor time | The percentage of time that the processor spends in non-idle threads |
In this chapter, you have hopefully learned a little bit more about the available metric types. In the next chapter, you will learn how to assign users the appropriate rights to access and use each one.
- 1800+ high-performance UI components.
- Includes popular controls such as Grid, Chart, Scheduler, and more.
- 24x5 unlimited support by developers.