
App Modernization on Azure Succinctly®

CHAPTER 8
Monitor Performance and Costs of Our Cloud-Enabled App
Azure Monitor
Azure Monitor is the central tool for monitoring performance, availability, and other metrics for all the Azure services. Azure Monitor can also collect data from on-premises services and solutions, and can export data into third-party monitoring solutions.
Azure Monitor has consolidated multiple monitoring products that were available in the past under various brands.
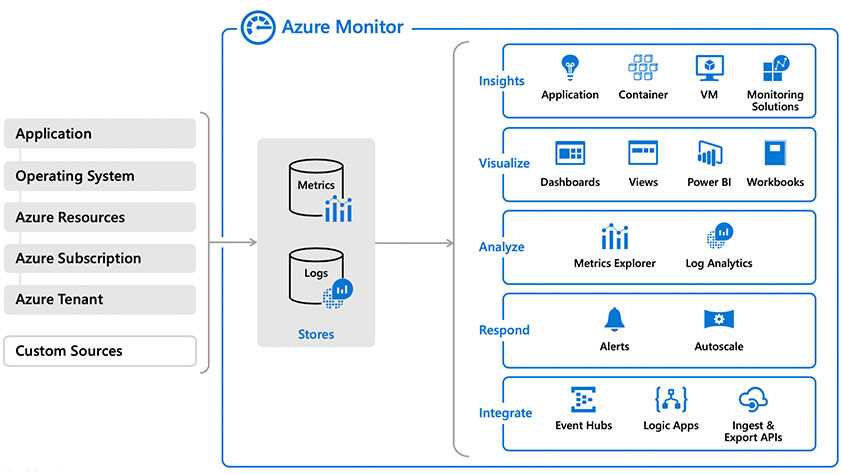
Figure 85: Azure Monitor architecture (from Azure documentation)
On the left-hand side of Figure 86, you can see all the data sources that Azure Monitor can use.
All data is stored in metrics and logs stores:
- Metrics are numerical values that describe the status of the systems at a particular time.
- Logs contain different kinds of data, depending on the source service, organized in records with different properties.
On the right-hand side of the figure, you can see all the services that can work with the collected data to analyze, visualize, query, alert, or integrate with other systems.
Insights
Azure Monitor collects a lot of information, and sometimes it’s not easy to filter and query all the data to extract meaningful insights. To solve this problem, Microsoft created many tools to give an overview of the essential information for applications, VMs, containers, and resource groups.
If needed, there are many other monitoring solutions you can install.
Application Insights
Application Insights is a full application performance management (APM) tool for cross-platform web, desktop, and mobile apps that are running on premises, on Azure, or other cloud providers.
To use Application Insights, you can install a small SDK (that instruments your application, auto-collects data, and also allows custom event reporting) in all parts of your application. It has native support for ASP.NET, ASP.NET Core, Node.js, Java, iOS, Android, and Windows apps.
Application Insights can work with existing loggers, like Log4Net, Log4J, LogStash, and System.Diagnostic.Trace, to send the collected data to the cloud.
Application Insights can also be enabled natively on many Azure components (such as Azure Functions), and can also collect performance data and logs from many systems. It can instrument client webpages to have an end-to-end performance, reliability, and a functional overview of the solution.
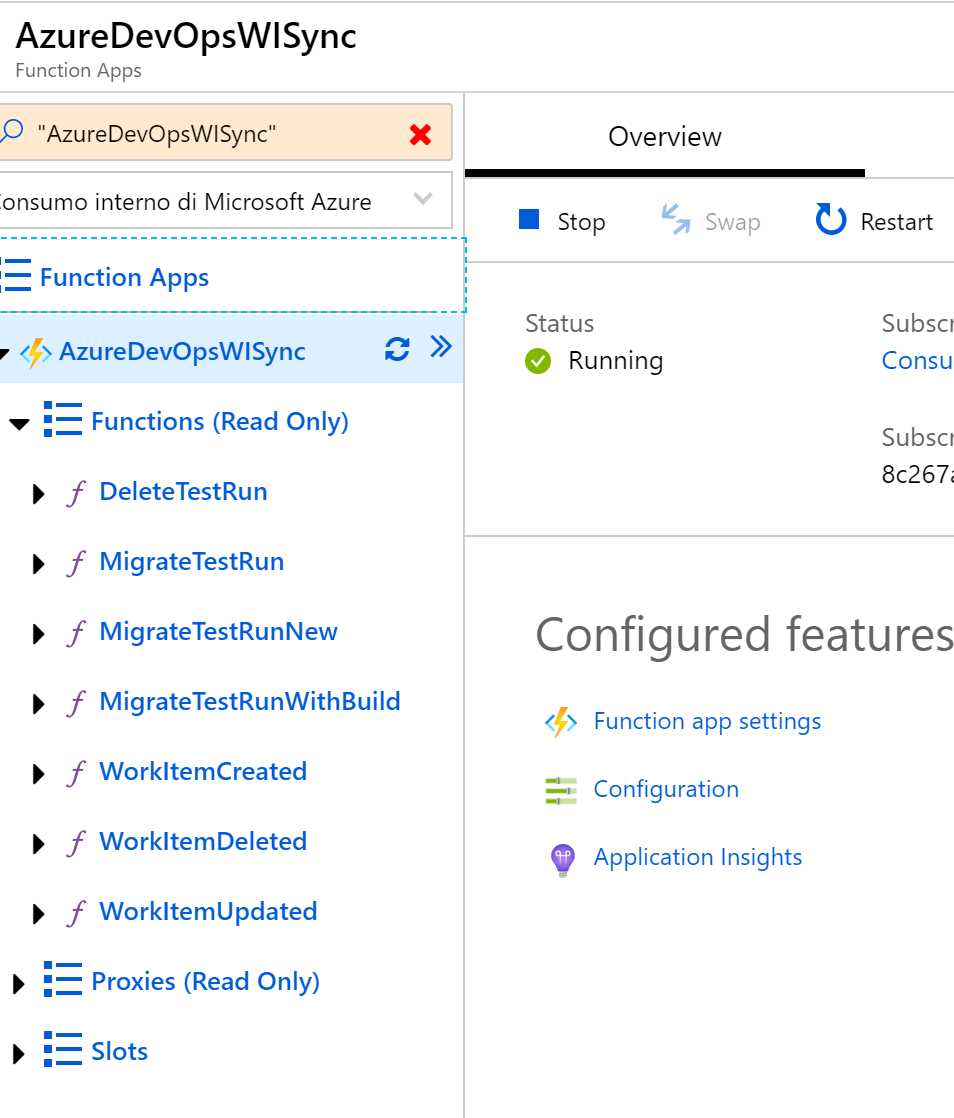
Figure 86: Application Insights inside the Azure Functions blade
You can find the complete list of platforms, SDKs, and integrations that Application Insights offers here.
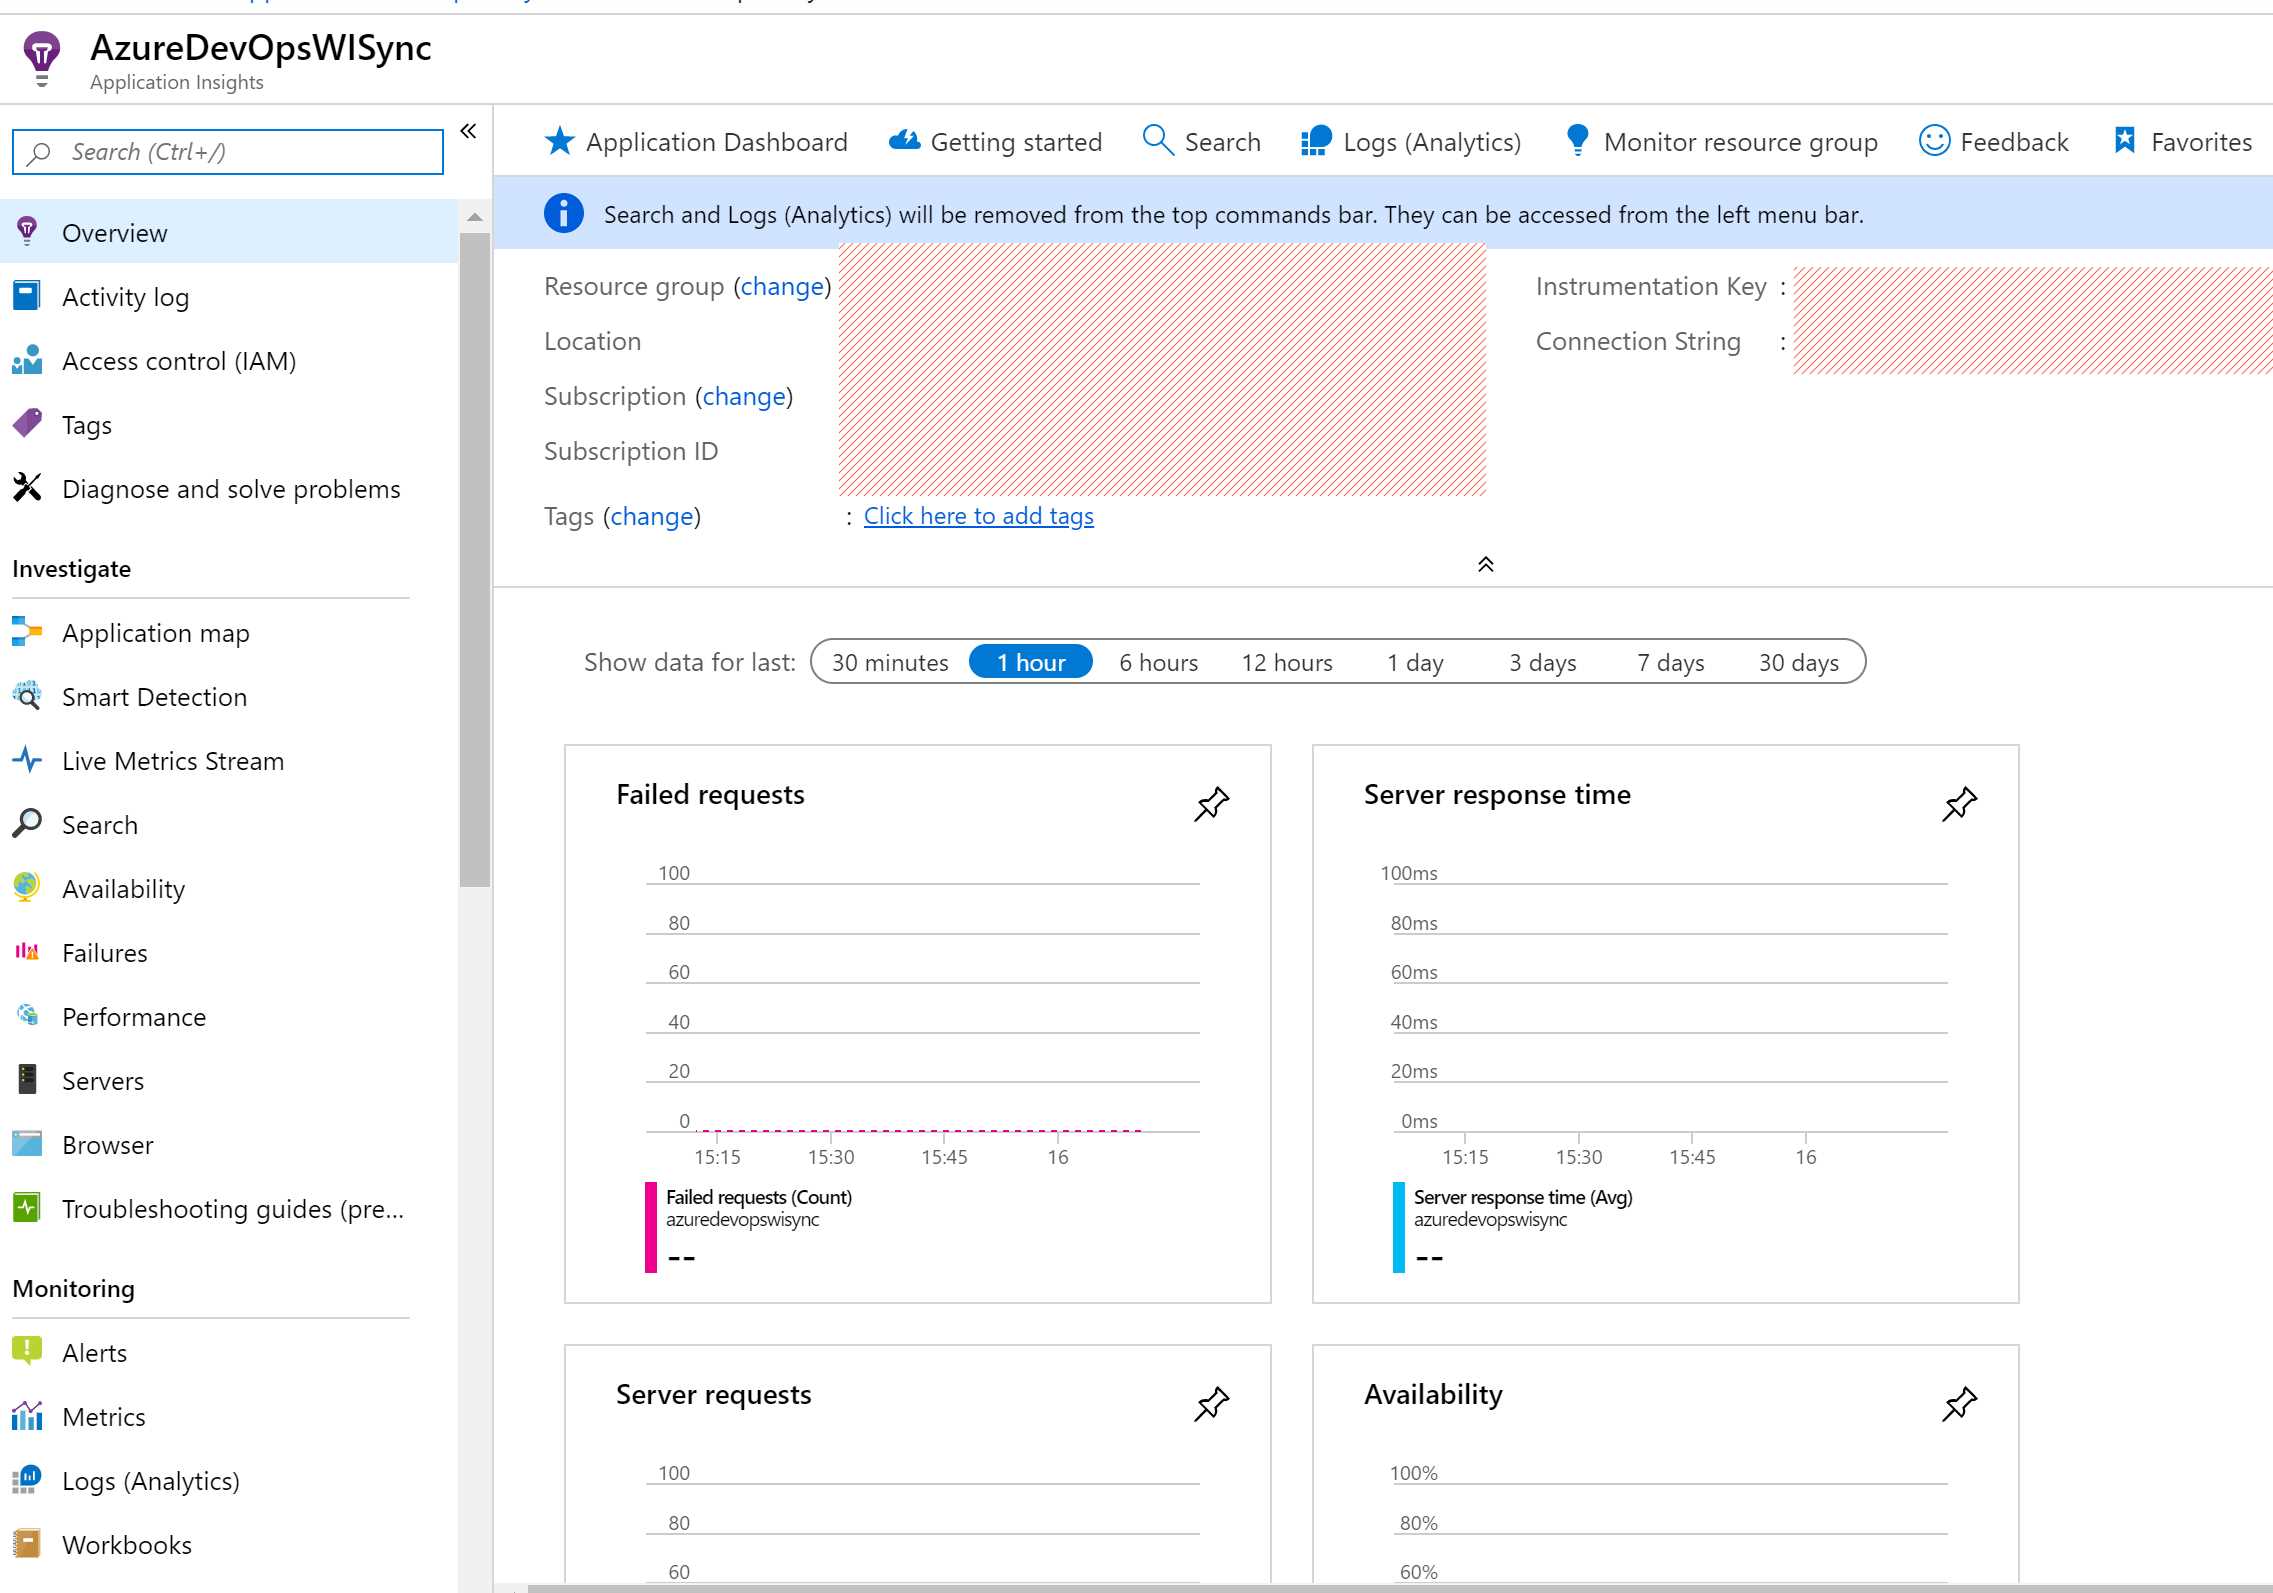
Figure 87: Application Insights blade
Application Insights supports advanced charting and log query capabilities, thanks to the power of Azure Monitor.
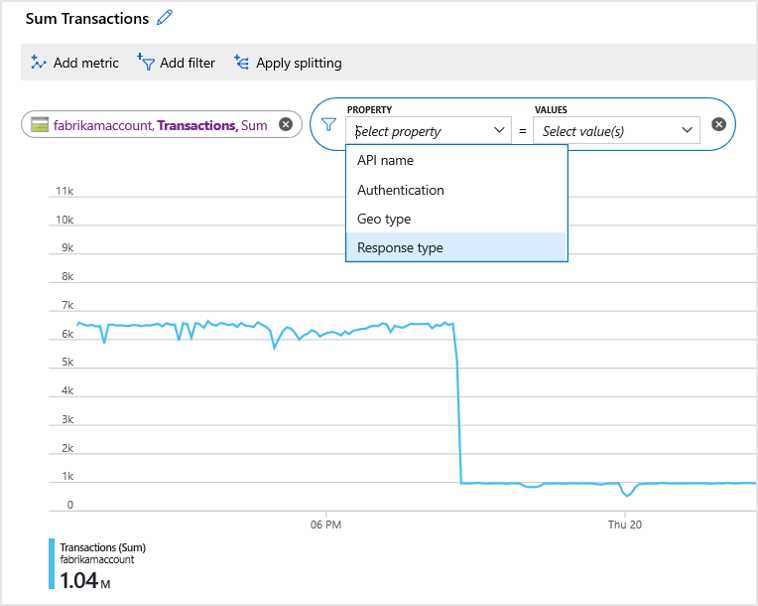
Figure 88: Charting capabilities of Application Insights (from Azure documentation)
Application Insights shares many features with the rest of Azure Monitor (such as alerts, Power BI integration, and third-party data export), but it also has some unique features, like a complete integration with Visual Studio (including the powerful Snapshot Debugger), integration with Azure DevOps Release Pipelines for continuous monitoring, and more.
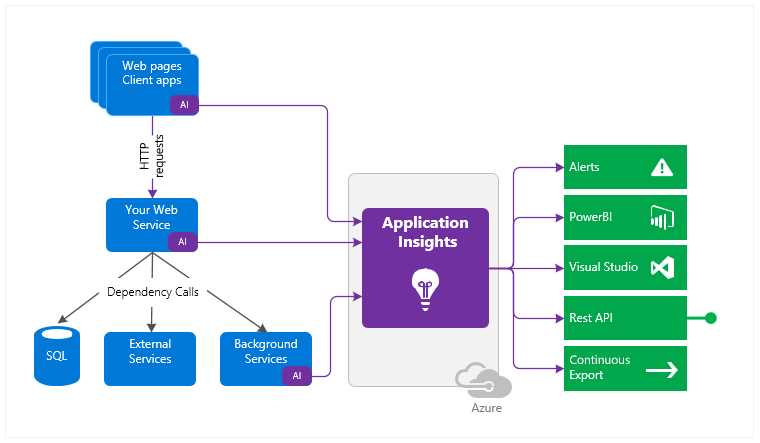
Figure 89: Application Insights integration in a solution (from Azure documentation)
To learn more about it, you can refer to Application Insights Succinctly.
Azure Monitor for VMs
Azure Monitor for VMs (in preview when this e-book was written) allows us to monitor Linux and Windows-based VMs running on Azure, on other cloud providers, or on premises (not all the features are available for VMs running outside Azure).
Besides the usual monitoring features, one of the best features of Azure Monitor for VMs is the ability to have a Service Map that displays interconnected components running on VMs and their relationships.
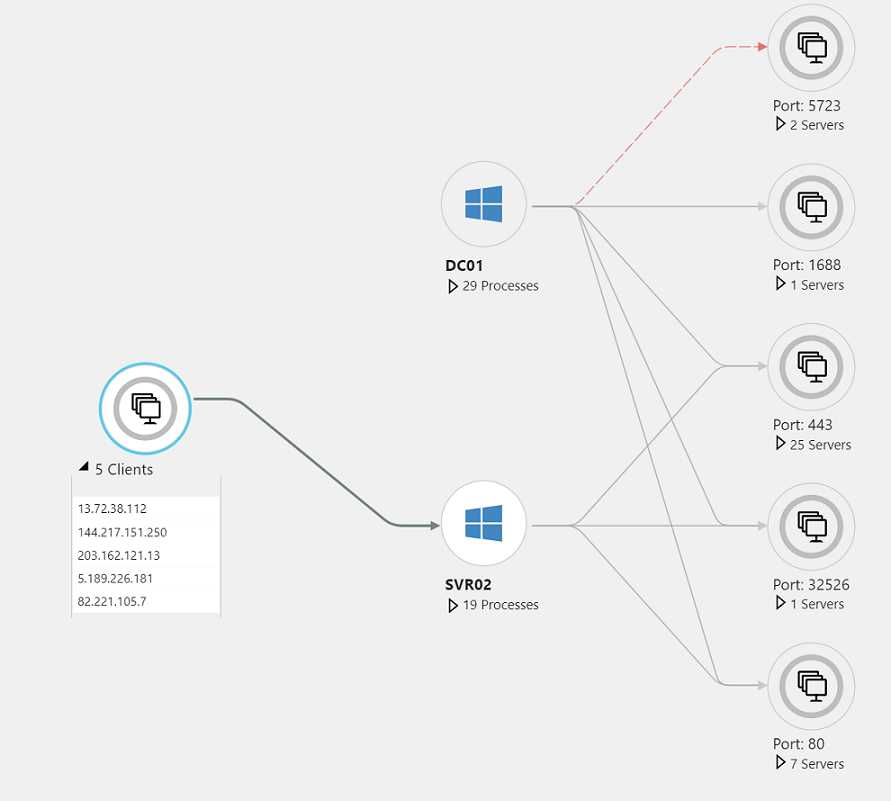
Figure 90: Sample Service Map (from Azure documentation)
Azure Monitor for Containers
Azure Monitor for Containers can be used to monitor AKS and ACI-based solutions, and give an overview of the cluster, all the pods, and other information.
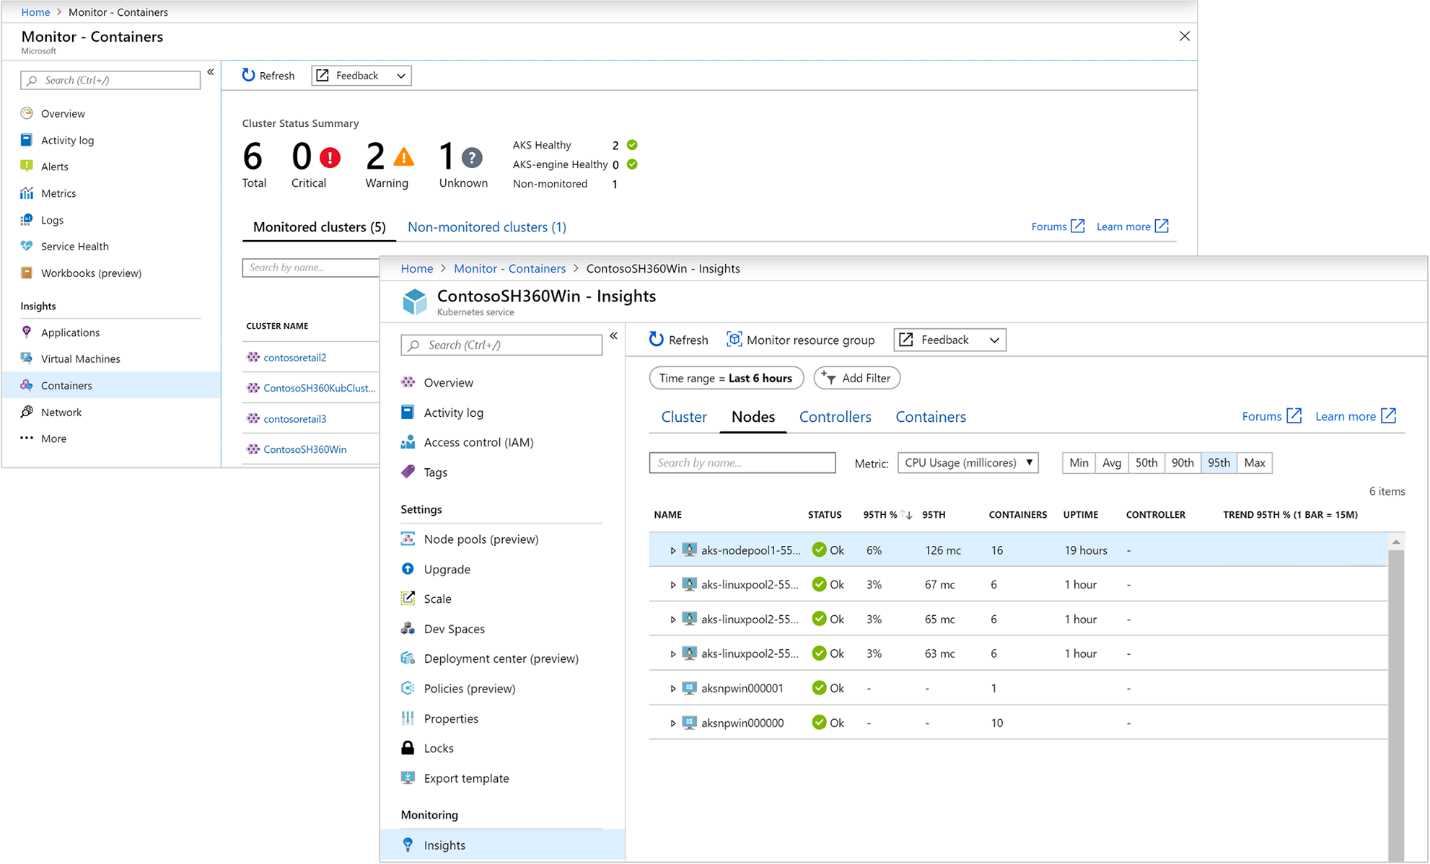
Figure 91: Azure Monitor for Containers (from Azure documentation)
If you need to monitor other container platforms (Docker, Windows containers, DC/OS, Mesos, Service Fabric), you can install the appropriate tool from the Azure Marketplace.
Azure Monitor for Resource Groups
Azure Monitor for Resource Groups (in preview when the e-book was written) gives an overview of the status of an entire resource group, allowing you to see alerts, health, and other data for all the resources in a central place.
Visualize
There are many ways to visualize data from Azure Monitor (and Application Insights), including standard and custom views, dashboards, the integration with Power BI, or third-party tools (such as Grafana).
Workbooks
Sometimes you need to dig into monitoring and application data in ways that you cannot anticipate ahead of time.
Workbooks allow you to combine text, queries, and metrics into rich interactive reports that can be customized and modified to find correlations, explain problems or usage patterns, and more.
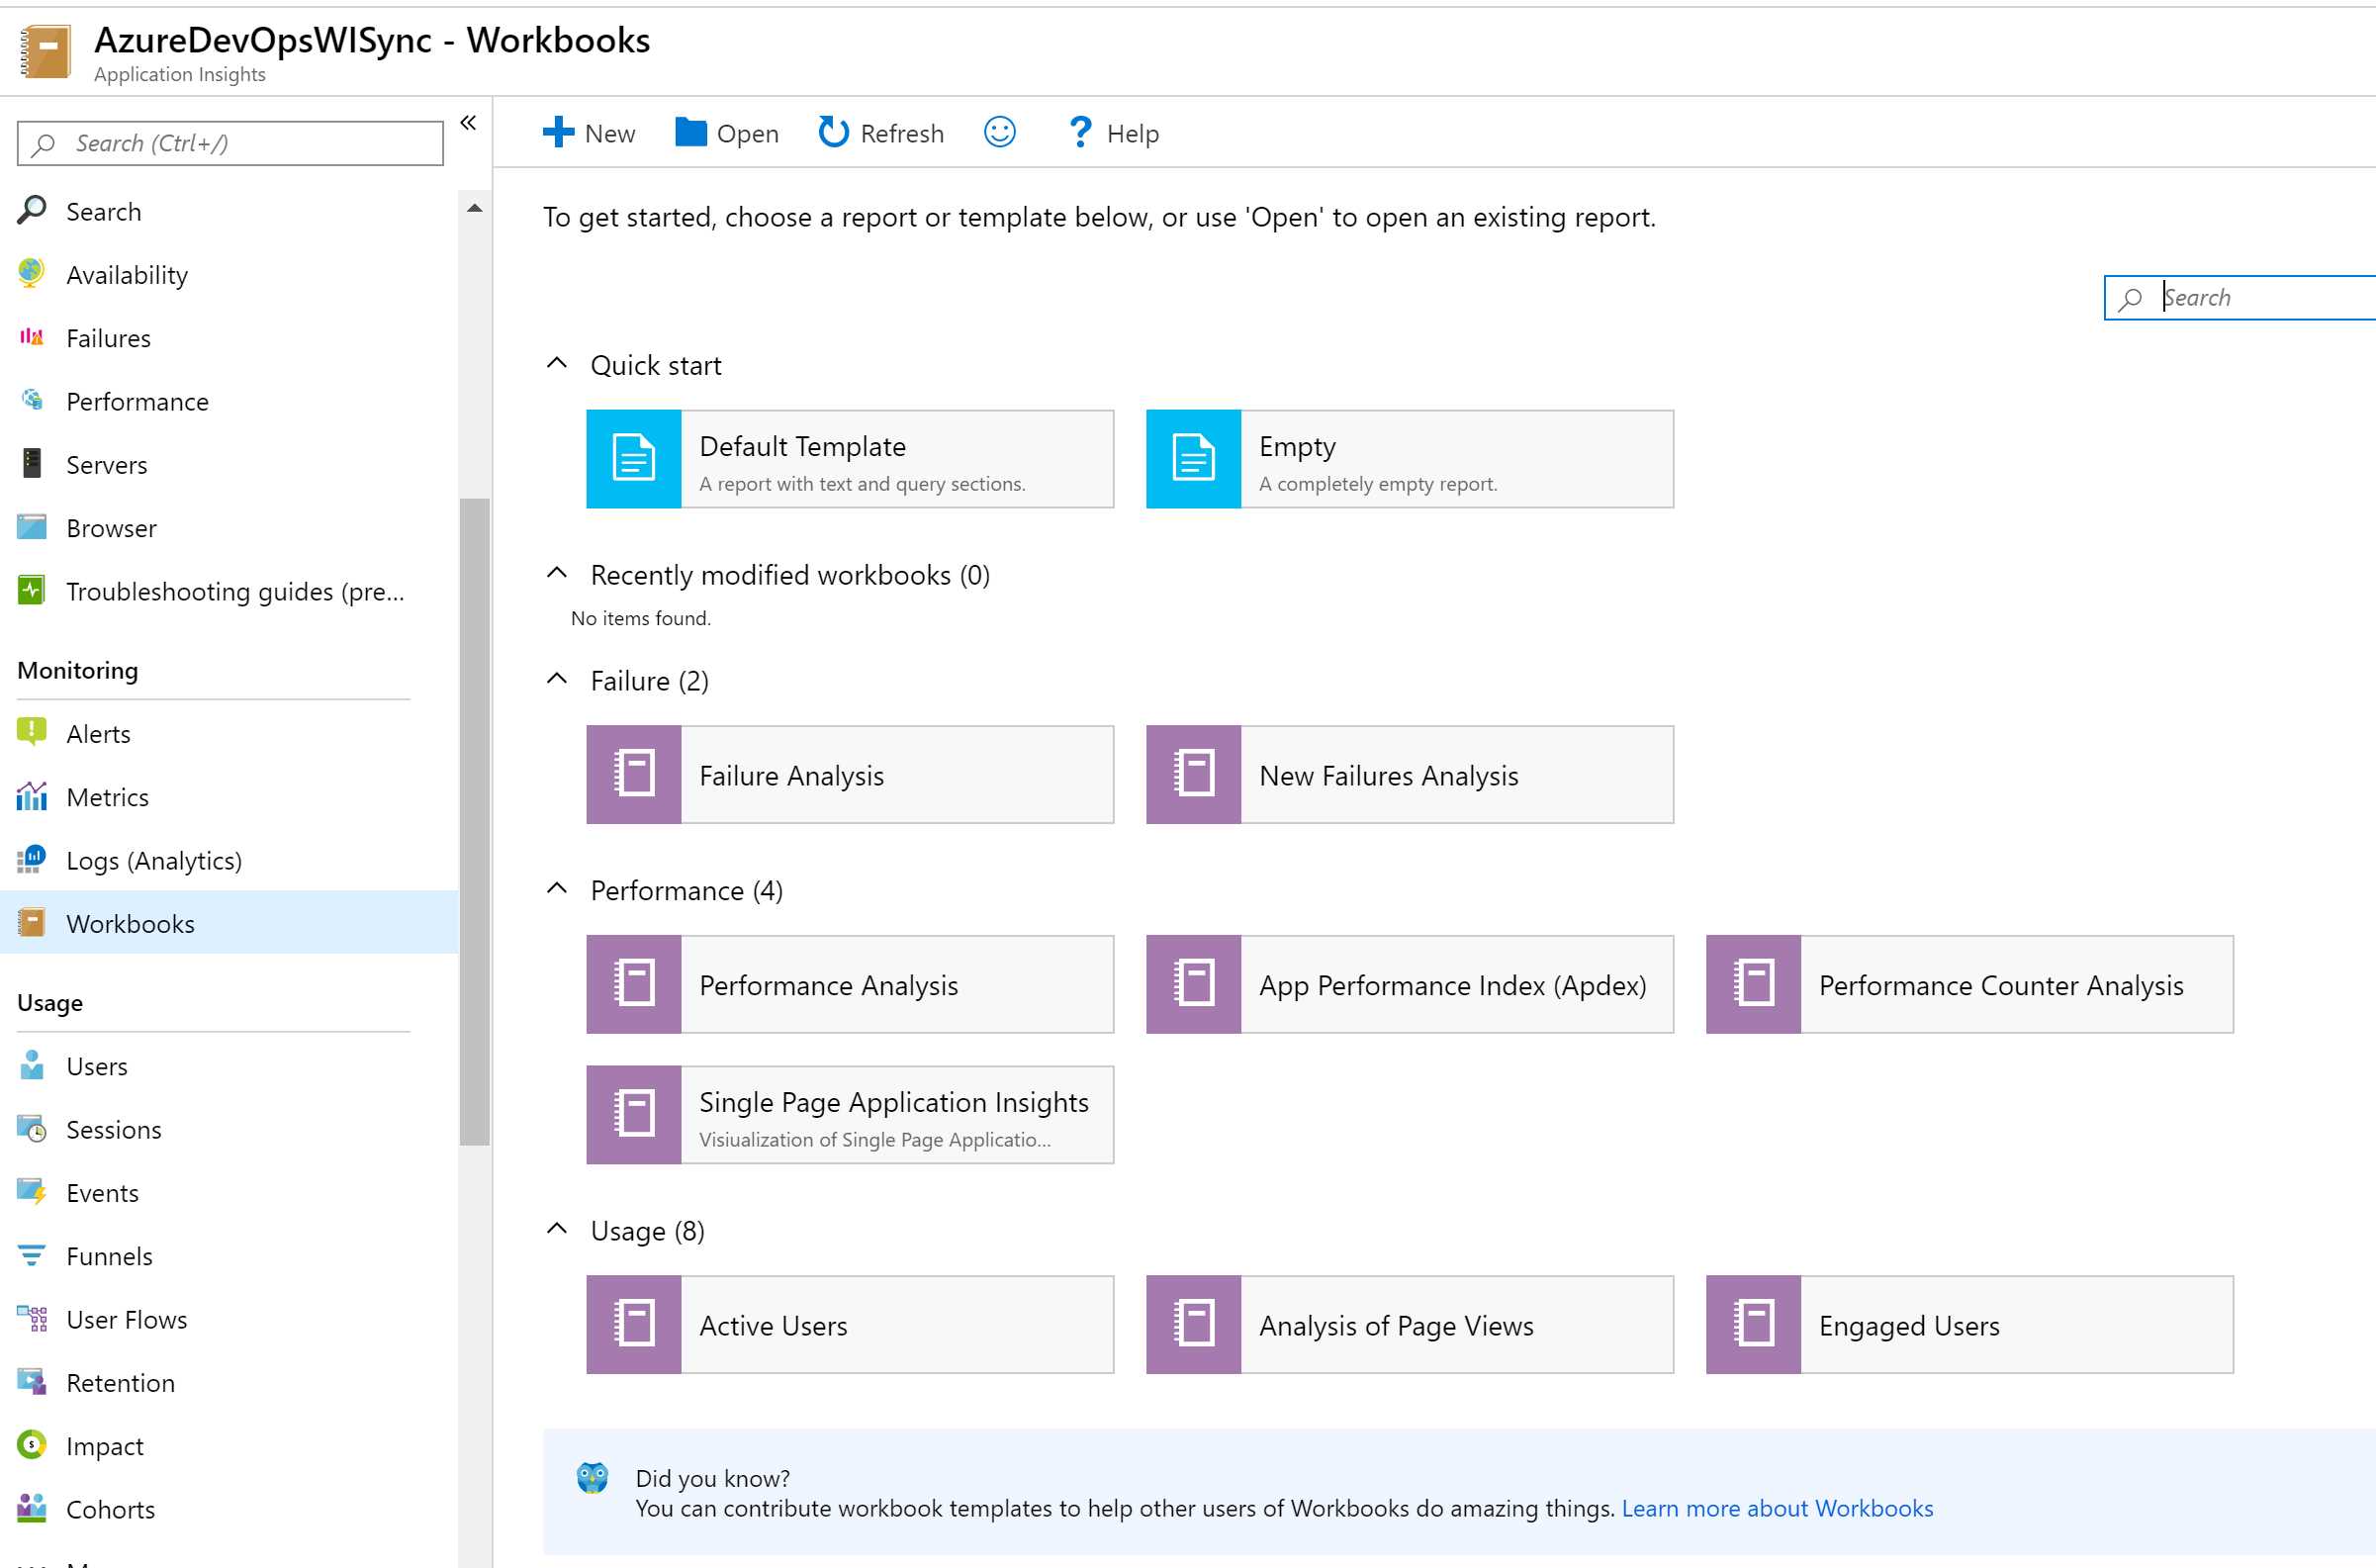
Figure 92: Creating a new Azure Monitor workbook
Analyze data: Log Analytics and Metrics Explorer
We already introduced Metrics Explorer in the previous section about Application Insights. Log Analytics and Metrics Explorer are the tools that give direct access to the underlying stores for metrics and logs.
Log queries can use Azure Data Explorer (with its Kusto Query Language) to explore, analyze, and search in terabytes of logs.
Respond: Alerts and autoscale
Alerts allow you to proactively notify the admin (or another user) when specified conditions are met. You can set alerts on things such as metric values, log search queries, and activity log events.
In the past, all the different monitoring and logging systems had their own alerts, but now the process of integrating them into the new Azure alerts is quite complete.
When an alert is fired, an action is invoked. An action can be:
- SMS
- Push
- Voice
- Logic App
- Webhook
- ITSM
- Automation runbook
Alerts support RBAC to limit who can use them and what information it can receive.
We already discussed autoscale based on Azure Monitor metrics in Chapter 3.
Integration with third-party tools
Using Event Hub, Logic Apps, or Power Automate (Microsoft Flow), or with a direct plugin built with the Ingest & Export API, it’s possible to import data from third-party tools, and also export data to third-party tools.
This is very useful if an organization has already standardized the monitoring tools, because they can adopt Azure but continue to use their preferred solution, like the open-source tool Grafana, or other popular tools (such as IBM QRadar, Splunk, SumoLogic, ArcSight, or Syslog server).
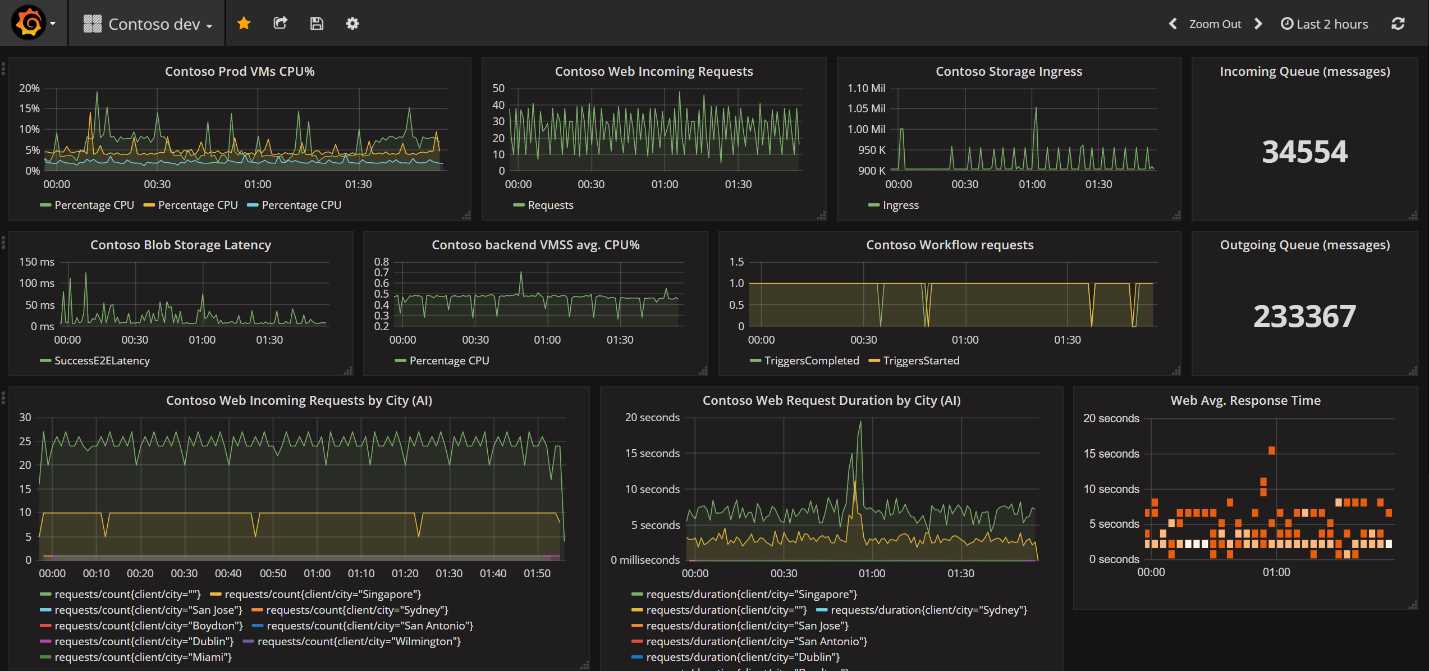
Figure 93: Rich data visualization in Grafana (Source)
Azure Sentinel
Azure Sentinel is a security information and event management (SIEM) tool that extends the capabilities of Azure Monitor and Azure Security Center with advanced features that analyze, detect, investigate, and respond to security attacks.
There is also a GitHub repository with over 400 security queries, plus a lot of notebooks, scripts, and more.
You can find more information on Azure Sentinel here.
Cost management
Understanding and managing cloud costs was once considered black magic because people were not used to the subscription model with pay-as-you-go resources.
Buying hardware was something that IT departments could easily handle, while doing the same thing in the cloud was not so easy, because architects and developers often underestimated the price drives, and costs exploded over time.
Now it’s easier to calculate and manage costs because we have advanced tools to help us.
Note: Cloud service provider (CSP) subscriptions have a different model than other subscriptions; users buy an Azure subscription through a CSP provider when there is a solution attached. The CSP provider can apply different cost models than Microsoft, so most of the tools listed here can be limited or not useful at all on a CSP subscription.
Azure Pricing Calculator
Azure Pricing Calculator is the best ally of an Azure architect—for every service, you can see the price drivers and complete pricing details, and you can go directly to the product details and documentation.
For example, in Figure 95, you can see the price of a Premium V2 App Service plan, with one instance of a 1 Core, 3.5GB RAM, 250GB storage for one month, plus the extra cost for the second IP SSL connection (the first is included).
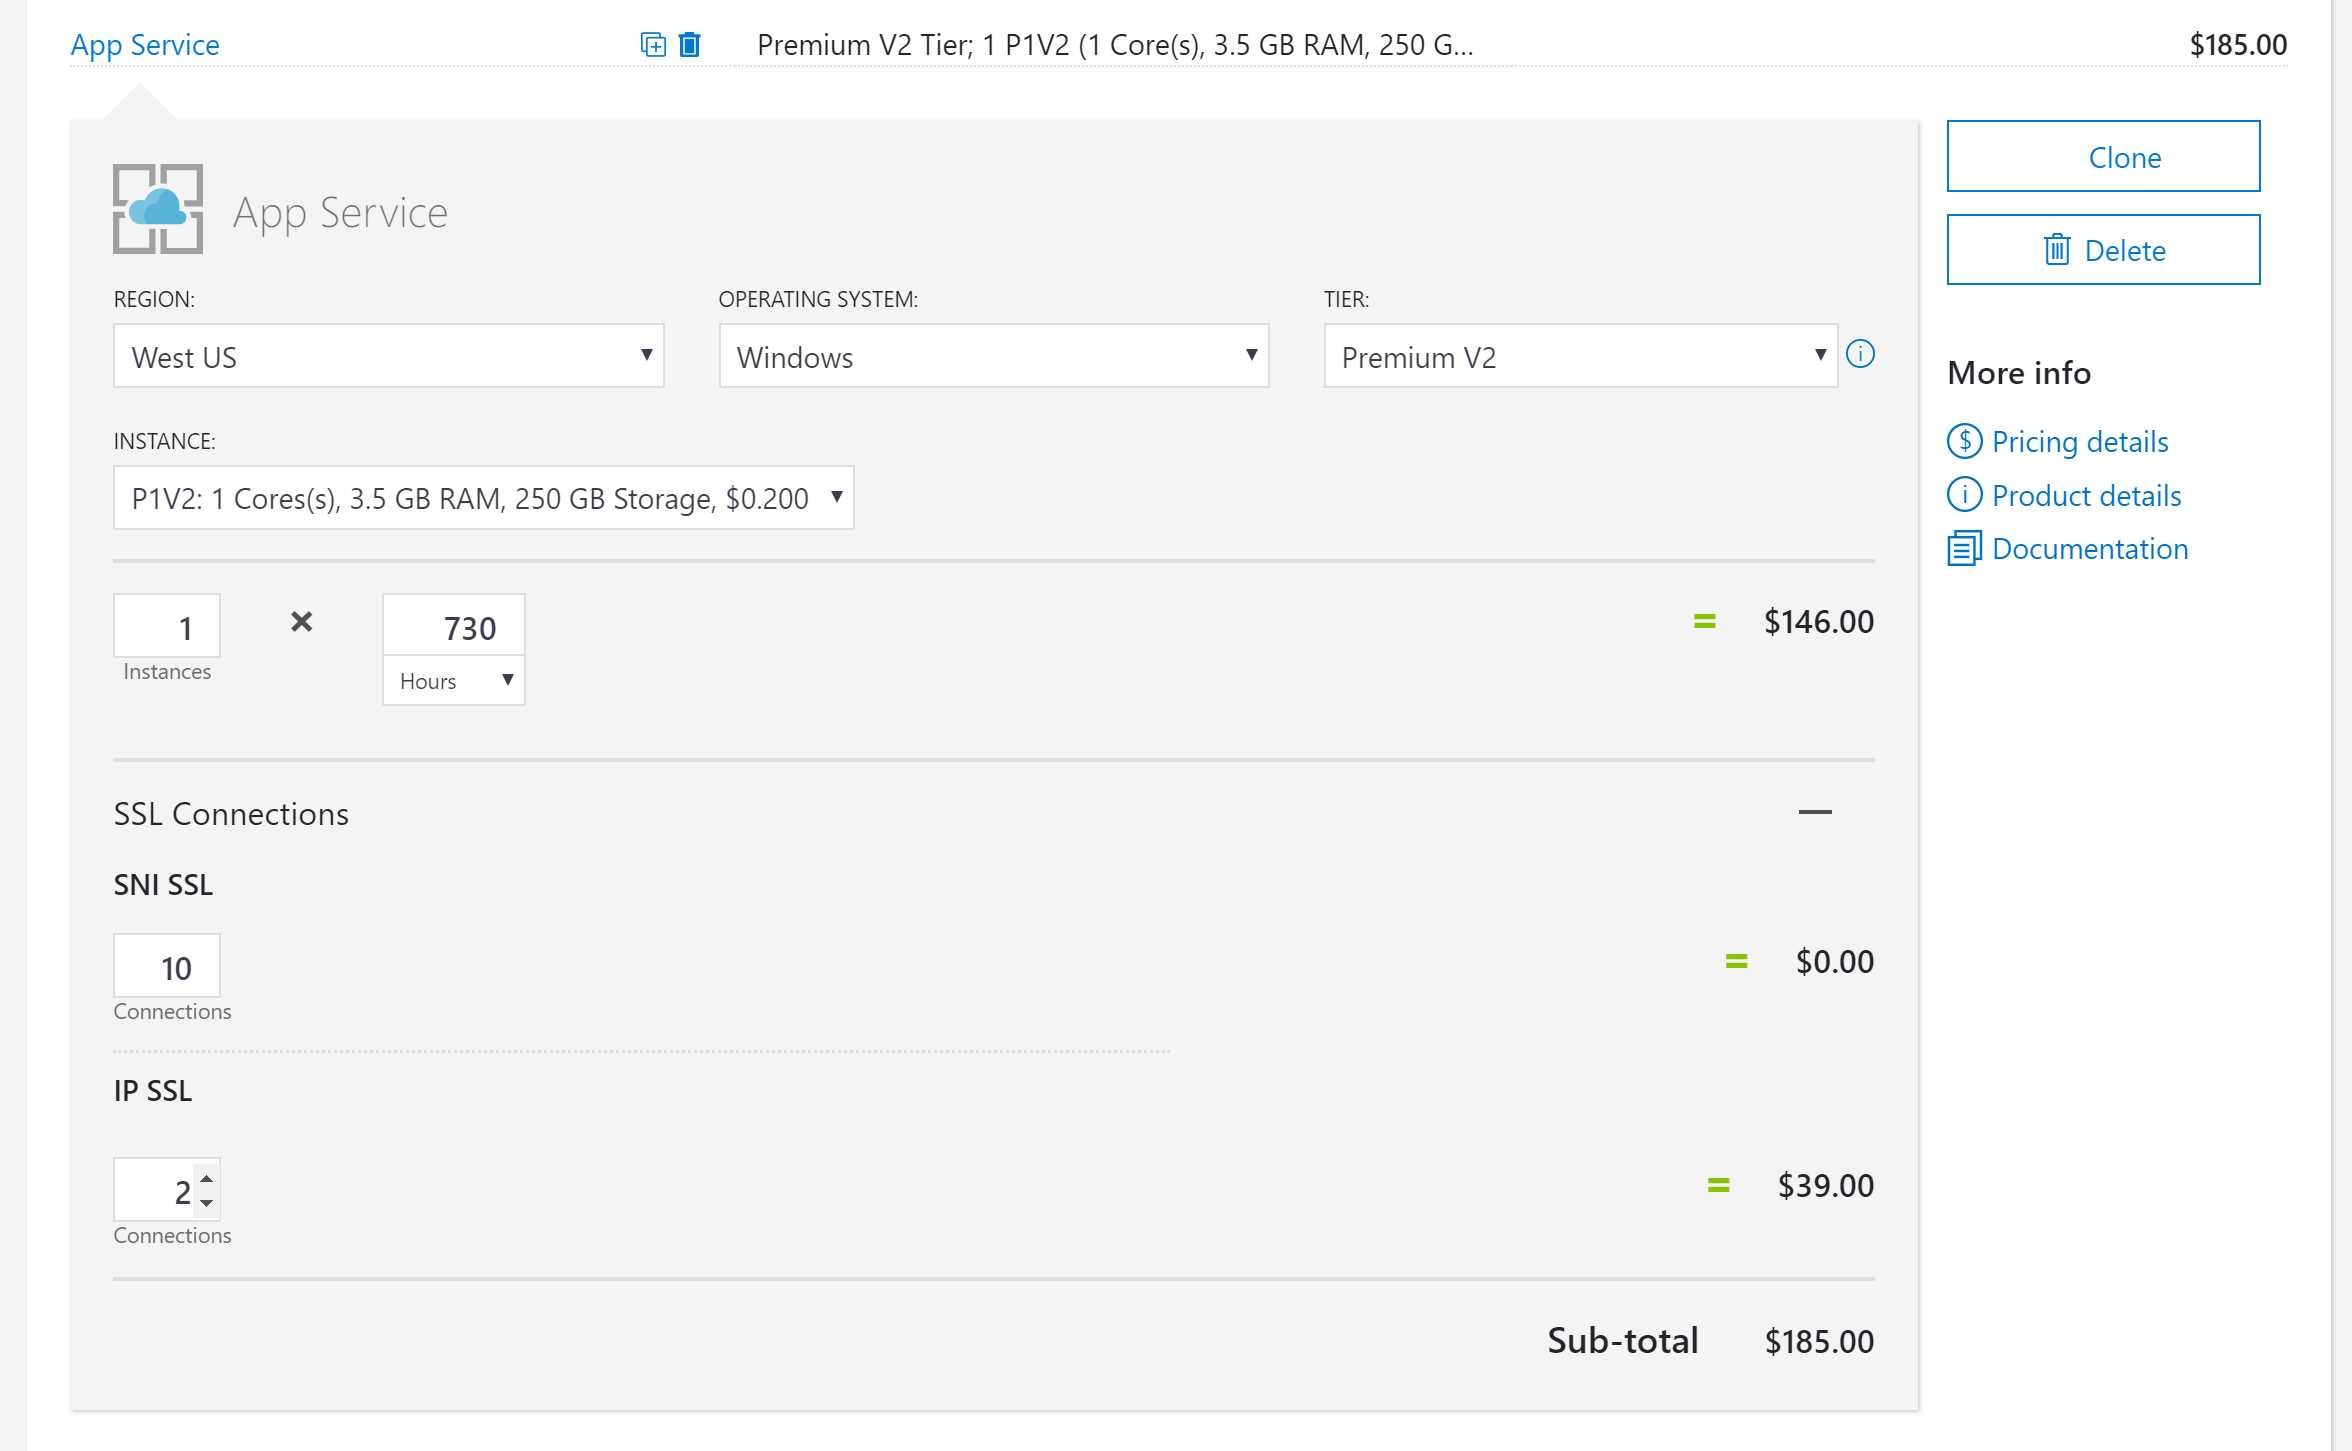
Figure 94: Azure Pricing Calculator sample pricing
Access to complete pricing details is essential for understanding which tier you need. Take the Azure Service Bus, for example. In the pricing details, you can see that basic and standard tiers have a 256KB message size limit, while the premium tier can support up to 1MB of messages. This is a critical limit to know when designing an architecture based on Azure Service Bus because the premium tier is more expensive, and you should use it only when needed—not because you’ve chosen a message size that’s too big for the standard tier.
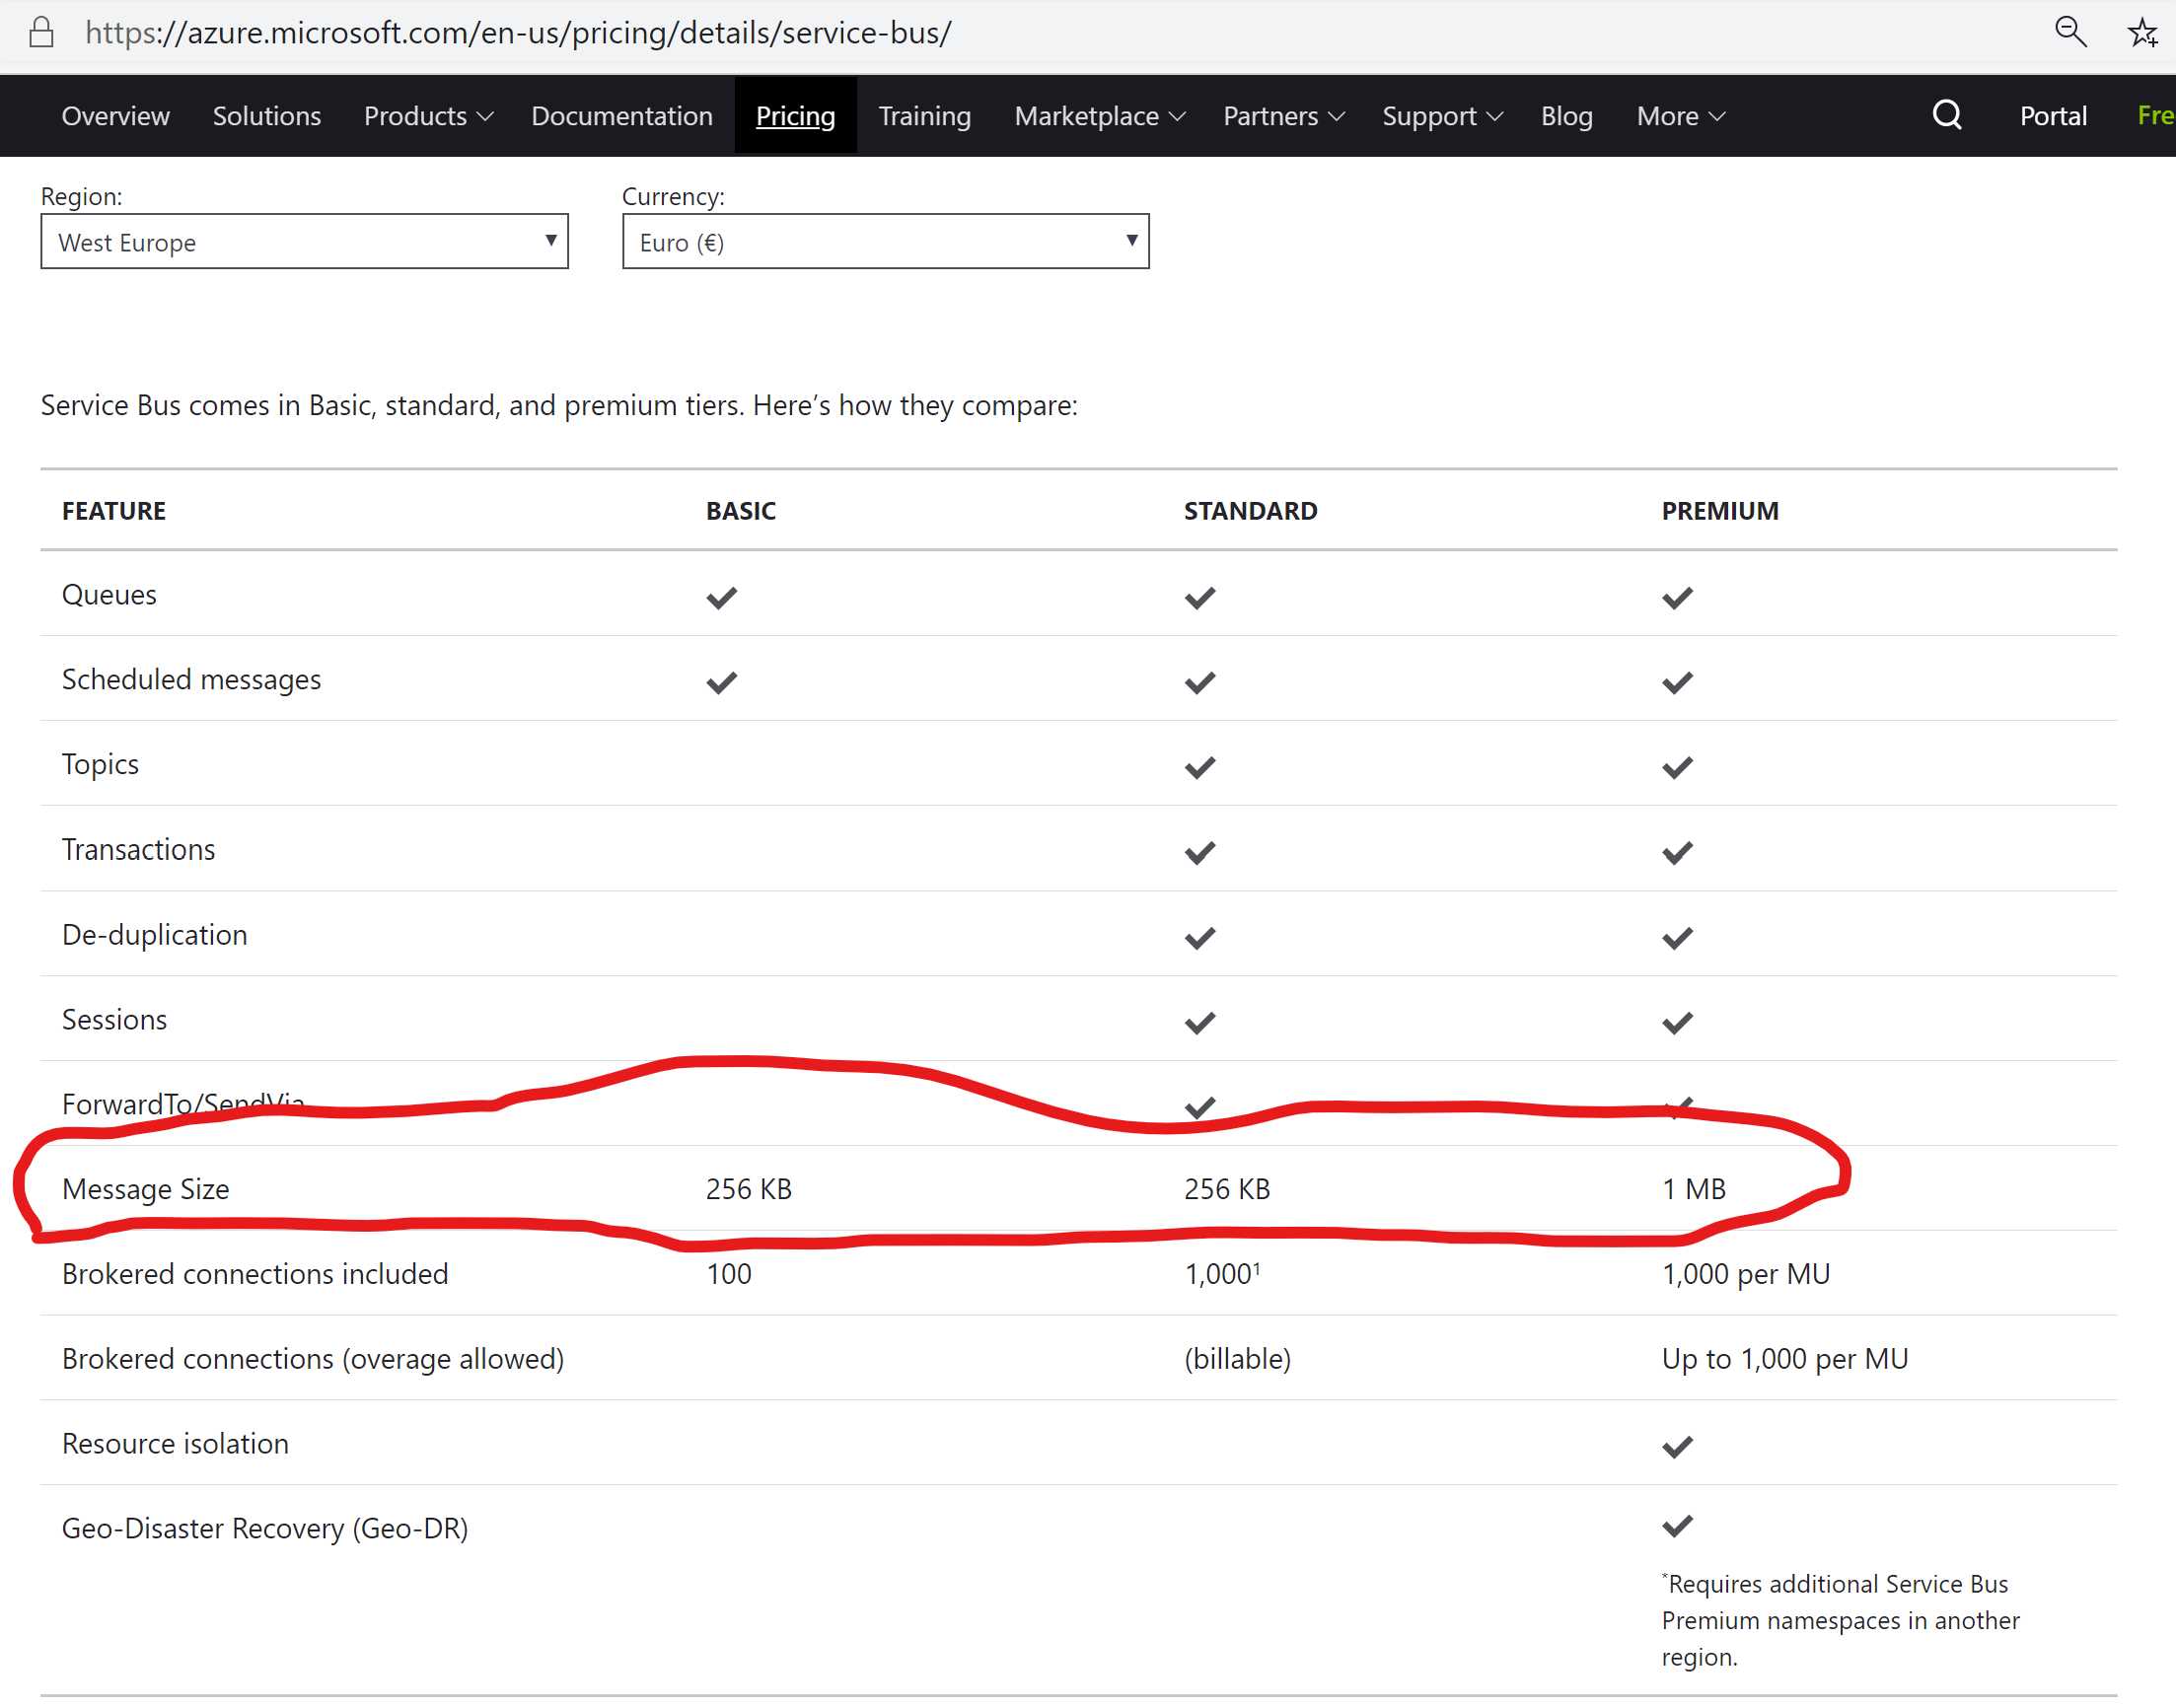
Figure 95: Azure Service Bus pricing details
Azure Cost Management
Azure Cost Management is a tool that helps with planning and controlling cloud costs. You can identify spending trends and create monthly, quarterly, or yearly cost estimates.
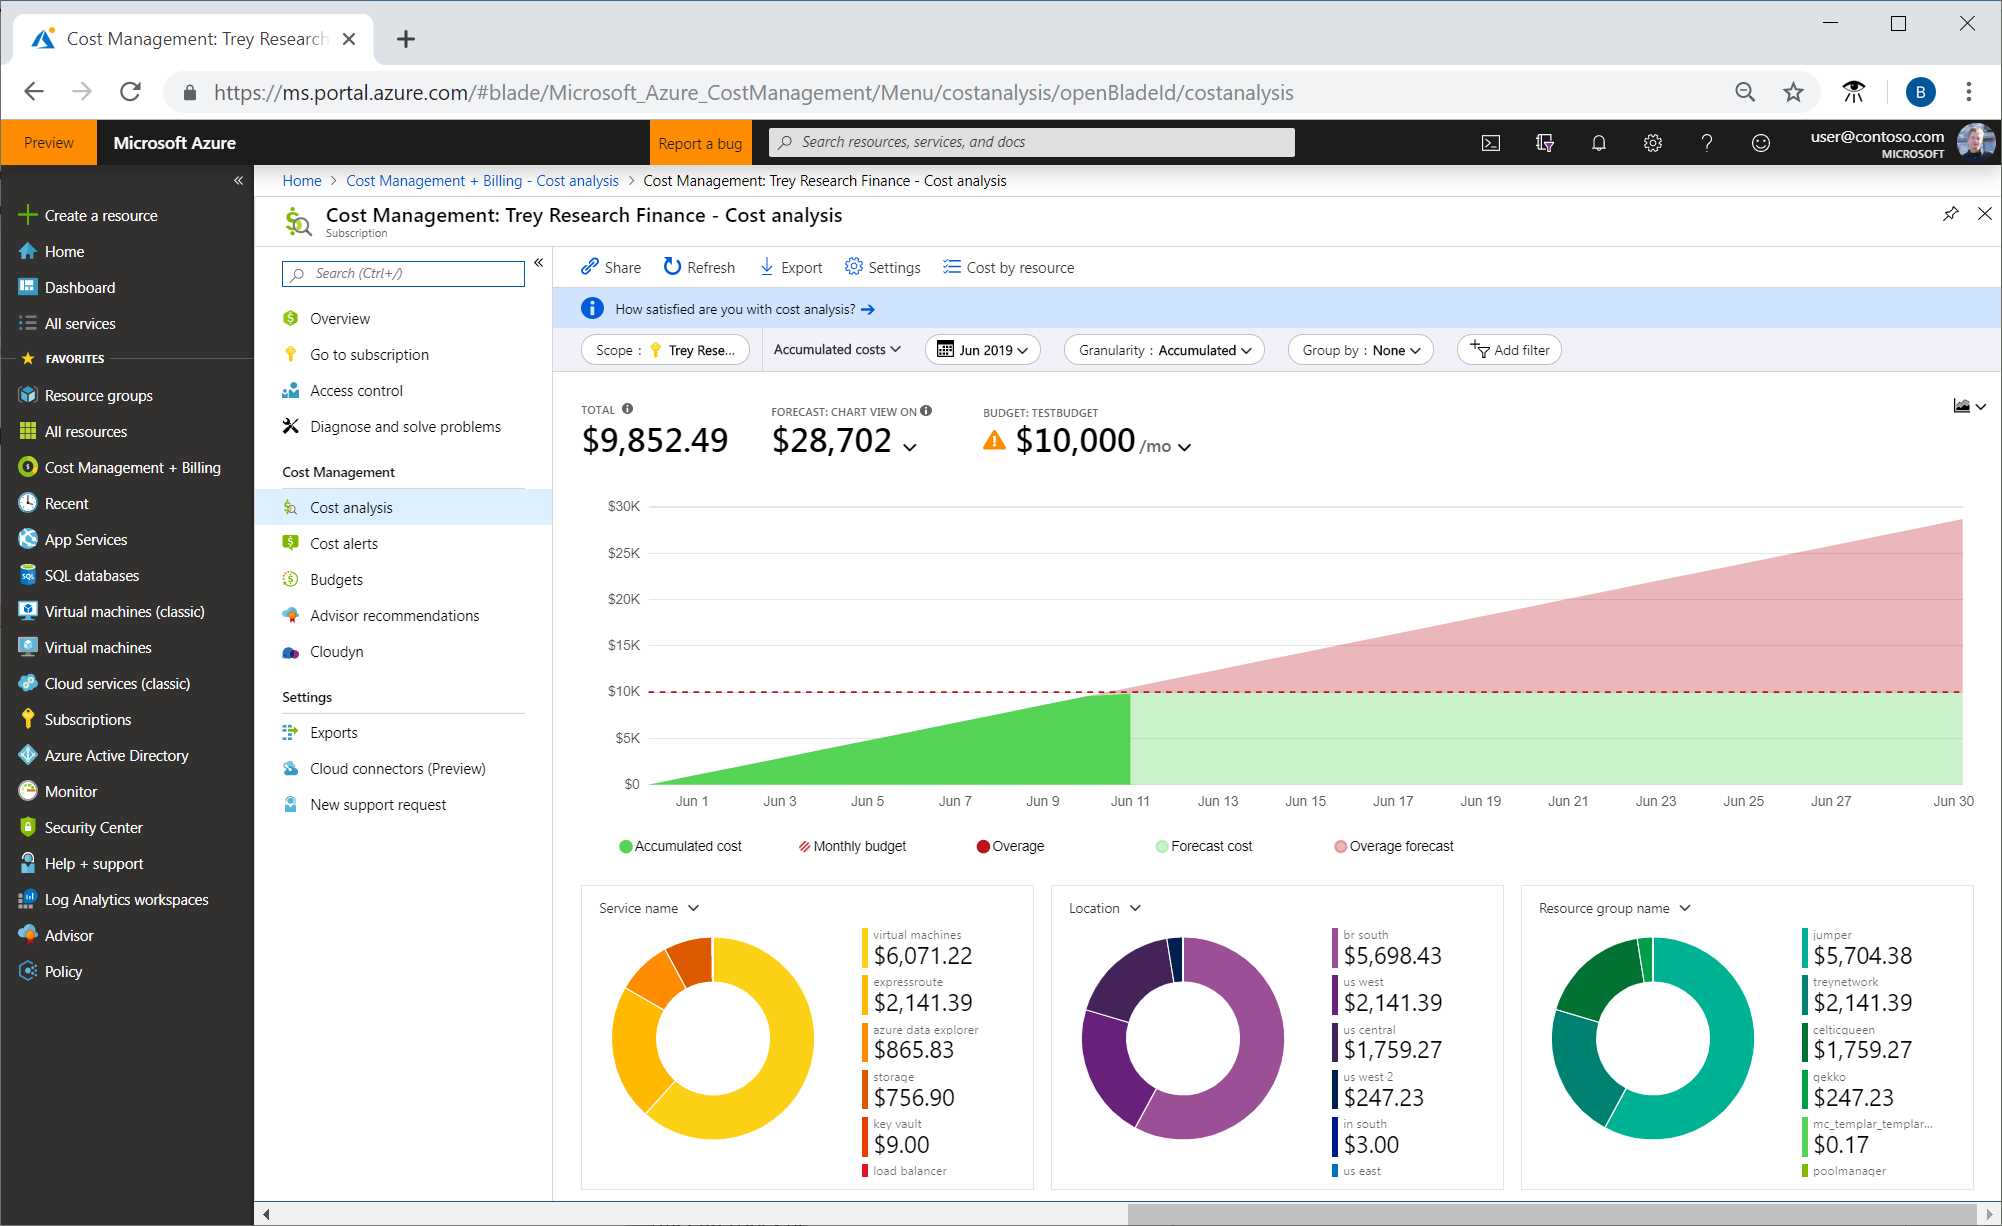
Figure 96: Azure Cost Management sample from the Azure documentation
Azure Cost Management can also be used with Google Cloud or AWS and it’s entirely free for Azure spending analysis.
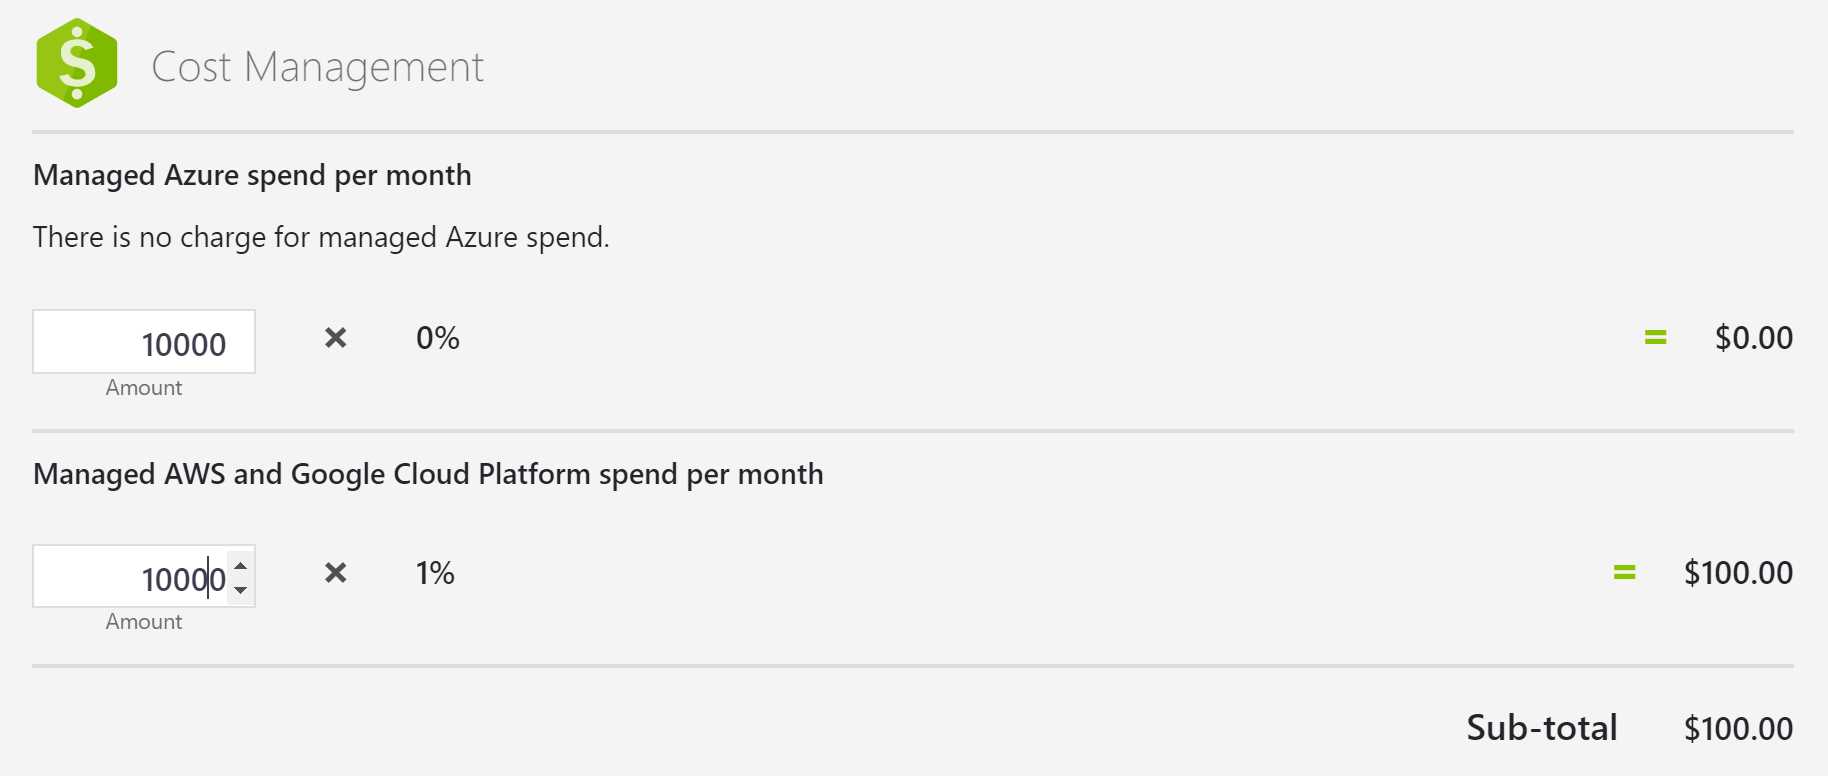
Figure 97: Azure Cost Management sample pricing
Azure Cost Insights
Azure Cost Insights is an Azure DevOps plugin that helps you visualize your team’s spending directly on the dashboard of your DevOps project.
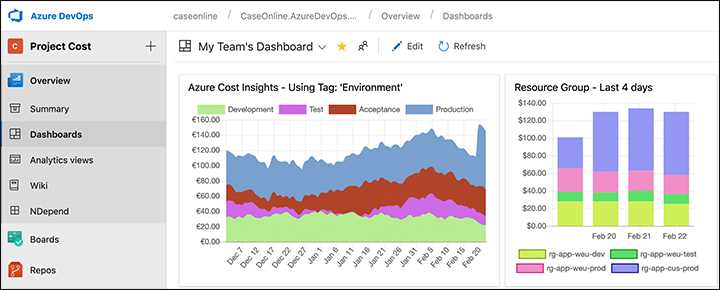
Figure 98: Azure Cost Insight sample picture from Visual Studio Marketplace
It has a free version (that includes a single widget) and different paid licenses.
- 1800+ high-performance UI components.
- Includes popular controls such as Grid, Chart, Scheduler, and more.
- 24x5 unlimited support by developers.